Passy Airbnb Market Analysis 2025: Short Term Rental Data & Vacation Rental Statistics in Auvergne-Rhône-Alpes, France
Is Airbnb profitable in Passy in 2025? Explore comprehensive Airbnb analytics for Passy, Auvergne-Rhône-Alpes, France to uncover income potential. This 2025 STR market report for Passy, based on AirROI data from April 2024 to March 2025, reveals key trends in the market of 232 active listings.
Whether you're considering an Airbnb investment in Passy, optimizing your existing vacation rental, or exploring rental arbitrage opportunities, understanding the Passy Airbnb data is crucial. Leveraging the low regulation environment is key to maximizing your short term rental income potential. Let's dive into the specifics.
Key Passy Airbnb Performance Metrics Overview
Monthly Airbnb Revenue Variations & Income Potential in Passy (2025)
Understanding the monthly revenue variations for Airbnb listings in Passy is key to maximizing your short term rental income potential. Seasonality significantly impacts earnings. Our analysis, based on data from the past 12 months, shows that the peak revenue month for STRs in Passy is typically February, while October often presents the lowest earnings, highlighting opportunities for strategic pricing adjustments during shoulder and low seasons. Explore the typical Airbnb income in Passy across different performance tiers:
- Best-in-class properties (Top 10%) achieve $2,850+ monthly, often utilizing dynamic pricing and superior guest experiences.
- Strong performing properties (Top 25%) earn $2,030 or more, indicating effective management and desirable locations/amenities.
- Typical properties (Median) generate around $1,296 per month, representing the average market performance.
- Entry-level properties (Bottom 25%) see earnings around $755, often with potential for optimization.
Average Monthly Airbnb Earnings Trend in Passy
Passy Airbnb Occupancy Rate Trends (2025)
Maximize your bookings by understanding the Passy STR occupancy trends. Seasonal demand shifts significantly influence how often properties are booked. Typically, Augustsees the highest demand (peak season occupancy), while April experiences the lowest (low season). Effective strategies, like adjusting minimum stays or offering promotions, can boost occupancy during slower periods. Here's how different property tiers perform in Passy:
- Best-in-class properties (Top 10%) achieve 84%+ occupancy, indicating high desirability and potentially optimized availability.
- Strong performing properties (Top 25%) maintain 66% or higher occupancy, suggesting good market fit and guest satisfaction.
- Typical properties (Median) have an occupancy rate around 45%.
- Entry-level properties (Bottom 25%) average 26% occupancy, potentially facing higher vacancy.
Average Monthly Occupancy Rate Trend in Passy
Average Daily Rate (ADR) Airbnb Trends in Passy (2025)
Effective short term rental pricing strategy in Passy involves understanding monthly ADR fluctuations. The Average Daily Rate (ADR) for Airbnb in Passy typically peaks in February and dips lowest during November. Leveraging Airbnb dynamic pricing tools or strategies based on this seasonality can significantly boost revenue. Here's a look at the typical nightly rates achieved:
- Best-in-class properties (Top 10%) command rates of $189+ per night, often due to premium features or locations.
- Strong performing properties (Top 25%) achieve nightly rates of $122 or more.
- Typical properties (Median) charge around $89 per night.
- Entry-level properties (Bottom 25%) earn around $67 per night.
Average Daily Rate (ADR) Trend by Month in Passy
Get Live Passy Market Intelligence 👇

Explore Real-time Analytics
Airbnb Seasonality Analysis & Trends in Passy (2025)
Peak Season (February, August, July)
- Revenue averages $2,220 per month
- Occupancy rates average 66.1%
- Daily rates average $119
Shoulder Season
- Revenue averages $1,453 per month
- Occupancy maintains around 40.7%
- Daily rates hold near $116
Low Season (September, October, November)
- Revenue drops to average $1,062 per month
- Occupancy decreases to average 38.1%
- Daily rates adjust to average $111
Seasonality Insights for Passy
- The Airbnb seasonality in Passy shows highly seasonal trends requiring careful strategy. While the sections above show seasonal averages, it's also insightful to look at the extremes:
- During the high season, the absolute peak month showcases Passy's highest earning potential, with monthly revenues capable of climbing to $2,414, occupancy reaching a high of 69.5%, and ADRs peaking at $125.
- Conversely, the slowest single month of the year, typically falling within the low season, marks the market's lowest point. In this month, revenue might dip to $953, occupancy could drop to 32.9%, and ADRs may adjust down to $109.
- Understanding both the seasonal averages and these monthly peaks and troughs in revenue, occupancy, and ADR is crucial for maximizing your Airbnb profit potential in Passy.
Seasonal Strategies for Maximizing Profit
- Peak Season: Maximize revenue through premium pricing and potentially longer minimum stays. Ensure high availability.
- Low Season: Offer competitive pricing, special promotions (e.g., extended stay discounts), and flexible cancellation policies. Target off-season travelers like remote workers or budget-conscious guests.
- Shoulder Seasons: Implement dynamic pricing that balances peak and low rates. Target weekend travelers or specific events. Offer slightly more flexible terms than peak season.
- Regularly analyze your own performance against these Passy seasonality benchmarks and adjust your pricing and availability strategy accordingly.
Best Areas for Airbnb Investment in Passy (2025)
Exploring the top neighborhoods for short-term rentals in Passy? This section highlights key areas, outlining why they are attractive for hosts and guests, along with notable local attractions. Consider these locations based on your target guest profile and investment strategy.
| Neighborhood / Area | Why Host Here? (Target Guests & Appeal) | Key Attractions & Landmarks |
|---|---|---|
| Le Mont Dore | A charming mountain village known for its ski resorts and thermal springs. Ideal for tourists seeking winter sports and nature activities year-round. | Mont Dore Ski Resort, Puy de Sancy, Thermal Baths, Lac de Guéry, Château de la Chassenon |
| Issoire | A picturesque town renowned for its historical architecture and proximity to the Livradois-Forez Regional Nature Park. Offers a unique blend of culture and nature. | Saint-Austremoine Church, Issoire Old Town, Livradois-Forez Park, Château de Parentignat, Local markets |
| Clermont-Ferrand | The largest city in the Auvergne region known for its volcanic landscape and rich history. Attracts visitors for both business and leisure with numerous cultural attractions. | Puy de Dôme, Clermont-Ferrand Cathedral, L'Aventure Michelin, Rooftop views of the volcanoes, Place de Jaude |
| Saint-Nectaire | Famous for its cheese and serene natural surroundings. Popular among tourists looking for a quiet escape in the heart of the volcanoes. | Saint-Nectaire Cheese Farms, Church of Saint-Nectaire, Nature trails, Volcanic landscapes, Local artisanal shops |
| Besse-et-Saint-Anastaise | A historical town that offers ski and hiking activities, ideal for families and outdoor enthusiasts. Close to various natural attractions. | Besse Ski Resort, Historic Besse town center, Lac Pavin, Puy du Sancy, Hiking trails |
| Vulcania | An amusement park dedicated to volcanoes and earth sciences, attracting families and educational groups. Unique experience to learn about geology and volcanology. | Vulcania Park, Interactive exhibits, Volcanic simulator, Scenic views, Workshops |
| RIom | A small town with charming historical sites and a lively atmosphere, providing an affordable base to explore the Auvergne region. | Riom Old Town, Château de Riom, Local cuisine, Cultural events, Nearby hiking trails |
| La Bourboule | A spa town famous for its thermal springs, attracting visitors seeking wellness and relaxation amidst beautiful mountain scenery. | Thermal baths, Spas, Nature parks, Walking trails, Winter sports facilities |
Understanding Airbnb License Requirements & STR Laws in Passy (2025)
While Passy, Auvergne-Rhône-Alpes, France currently shows low STR regulations, specific Airbnb license requirements might still exist or change. Always verify the latest short term rental regulations and Airbnb license requirements directly with local government authorities for Passy to ensure full compliance before hosting.
(Source: AirROI data, 2025, based on 8% licensed listings)
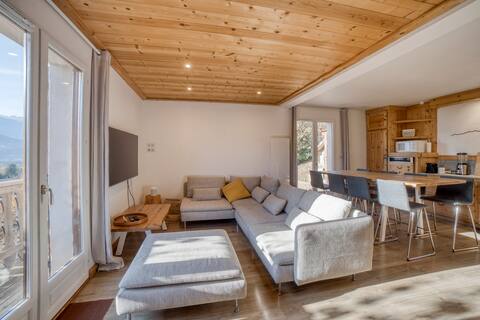
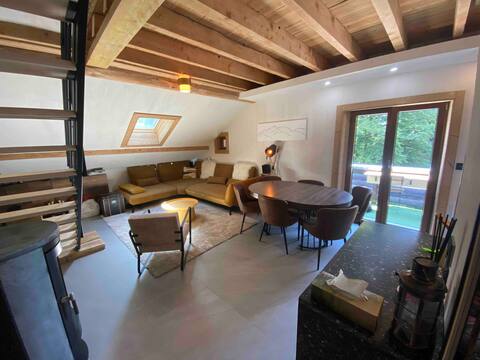
Top Performing Airbnb Properties in Passy (2025)
Benchmark your potential! Explore examples of top-performing Airbnb properties in Passybased on Trailing Twelve Month (TTM) revenue. Analyze their characteristics, revenue, occupancy rate, and ADR to understand what drives success in this market.
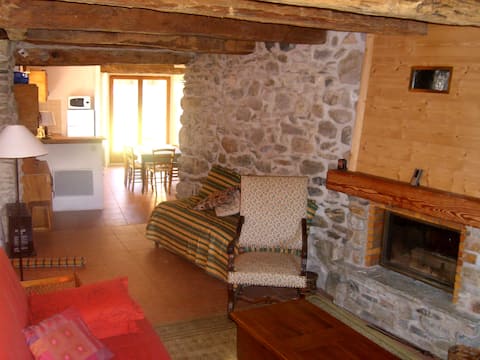
SAVOYARD CHALET FACING MONT BLANC
Entire Place • 6 bedrooms

Les Edelweiss Mont-Blanc - Close to Chamonix
Entire Place • 4 bedrooms
Chalet Passy Mont-Blanc 6/8 people
Entire Place • 4 bedrooms
La casa aspi dir
Entire Place • 3 bedrooms
Ideal ski and hiking apartment
Entire Place • 4 bedrooms

Apart 7pax | Valley&Mounts View | Balcony | Light
Entire Place • 3 bedrooms
Note: Performance varies based on location, size, amenities, seasonality, and management quality. Data reflects the past 12 months.
Top Performing Airbnb Hosts in Passy (2025)
Learn from the best! This table showcases top-performing Airbnb hosts in Passy based on the number of properties managed and estimated total revenue over the past year. Analyze their scale and performance metrics.
| Host Name | Properties | Grossing Revenue | Stay Reviews | Avg Rating |
|---|---|---|---|---|
| ManaHomes | 2 | $67,043 | 117 | 4.76/5.0 |
| Benoit | 1 | $64,302 | 83 | 4.43/5.0 |
| Christophe | 1 | $63,780 | 23 | 4.48/5.0 |
| Marie-Françoise | 4 | $50,411 | 187 | 4.95/5.0 |
| Cindy | 1 | $49,948 | 5 | 4.80/5.0 |
| Bérénice | 2 | $37,858 | 33 | 4.97/5.0 |
| Daisy | 2 | $37,181 | 55 | 4.83/5.0 |
| Nadege | 2 | $36,718 | 314 | 4.93/5.0 |
| Sandrine | 1 | $36,334 | 9 | 5.00/5.0 |
| Ella | 1 | $35,924 | 29 | 4.69/5.0 |
Analyzing the strategies of top hosts, such as their property selection, pricing, and guest communication, can offer valuable lessons for optimizing your own Airbnb operations in Passy.
Dive Deeper: Advanced Passy STR Market Data (2025)
Ready to unlock more insights? AirROI provides access to advanced metrics and comprehensive Airbnb data for Passy. Explore detailed analytics beyond this report to refine your investment strategy, optimize pricing, and maximize your vacation rental profits.
Explore Advanced MetricsPassy Short-Term Rental Market Composition (2025): Property & Room Types
Room Type Distribution
Property Type Distribution
Market Composition Insights for Passy
- The Passy Airbnb market composition is heavily skewed towards Entire Home/Apt listings, which make up 93.5% of the 232 active rentals. This indicates strong guest preference for privacy and space.
- Looking at the property type distribution in Passy, Apartment/Condo properties are the most common (65.5%), reflecting the local real estate landscape.
- Houses represent a significant 28.9% portion, catering likely to families or larger groups.
- Smaller segments like hotel/boutique, outdoor/unique, others, unique stays (combined 5.7%) offer potential for unique stay experiences.
Passy Airbnb Room Capacity Analysis (2025): Bedroom Distribution
Distribution of Listings by Number of Bedrooms
Room Capacity Insights for Passy
- The dominant room capacity in Passy is 1 bedroom listings, making up 40.5% of the market. This suggests a strong demand for properties suitable for couples or solo travelers.
- Together, 1 bedroom and 2 bedrooms properties represent 65.9% of the active Airbnb listings in Passy, indicating a high concentration in these sizes.
- A significant 24.6% of listings offer 3+ bedrooms, catering to larger groups and families seeking more space in Passy.
Passy Vacation Rental Guest Capacity Trends (2025)
Distribution of Listings by Guest Capacity
Guest Capacity Insights for Passy
- The most common guest capacity trend in Passy vacation rentals is listings accommodating 4 guests (29.7%). This suggests the primary traveler segment is likely small families or groups.
- Properties designed for 4 guests and 2 guests dominate the Passy STR market, accounting for 50.0% of listings.
- 31.4% of properties accommodate 6+ guests, serving the market segment for larger families or group travel in Passy.
- On average, properties in Passy are equipped to host 4.3 guests.
Passy Airbnb Booking Patterns (2025): Available vs. Booked Days
Available Days Distribution
Booked Days Distribution
Booking Pattern Insights for Passy
- The most common availability pattern in Passy falls within the 181-270 days range, representing 35.8% of listings. This suggests many properties have significant open periods on their calendars.
- Approximately 69.0% of listings show high availability (181+ days open annually), indicating potential for increased bookings or specific owner usage patterns.
- For booked days, the 91-180 days range is most frequent in Passy (36.6%), reflecting common guest stay durations or potential owner blocking patterns.
- A notable 34.1% of properties secure long booking periods (181+ days booked per year), highlighting successful long-term rental strategies or significant owner usage.
Passy Airbnb Minimum Stay Requirements Analysis
Distribution of Listings by Minimum Night Requirement
1 Night
19 listings
8.6% of total
2 Nights
53 listings
24% of total
3 Nights
35 listings
15.8% of total
4-6 Nights
61 listings
27.6% of total
7-29 Nights
13 listings
5.9% of total
30+ Nights
40 listings
18.1% of total
Key Insights
- The most prevalent minimum stay requirement in Passy is 4-6 Nights, adopted by 27.6% of listings. This highlights the market's preference for longer commitments.
- A significant segment (18.1%) caters to monthly stays (30+ nights) in Passy, pointing to opportunities in the extended-stay market.
Recommendations
- Align with the market by considering a 4-6 Nights minimum stay, as 27.6% of Passy hosts use this setting.
- If feasible, allowing 1-night stays, especially midweek or during low season, could capture last-minute bookings, as only 8.6% currently do.
- Explore offering discounts for stays of 30+ nights to attract the 18.1% of the market seeking extended stays.
- Adjust minimum nights based on seasonality – potentially shorter during low season and longer during peak demand periods in Passy.
Passy Airbnb Cancellation Policy Trends Analysis (2025)
Flexible
32 listings
15.2% of total
Moderate
65 listings
30.8% of total
Firm
54 listings
25.6% of total
Strict
60 listings
28.4% of total
Cancellation Policy Insights for Passy
- The prevailing Airbnb cancellation policy trend in Passy is Moderate, used by 30.8% of listings.
- A majority (54.0%) of hosts in Passy utilize Firm or Strict policies, indicating a market where hosts prioritize booking security.
Recommendations for Hosts
- Consider adopting a Moderate policy to align with the 30.8% market standard in Passy.
- Regularly review your cancellation policy against competitors and market demand shifts in Passy.
Passy STR Booking Lead Time Analysis (2025)
Average Booking Lead Time by Month
Booking Lead Time Insights for Passy
- The overall average booking lead time for vacation rentals in Passy is 60 days.
- Guests book furthest in advance for stays during July (average 103 days), likely coinciding with peak travel demand or local events.
- The shortest booking windows occur for stays in October (average 43 days), indicating more last-minute travel plans during this time.
- Seasonally, Summer (88 days avg.) sees the longest lead times, while Fall (49 days avg.) has the shortest, reflecting typical travel planning cycles.
Recommendations for Hosts
- Use the overall average lead time (60 days) as a baseline for your pricing and availability strategy in Passy.
- For July stays, consider implementing length-of-stay discounts or slightly higher rates for bookings made less than 103 days out to capitalize on advance planning.
- Target marketing efforts for the Summer season well in advance (at least 88 days) to capture early planners.
- Monitor your own booking lead times against these Passy averages to identify opportunities for dynamic pricing adjustments.
Popular & Essential Airbnb Amenities in Passy (2025)
Amenity Prevalence
Amenity Insights for Passy
- Essential amenities in Passy that guests expect include: Heating, Kitchen. Lacking these (any) could significantly impact bookings.
- Popular amenities like Free parking on premises, Hot water, Dishes and silverware are common but not universal. Offering these can provide a competitive edge.
Recommendations for Hosts
- Ensure your listing includes all essential amenities for Passy: Heating, Kitchen.
- Prioritize adding missing essentials: Heating, Kitchen.
- Consider adding popular differentiators like Free parking on premises or Hot water to increase appeal.
- Highlight unique or less common amenities you offer (e.g., hot tub, dedicated workspace, EV charger) in your listing description and photos.
- Regularly check competitor amenities in Passy to stay competitive.
Passy Airbnb Guest Demographics & Profile Analysis (2025)
Guest Profile Summary for Passy
- The typical guest profile for Airbnb in Passy consists of primarily domestic travelers (69%), often arriving from nearby Paris, typically belonging to the Post-2000s (Gen Z/Alpha) group (50%), primarily speaking French or English.
- Domestic travelers account for 69.2% of guests.
- Key international markets include France (69.2%) and United Kingdom (4.3%).
- Top languages spoken are French (36.8%) followed by English (32.9%).
- A significant demographic segment is the Post-2000s (Gen Z/Alpha) group, representing 50% of guests.
Recommendations for Hosts
- Target domestic marketing efforts towards travelers from Paris and Lyon.
- Tailor amenities and listing descriptions to appeal to the dominant Post-2000s (Gen Z/Alpha) demographic (e.g., highlight fast WiFi, smart home features, local guides).
- Highlight unique local experiences or amenities relevant to the primary guest profile.
- Consider seasonal promotions aligned with peak travel times for key origin markets.
Nearby Short-Term Rental Market Comparison
How does the Passy Airbnb market stack up against its neighbors? Compare key performance metrics like average monthly revenue, ADR, and occupancy rates in surrounding areas to understand the broader regional STR landscape.
| Market | Active Properties | Monthly Revenue | Daily Rate | Avg. Occupancy |
|---|---|---|---|---|
| Lauterbrunnen | 525 | $7,079 | $546.45 | 54% |
| La Rivière-Enverse | 17 | $5,972 | $624.02 | 41% |
| Les Clefs | 30 | $5,741 | $323.11 | 44% |
| Matten bei Interlaken | 52 | $5,674 | $316.63 | 63% |
| Iseltwald | 14 | $5,491 | $331.95 | 58% |
| Habkern | 13 | $5,382 | $344.74 | 50% |
| Interlaken | 288 | $4,987 | $310.52 | 56% |
| Zermatt | 734 | $4,604 | $463.00 | 46% |
| Oberhofen am Thunersee | 24 | $4,572 | $265.94 | 55% |
| Monteu Roero | 16 | $4,432 | $540.14 | 36% |