Onnion Airbnb Market Analysis 2025: Short Term Rental Data & Vacation Rental Statistics in Auvergne-Rhône-Alpes, France
Is Airbnb profitable in Onnion in 2025? Explore comprehensive Airbnb analytics for Onnion, Auvergne-Rhône-Alpes, France to uncover income potential. This 2025 STR market report for Onnion, based on AirROI data from April 2024 to March 2025, reveals key trends in the niche market of 24 active listings.
Whether you're considering an Airbnb investment in Onnion, optimizing your existing vacation rental, or exploring rental arbitrage opportunities, understanding the Onnion Airbnb data is crucial. Leveraging the low regulation environment is key to maximizing your short term rental income potential. Let's dive into the specifics.
Key Onnion Airbnb Performance Metrics Overview
Monthly Airbnb Revenue Variations & Income Potential in Onnion (2025)
Understanding the monthly revenue variations for Airbnb listings in Onnion is key to maximizing your short term rental income potential. Seasonality significantly impacts earnings. Our analysis, based on data from the past 12 months, shows that the peak revenue month for STRs in Onnion is typically August, while October often presents the lowest earnings, highlighting opportunities for strategic pricing adjustments during shoulder and low seasons. Explore the typical Airbnb income in Onnion across different performance tiers:
- Best-in-class properties (Top 10%) achieve $2,476+ monthly, often utilizing dynamic pricing and superior guest experiences.
- Strong performing properties (Top 25%) earn $1,443 or more, indicating effective management and desirable locations/amenities.
- Typical properties (Median) generate around $892 per month, representing the average market performance.
- Entry-level properties (Bottom 25%) see earnings around $419, often with potential for optimization.
Average Monthly Airbnb Earnings Trend in Onnion
Onnion Airbnb Occupancy Rate Trends (2025)
Maximize your bookings by understanding the Onnion STR occupancy trends. Seasonal demand shifts significantly influence how often properties are booked. Typically, Augustsees the highest demand (peak season occupancy), while October experiences the lowest (low season). Effective strategies, like adjusting minimum stays or offering promotions, can boost occupancy during slower periods. Here's how different property tiers perform in Onnion:
- Best-in-class properties (Top 10%) achieve 72%+ occupancy, indicating high desirability and potentially optimized availability.
- Strong performing properties (Top 25%) maintain 56% or higher occupancy, suggesting good market fit and guest satisfaction.
- Typical properties (Median) have an occupancy rate around 37%.
- Entry-level properties (Bottom 25%) average 20% occupancy, potentially facing higher vacancy.
Average Monthly Occupancy Rate Trend in Onnion
Average Daily Rate (ADR) Airbnb Trends in Onnion (2025)
Effective short term rental pricing strategy in Onnion involves understanding monthly ADR fluctuations. The Average Daily Rate (ADR) for Airbnb in Onnion typically peaks in July and dips lowest during January. Leveraging Airbnb dynamic pricing tools or strategies based on this seasonality can significantly boost revenue. Here's a look at the typical nightly rates achieved:
- Best-in-class properties (Top 10%) command rates of $176+ per night, often due to premium features or locations.
- Strong performing properties (Top 25%) achieve nightly rates of $90 or more.
- Typical properties (Median) charge around $66 per night.
- Entry-level properties (Bottom 25%) earn around $57 per night.
Average Daily Rate (ADR) Trend by Month in Onnion
Get Live Onnion Market Intelligence 👇

Explore Real-time Analytics
Airbnb Seasonality Analysis & Trends in Onnion (2025)
Peak Season (August, February, July)
- Revenue averages $1,537 per month
- Occupancy rates average 58.9%
- Daily rates average $94
Shoulder Season
- Revenue averages $1,129 per month
- Occupancy maintains around 36.0%
- Daily rates hold near $89
Low Season (September, October, November)
- Revenue drops to average $738 per month
- Occupancy decreases to average 29.0%
- Daily rates adjust to average $89
Seasonality Insights for Onnion
- The Airbnb seasonality in Onnion shows highly seasonal trends requiring careful strategy. While the sections above show seasonal averages, it's also insightful to look at the extremes:
- During the high season, the absolute peak month showcases Onnion's highest earning potential, with monthly revenues capable of climbing to $1,722, occupancy reaching a high of 68.3%, and ADRs peaking at $96.
- Conversely, the slowest single month of the year, typically falling within the low season, marks the market's lowest point. In this month, revenue might dip to $612, occupancy could drop to 23.7%, and ADRs may adjust down to $82.
- Understanding both the seasonal averages and these monthly peaks and troughs in revenue, occupancy, and ADR is crucial for maximizing your Airbnb profit potential in Onnion.
Seasonal Strategies for Maximizing Profit
- Peak Season: Maximize revenue through premium pricing and potentially longer minimum stays. Ensure high availability.
- Low Season: Offer competitive pricing, special promotions (e.g., extended stay discounts), and flexible cancellation policies. Target off-season travelers like remote workers or budget-conscious guests.
- Shoulder Seasons: Implement dynamic pricing that balances peak and low rates. Target weekend travelers or specific events. Offer slightly more flexible terms than peak season.
- Regularly analyze your own performance against these Onnion seasonality benchmarks and adjust your pricing and availability strategy accordingly.
Best Areas for Airbnb Investment in Onnion (2025)
Exploring the top neighborhoods for short-term rentals in Onnion? This section highlights key areas, outlining why they are attractive for hosts and guests, along with notable local attractions. Consider these locations based on your target guest profile and investment strategy.
| Neighborhood / Area | Why Host Here? (Target Guests & Appeal) | Key Attractions & Landmarks |
|---|---|---|
| Vichy | A historic spa town renowned for its thermal springs and wellness centers. Attracts visitors looking for relaxation and rejuvenation in a charming setting with beautiful architecture. | Vichy Thermal Baths, Vichy Opera House, Parks of Vichy, Lac d'Allier, Vichy Museum |
| Clermont-Ferrand | The capital of the Auvergne region, known for its rich history, volcanic landscapes, and vibrant cultural scene. A great spot for urban explorers and nature lovers alike, with proximity to the Puys chain of volcanoes. | Puy de Dôme, Clermont-Ferrand Cathedral, Place de Jaude, L'Aventure Michelin, Montjuzet Park |
| Saint-Étienne | An industrial and design city with a strong cultural vibe. Increasingly popular among young travelers looking for unique experiences and local art scenes. | Museum of Modern Art, Cité du Design, Saint-Étienne Cathedral, Parc de L'Europe, The Bâtie Museum |
| Montluçon | Home to medieval architecture and a rich industrial history, Montluçon attracts those interested in culture and history and offers scenic spots along the Cher River. | Château des Ducs de Bourbon, Old Montluçon, Maison de la Culture de Montluçon, Parc des Iles, Eglise Saint-Pierre].},{ |
Understanding Airbnb License Requirements & STR Laws in Onnion (2025)
While Onnion, Auvergne-Rhône-Alpes, France currently shows low STR regulations, specific Airbnb license requirements might still exist or change. Always verify the latest short term rental regulations and Airbnb license requirements directly with local government authorities for Onnion to ensure full compliance before hosting.
(Source: AirROI data, 2025, finding no licensed listings among those analyzed)
Top Performing Airbnb Properties in Onnion (2025)
Benchmark your potential! Explore examples of top-performing Airbnb properties in Onnionbased on Trailing Twelve Month (TTM) revenue. Analyze their characteristics, revenue, occupancy rate, and ADR to understand what drives success in this market.
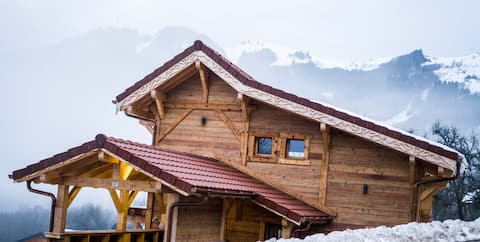
Atypical chalet near ski resorts
Entire Place • 2 bedrooms
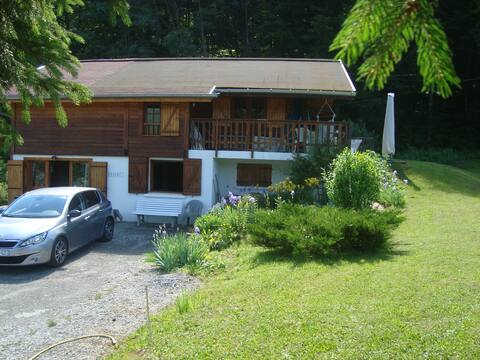
Chalet 6/8 people in nature but not isolated
Entire Place • 3 bedrooms

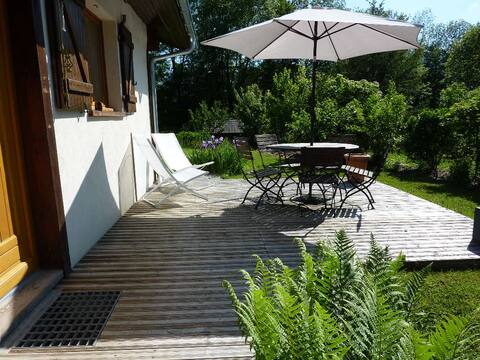
Chalet with HOT TUB
Entire Place • 3 bedrooms

Grand T2 - Mont Blanc view - La ferme des Chavannes
Entire Place • 1 bedroom
Gite des Sometys, in the heart of the mountains
Entire Place • 1 bedroom
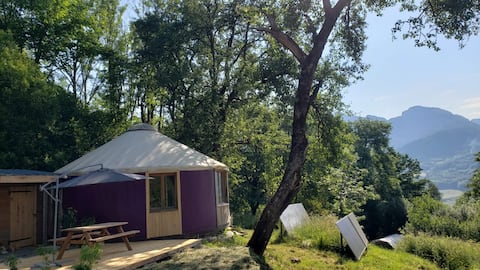
Quebec yurt
Entire Place • 1 bedroom
Note: Performance varies based on location, size, amenities, seasonality, and management quality. Data reflects the past 12 months.
Top Performing Airbnb Hosts in Onnion (2025)
Learn from the best! This table showcases top-performing Airbnb hosts in Onnion based on the number of properties managed and estimated total revenue over the past year. Analyze their scale and performance metrics.
| Host Name | Properties | Grossing Revenue | Stay Reviews | Avg Rating |
|---|---|---|---|---|
| Evelyne | 1 | $40,093 | 41 | 4.98/5.0 |
| Brigitte | 1 | $25,726 | 4 | 5.00/5.0 |
| Olivier | 1 | $21,203 | 43 | 4.63/5.0 |
| Delphine | 1 | $19,500 | 22 | 4.91/5.0 |
| Elise Et Adrien | 1 | $13,843 | 67 | 4.93/5.0 |
| Sylvio | 1 | $12,560 | 15 | 4.67/5.0 |
| Laura | 1 | $11,236 | 281 | 4.66/5.0 |
| Daniel | 1 | $10,733 | 78 | 4.94/5.0 |
| Matisse | 1 | $10,507 | 134 | 4.69/5.0 |
| Maryse | 1 | $10,237 | 38 | 5.00/5.0 |
Analyzing the strategies of top hosts, such as their property selection, pricing, and guest communication, can offer valuable lessons for optimizing your own Airbnb operations in Onnion.
Dive Deeper: Advanced Onnion STR Market Data (2025)
Ready to unlock more insights? AirROI provides access to advanced metrics and comprehensive Airbnb data for Onnion. Explore detailed analytics beyond this report to refine your investment strategy, optimize pricing, and maximize your vacation rental profits.
Explore Advanced MetricsOnnion Short-Term Rental Market Composition (2025): Property & Room Types
Room Type Distribution
Property Type Distribution
Market Composition Insights for Onnion
- The Onnion Airbnb market composition is heavily skewed towards Entire Home/Apt listings, which make up 95.8% of the 24 active rentals. This indicates strong guest preference for privacy and space.
- Looking at the property type distribution in Onnion, Apartment/Condo properties are the most common (50%), reflecting the local real estate landscape.
- Houses represent a significant 37.5% portion, catering likely to families or larger groups.
- The presence of 8.3% Hotel/Boutique listings indicates integration with traditional hospitality.
- Smaller segments like outdoor/unique (combined 4.2%) offer potential for unique stay experiences.
Onnion Airbnb Room Capacity Analysis (2025): Bedroom Distribution
Distribution of Listings by Number of Bedrooms
Room Capacity Insights for Onnion
- The dominant room capacity in Onnion is 1 bedroom listings, making up 54.2% of the market. This suggests a strong demand for properties suitable for couples or solo travelers.
- Together, 1 bedroom and 3 bedrooms properties represent 70.9% of the active Airbnb listings in Onnion, indicating a high concentration in these sizes.
- With over half the market (54.2%) consisting of studios or 1-bedroom units, Onnion is particularly well-suited for individuals or couples.
Onnion Vacation Rental Guest Capacity Trends (2025)
Distribution of Listings by Guest Capacity
Guest Capacity Insights for Onnion
- The most common guest capacity trend in Onnion vacation rentals is listings accommodating 4 guests (29.2%). This suggests the primary traveler segment is likely small families or groups.
- Properties designed for 4 guests and 3 guests dominate the Onnion STR market, accounting for 50.0% of listings.
- 25.0% of properties accommodate 6+ guests, serving the market segment for larger families or group travel in Onnion.
- On average, properties in Onnion are equipped to host 4.4 guests.
Onnion Airbnb Booking Patterns (2025): Available vs. Booked Days
Available Days Distribution
Booked Days Distribution
Booking Pattern Insights for Onnion
- The most common availability pattern in Onnion falls within the 271-366 days range, representing 45.8% of listings. This suggests many properties have significant open periods on their calendars.
- Approximately 83.3% of listings show high availability (181+ days open annually), indicating potential for increased bookings or specific owner usage patterns.
- For booked days, the 91-180 days range is most frequent in Onnion (37.5%), reflecting common guest stay durations or potential owner blocking patterns.
- A notable 20.8% of properties secure long booking periods (181+ days booked per year), highlighting successful long-term rental strategies or significant owner usage.
Onnion Airbnb Minimum Stay Requirements Analysis
Distribution of Listings by Minimum Night Requirement
1 Night
1 listings
4.3% of total
2 Nights
7 listings
30.4% of total
3 Nights
5 listings
21.7% of total
4-6 Nights
8 listings
34.8% of total
7-29 Nights
1 listings
4.3% of total
30+ Nights
1 listings
4.3% of total
Key Insights
- The most prevalent minimum stay requirement in Onnion is 4-6 Nights, adopted by 34.8% of listings. This highlights the market's preference for longer commitments.
Recommendations
- Align with the market by considering a 4-6 Nights minimum stay, as 34.8% of Onnion hosts use this setting.
- If feasible, allowing 1-night stays, especially midweek or during low season, could capture last-minute bookings, as only 4.3% currently do.
- A 2-night minimum appears standard (30.4%). Consider this for weekends or peak periods.
- Adjust minimum nights based on seasonality – potentially shorter during low season and longer during peak demand periods in Onnion.
Onnion Airbnb Cancellation Policy Trends Analysis (2025)
Flexible
5 listings
23.8% of total
Moderate
10 listings
47.6% of total
Firm
3 listings
14.3% of total
Strict
3 listings
14.3% of total
Cancellation Policy Insights for Onnion
- The prevailing Airbnb cancellation policy trend in Onnion is Moderate, used by 47.6% of listings.
- The market strongly favors guest-friendly terms, with 71.4% of listings offering Flexible or Moderate policies. This suggests guests in Onnion may expect booking flexibility.
Recommendations for Hosts
- Consider adopting a Moderate policy to align with the 47.6% market standard in Onnion.
- Using a Strict policy might deter some guests, as only 14.3% of listings use it. Evaluate if potential revenue protection outweighs possible lower booking rates.
- Regularly review your cancellation policy against competitors and market demand shifts in Onnion.
Onnion STR Booking Lead Time Analysis (2025)
Average Booking Lead Time by Month
Booking Lead Time Insights for Onnion
- The overall average booking lead time for vacation rentals in Onnion is 46 days.
- Guests book furthest in advance for stays during July (average 76 days), likely coinciding with peak travel demand or local events.
- The shortest booking windows occur for stays in November (average 19 days), indicating more last-minute travel plans during this time.
- Seasonally, Summer (68 days avg.) sees the longest lead times, while Fall (31 days avg.) has the shortest, reflecting typical travel planning cycles.
Recommendations for Hosts
- Use the overall average lead time (46 days) as a baseline for your pricing and availability strategy in Onnion.
- For July stays, consider implementing length-of-stay discounts or slightly higher rates for bookings made less than 76 days out to capitalize on advance planning.
- Target marketing efforts for the Summer season well in advance (at least 68 days) to capture early planners.
- Monitor your own booking lead times against these Onnion averages to identify opportunities for dynamic pricing adjustments.
Popular & Essential Airbnb Amenities in Onnion (2025)
Amenity Prevalence
Amenity Insights for Onnion
- Essential amenities in Onnion that guests expect include: Kitchen, Free parking on premises, Dishes and silverware, Heating. Lacking these (any) could significantly impact bookings.
- Popular amenities like TV, Hot water, Cooking basics are common but not universal. Offering these can provide a competitive edge.
Recommendations for Hosts
- Ensure your listing includes all essential amenities for Onnion: Kitchen, Free parking on premises, Dishes and silverware, Heating.
- Prioritize adding missing essentials: Dishes and silverware, Heating.
- Consider adding popular differentiators like TV or Hot water to increase appeal.
- Highlight unique or less common amenities you offer (e.g., hot tub, dedicated workspace, EV charger) in your listing description and photos.
- Regularly check competitor amenities in Onnion to stay competitive.
Onnion Airbnb Guest Demographics & Profile Analysis (2025)
Guest Profile Summary for Onnion
- The typical guest profile for Airbnb in Onnion consists of primarily domestic travelers (84%), often arriving from nearby Lyon, typically belonging to the Post-2000s (Gen Z/Alpha) group (50%), primarily speaking French or English.
- Domestic travelers account for 83.9% of guests.
- Key international markets include France (83.9%) and Switzerland (3.6%).
- Top languages spoken are French (40.8%) followed by English (30.8%).
- A significant demographic segment is the Post-2000s (Gen Z/Alpha) group, representing 50% of guests.
Recommendations for Hosts
- Target domestic marketing efforts towards travelers from Lyon and Paris.
- Tailor amenities and listing descriptions to appeal to the dominant Post-2000s (Gen Z/Alpha) demographic (e.g., highlight fast WiFi, smart home features, local guides).
- Highlight unique local experiences or amenities relevant to the primary guest profile.
- Consider seasonal promotions aligned with peak travel times for key origin markets.
Nearby Short-Term Rental Market Comparison
How does the Onnion Airbnb market stack up against its neighbors? Compare key performance metrics like average monthly revenue, ADR, and occupancy rates in surrounding areas to understand the broader regional STR landscape.
| Market | Active Properties | Monthly Revenue | Daily Rate | Avg. Occupancy |
|---|---|---|---|---|
| Lauterbrunnen | 525 | $7,079 | $546.45 | 54% |
| La Rivière-Enverse | 17 | $5,972 | $624.02 | 41% |
| Les Clefs | 30 | $5,741 | $323.11 | 44% |
| Matten bei Interlaken | 52 | $5,674 | $316.63 | 63% |
| Iseltwald | 14 | $5,491 | $331.95 | 58% |
| Habkern | 13 | $5,382 | $344.74 | 50% |
| Interlaken | 288 | $4,987 | $310.52 | 56% |
| Zermatt | 734 | $4,604 | $463.00 | 46% |
| Oberhofen am Thunersee | 24 | $4,572 | $265.94 | 55% |
| Sigriswil | 99 | $4,371 | $271.90 | 58% |