Nantua Airbnb Market Analysis 2025: Short Term Rental Data & Vacation Rental Statistics in Auvergne-Rhône-Alpes, France
Is Airbnb profitable in Nantua in 2025? Explore comprehensive Airbnb analytics for Nantua, Auvergne-Rhône-Alpes, France to uncover income potential. This 2025 STR market report for Nantua, based on AirROI data from April 2024 to March 2025, reveals key trends in the niche market of 29 active listings.
Whether you're considering an Airbnb investment in Nantua, optimizing your existing vacation rental, or exploring rental arbitrage opportunities, understanding the Nantua Airbnb data is crucial. Leveraging the low regulation environment is key to maximizing your short term rental income potential. Let's dive into the specifics.
Key Nantua Airbnb Performance Metrics Overview
Monthly Airbnb Revenue Variations & Income Potential in Nantua (2025)
Understanding the monthly revenue variations for Airbnb listings in Nantua is key to maximizing your short term rental income potential. Seasonality significantly impacts earnings. Our analysis, based on data from the past 12 months, shows that the peak revenue month for STRs in Nantua is typically May, while March often presents the lowest earnings, highlighting opportunities for strategic pricing adjustments during shoulder and low seasons. Explore the typical Airbnb income in Nantua across different performance tiers:
- Best-in-class properties (Top 10%) achieve $2,006+ monthly, often utilizing dynamic pricing and superior guest experiences.
- Strong performing properties (Top 25%) earn $1,590 or more, indicating effective management and desirable locations/amenities.
- Typical properties (Median) generate around $962 per month, representing the average market performance.
- Entry-level properties (Bottom 25%) see earnings around $516, often with potential for optimization.
Average Monthly Airbnb Earnings Trend in Nantua
Nantua Airbnb Occupancy Rate Trends (2025)
Maximize your bookings by understanding the Nantua STR occupancy trends. Seasonal demand shifts significantly influence how often properties are booked. Typically, Julysees the highest demand (peak season occupancy), while March experiences the lowest (low season). Effective strategies, like adjusting minimum stays or offering promotions, can boost occupancy during slower periods. Here's how different property tiers perform in Nantua:
- Best-in-class properties (Top 10%) achieve 82%+ occupancy, indicating high desirability and potentially optimized availability.
- Strong performing properties (Top 25%) maintain 62% or higher occupancy, suggesting good market fit and guest satisfaction.
- Typical properties (Median) have an occupancy rate around 46%.
- Entry-level properties (Bottom 25%) average 26% occupancy, potentially facing higher vacancy.
Average Monthly Occupancy Rate Trend in Nantua
Average Daily Rate (ADR) Airbnb Trends in Nantua (2025)
Effective short term rental pricing strategy in Nantua involves understanding monthly ADR fluctuations. The Average Daily Rate (ADR) for Airbnb in Nantua typically peaks in December and dips lowest during September. Leveraging Airbnb dynamic pricing tools or strategies based on this seasonality can significantly boost revenue. Here's a look at the typical nightly rates achieved:
- Best-in-class properties (Top 10%) command rates of $109+ per night, often due to premium features or locations.
- Strong performing properties (Top 25%) achieve nightly rates of $90 or more.
- Typical properties (Median) charge around $61 per night.
- Entry-level properties (Bottom 25%) earn around $44 per night.
Average Daily Rate (ADR) Trend by Month in Nantua
Get Live Nantua Market Intelligence 👇

Explore Real-time Analytics
Airbnb Seasonality Analysis & Trends in Nantua (2025)
Peak Season (May, April, June)
- Revenue averages $1,684 per month
- Occupancy rates average 53.7%
- Daily rates average $67
Shoulder Season
- Revenue averages $1,070 per month
- Occupancy maintains around 52.0%
- Daily rates hold near $69
Low Season (February, March, November)
- Revenue drops to average $564 per month
- Occupancy decreases to average 29.8%
- Daily rates adjust to average $71
Seasonality Insights for Nantua
- The Airbnb seasonality in Nantua shows highly seasonal trends requiring careful strategy. While the sections above show seasonal averages, it's also insightful to look at the extremes:
- During the high season, the absolute peak month showcases Nantua's highest earning potential, with monthly revenues capable of climbing to $1,720, occupancy reaching a high of 75.9%, and ADRs peaking at $76.
- Conversely, the slowest single month of the year, typically falling within the low season, marks the market's lowest point. In this month, revenue might dip to $484, occupancy could drop to 23.0%, and ADRs may adjust down to $66.
- Understanding both the seasonal averages and these monthly peaks and troughs in revenue, occupancy, and ADR is crucial for maximizing your Airbnb profit potential in Nantua.
Seasonal Strategies for Maximizing Profit
- Peak Season: Maximize revenue through premium pricing and potentially longer minimum stays. Ensure high availability.
- Low Season: Offer competitive pricing, special promotions (e.g., extended stay discounts), and flexible cancellation policies. Target off-season travelers like remote workers or budget-conscious guests.
- Shoulder Seasons: Implement dynamic pricing that balances peak and low rates. Target weekend travelers or specific events. Offer slightly more flexible terms than peak season.
- Regularly analyze your own performance against these Nantua seasonality benchmarks and adjust your pricing and availability strategy accordingly.
Best Areas for Airbnb Investment in Nantua (2025)
Exploring the top neighborhoods for short-term rentals in Nantua? This section highlights key areas, outlining why they are attractive for hosts and guests, along with notable local attractions. Consider these locations based on your target guest profile and investment strategy.
| Neighborhood / Area | Why Host Here? (Target Guests & Appeal) | Key Attractions & Landmarks |
|---|---|---|
| Lac de Nantua | Beautiful natural lake known for its stunning scenery and outdoor activities. Ideal for nature lovers and those seeking tranquility in a picturesque setting, attracting visitors for swimming, fishing, and hiking. | Nantua Lake, Les Gorges de la Fou, Hiking trails around the lake, Picnic areas, Water sports activities |
| Centre Ville de Nantua | The town center offers a mix of historical sites and local culture. Visitors enjoy exploring quaint streets, local shops, and eateries. It's a hub for tourists looking to experience the charm of a French town. | Monuments aux Morts, Église Saint-Michel, Local markets, Restaurants offering regional cuisine, Cultural events in the town square |
| Col de la Faucille | A mountain pass offering breathtaking views and ski resorts nearby. It's popular in winter for skiing, making it attractive for winter tourism and outdoor adventures, appealing to both thrill-seekers and families. | Ski resorts, Hiking trails, Stunning panoramic views, Picnic spots, Wildlife spotting |
| Parc Naturel Régional du Haut-Jura | This regional park is perfect for eco-tourists and nature enthusiasts. It offers diverse landscapes and wildlife, drawing visitors for hiking, biking, and enjoying the outdoors throughout the year. | Scenic hiking routes, Wildlife watching, Nature centers, Cultural heritage sites, Photography opportunities |
| Château de Nantua | A historical castle that attracts visitors for its architecture and historical significance. It’s a unique spot for guests interested in history, culture, and local heritage. | Tours of the castle, Historical exhibitions, Beautiful gardens around the castle, Scenic views of the area, Cultural festivals |
| Route des Cerveaux | Known for its stunning panoramic views and winding roads. It attracts driving tourists and bikers looking for scenic routes as well as those interested in local gastronomic products. | Scenic viewpoints, Local artisan shops, Restaurants featuring local cuisine, Cycling routes, Wine tasting locations |
| Médiathèque de Nantua | The media library is a cultural hub offering events, workshops, and exhibitions. It attracts tourists interested in local culture and arts, providing a different perspective on the area. | Cultural events, Workshops, local literature, Art exhibitions, Community gatherings |
| Les Routes des Vins du Bugey | This wine route offers the opportunity to taste wines and explore vineyards in the area. It attracts wine enthusiasts and gourmet tourists looking for unique experiences in local wine culture. | Vineyard tours, Wine tastings, Wine festivals, Local wine cellars, Gourmet food pairings |
Understanding Airbnb License Requirements & STR Laws in Nantua (2025)
While Nantua, Auvergne-Rhône-Alpes, France currently shows low STR regulations, specific Airbnb license requirements might still exist or change. Always verify the latest short term rental regulations and Airbnb license requirements directly with local government authorities for Nantua to ensure full compliance before hosting.
(Source: AirROI data, 2025, finding no licensed listings among those analyzed)
Top Performing Airbnb Properties in Nantua (2025)
Benchmark your potential! Explore examples of top-performing Airbnb properties in Nantuabased on Trailing Twelve Month (TTM) revenue. Analyze their characteristics, revenue, occupancy rate, and ADR to understand what drives success in this market.
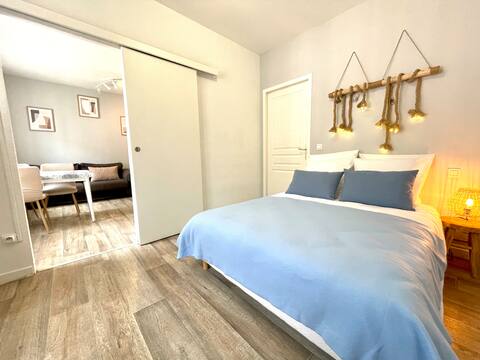
L 'azur - Downtown & Lake
Entire Place • 1 bedroom
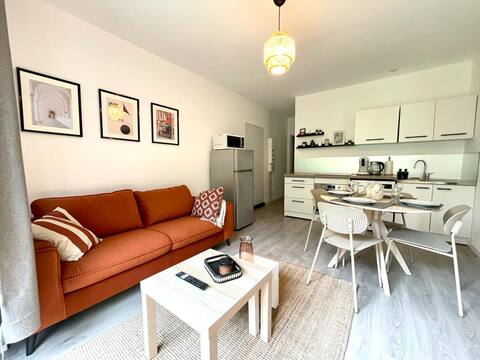
Le Jardin - Quiet and Comfort
Entire Place • 1 bedroom
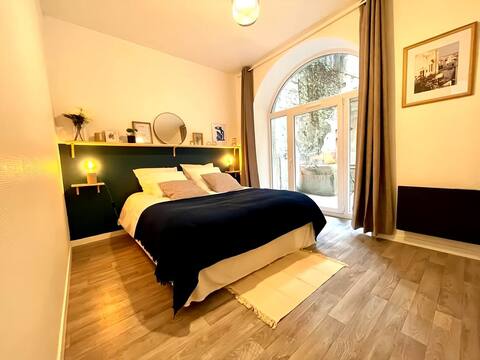
Le Patio - Renové & Close to Lake
Entire Place • 1 bedroom
Apt on the ground floor in front of the lake
Entire Place • 1 bedroom
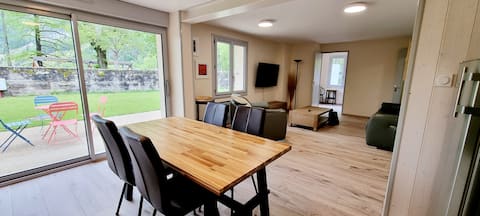
Large modern apartment
Entire Place • 3 bedrooms

charmant duplex
Entire Place • 2 bedrooms
Note: Performance varies based on location, size, amenities, seasonality, and management quality. Data reflects the past 12 months.
Top Performing Airbnb Hosts in Nantua (2025)
Learn from the best! This table showcases top-performing Airbnb hosts in Nantua based on the number of properties managed and estimated total revenue over the past year. Analyze their scale and performance metrics.
| Host Name | Properties | Grossing Revenue | Stay Reviews | Avg Rating |
|---|---|---|---|---|
| Malvina | 8 | $65,323 | 130 | 4.52/5.0 |
| Romain | 3 | $58,793 | 153 | 4.63/5.0 |
| Aridson | 5 | $29,321 | 160 | 4.54/5.0 |
| Benedicte | 1 | $16,743 | 27 | 4.89/5.0 |
| Clémence | 1 | $15,465 | 32 | 4.94/5.0 |
| Bob | 1 | $14,281 | 35 | 4.71/5.0 |
| Nathalie | 1 | $13,847 | 18 | 5.00/5.0 |
| Jean-Michel | 1 | $13,555 | 51 | 4.71/5.0 |
| Andriy | 1 | $13,333 | 21 | 4.71/5.0 |
| Josette | 1 | $12,700 | 28 | 4.89/5.0 |
Analyzing the strategies of top hosts, such as their property selection, pricing, and guest communication, can offer valuable lessons for optimizing your own Airbnb operations in Nantua.
Dive Deeper: Advanced Nantua STR Market Data (2025)
Ready to unlock more insights? AirROI provides access to advanced metrics and comprehensive Airbnb data for Nantua. Explore detailed analytics beyond this report to refine your investment strategy, optimize pricing, and maximize your vacation rental profits.
Explore Advanced MetricsNantua Short-Term Rental Market Composition (2025): Property & Room Types
Room Type Distribution
Property Type Distribution
Market Composition Insights for Nantua
- The Nantua Airbnb market composition is heavily skewed towards Entire Home/Apt listings, which make up 96.6% of the 29 active rentals. This indicates strong guest preference for privacy and space.
- Looking at the property type distribution in Nantua, Apartment/Condo properties are the most common (89.7%), reflecting the local real estate landscape.
Nantua Airbnb Room Capacity Analysis (2025): Bedroom Distribution
Distribution of Listings by Number of Bedrooms
Room Capacity Insights for Nantua
- The dominant room capacity in Nantua is 1 bedroom listings, making up 41.4% of the market. This suggests a strong demand for properties suitable for couples or solo travelers.
- Together, 1 bedroom and 2 bedrooms properties represent 65.5% of the active Airbnb listings in Nantua, indicating a high concentration in these sizes.
- Listings with 3+ bedrooms (3.4%) represent a smaller niche, potentially indicating an underserved market for larger group accommodations in Nantua.
Nantua Vacation Rental Guest Capacity Trends (2025)
Distribution of Listings by Guest Capacity
Guest Capacity Insights for Nantua
- The most common guest capacity trend in Nantua vacation rentals is listings accommodating 2 guests (44.8%). This suggests the primary traveler segment is likely couples or solo travelers.
- Properties designed for 2 guests and 4 guests dominate the Nantua STR market, accounting for 79.3% of listings.
- A significant 44.8% of listings cater specifically to 1-2 guests, highlighting strong demand from couples and solo travelers in Nantua.
- On average, properties in Nantua are equipped to host 3.2 guests.
Nantua Airbnb Booking Patterns (2025): Available vs. Booked Days
Available Days Distribution
Booked Days Distribution
Booking Pattern Insights for Nantua
- The most common availability pattern in Nantua falls within the 91-180 days range, representing 41.4% of listings. This suggests many properties have significant open periods on their calendars.
- Approximately 58.6% of listings show high availability (181+ days open annually), indicating potential for increased bookings or specific owner usage patterns.
- For booked days, the 181-270 days range is most frequent in Nantua (44.8%), reflecting common guest stay durations or potential owner blocking patterns.
- A notable 44.8% of properties secure long booking periods (181+ days booked per year), highlighting successful long-term rental strategies or significant owner usage.
Nantua Airbnb Minimum Stay Requirements Analysis
Distribution of Listings by Minimum Night Requirement
1 Night
9 listings
33.3% of total
2 Nights
7 listings
25.9% of total
3 Nights
2 listings
7.4% of total
4-6 Nights
6 listings
22.2% of total
7-29 Nights
2 listings
7.4% of total
30+ Nights
1 listings
3.7% of total
Key Insights
- The most prevalent minimum stay requirement in Nantua is 1 Night, adopted by 33.3% of listings. This highlights the market's preference for shorter, flexible bookings.
Recommendations
- Align with the market by considering a 1 Night minimum stay, as 33.3% of Nantua hosts use this setting.
- Adjust minimum nights based on seasonality – potentially shorter during low season and longer during peak demand periods in Nantua.
Nantua Airbnb Cancellation Policy Trends Analysis (2025)
Flexible
8 listings
30.8% of total
Moderate
7 listings
26.9% of total
Firm
3 listings
11.5% of total
Strict
8 listings
30.8% of total
Cancellation Policy Insights for Nantua
- The prevailing Airbnb cancellation policy trend in Nantua is Flexible, used by 30.8% of listings.
- There's a relatively balanced mix between guest-friendly (57.7%) and stricter (42.3%) policies, offering choices for different guest needs.
Recommendations for Hosts
- Consider adopting a Flexible policy to align with the 30.8% market standard in Nantua.
- With 30.8% using Strict terms, this is a viable option in Nantua, particularly for high-value properties or during peak demand periods.
- Regularly review your cancellation policy against competitors and market demand shifts in Nantua.
Nantua STR Booking Lead Time Analysis (2025)
Average Booking Lead Time by Month
Booking Lead Time Insights for Nantua
- The overall average booking lead time for vacation rentals in Nantua is 28 days.
- Guests book furthest in advance for stays during July (average 62 days), likely coinciding with peak travel demand or local events.
- The shortest booking windows occur for stays in October (average 14 days), indicating more last-minute travel plans during this time.
- Seasonally, Summer (51 days avg.) sees the longest lead times, while Fall (22 days avg.) has the shortest, reflecting typical travel planning cycles.
Recommendations for Hosts
- Use the overall average lead time (28 days) as a baseline for your pricing and availability strategy in Nantua.
- For July stays, consider implementing length-of-stay discounts or slightly higher rates for bookings made less than 62 days out to capitalize on advance planning.
- During October, focus on last-minute booking availability and promotions, as guests book with very short notice (14 days avg.).
- Target marketing efforts for the Summer season well in advance (at least 51 days) to capture early planners.
- Monitor your own booking lead times against these Nantua averages to identify opportunities for dynamic pricing adjustments.
Popular & Essential Airbnb Amenities in Nantua (2025)
Amenity Prevalence
Amenity Insights for Nantua
- Essential amenities in Nantua that guests expect include: Dishes and silverware, Heating, TV, Kitchen, Coffee maker. Lacking these (any) could significantly impact bookings.
- Popular amenities like Refrigerator, Smoke alarm, Bed linens are common but not universal. Offering these can provide a competitive edge.
Recommendations for Hosts
- Ensure your listing includes all essential amenities for Nantua: Dishes and silverware, Heating, TV, Kitchen, Coffee maker.
- Prioritize adding missing essentials: Kitchen, Coffee maker.
- Consider adding popular differentiators like Refrigerator or Smoke alarm to increase appeal.
- Highlight unique or less common amenities you offer (e.g., hot tub, dedicated workspace, EV charger) in your listing description and photos.
- Regularly check competitor amenities in Nantua to stay competitive.
Nantua Airbnb Guest Demographics & Profile Analysis (2025)
Guest Profile Summary for Nantua
- The typical guest profile for Airbnb in Nantua consists of primarily domestic travelers (82%), often arriving from nearby Lyon, typically belonging to the Post-2000s (Gen Z/Alpha) group (50%), primarily speaking French or English.
- Domestic travelers account for 82.4% of guests.
- Key international markets include France (82.4%) and Germany (2.3%).
- Top languages spoken are French (43%) followed by English (33.8%).
- A significant demographic segment is the Post-2000s (Gen Z/Alpha) group, representing 50% of guests.
Recommendations for Hosts
- Target domestic marketing efforts towards travelers from Lyon and Paris.
- Tailor amenities and listing descriptions to appeal to the dominant Post-2000s (Gen Z/Alpha) demographic (e.g., highlight fast WiFi, smart home features, local guides).
- Highlight unique local experiences or amenities relevant to the primary guest profile.
- Consider seasonal promotions aligned with peak travel times for key origin markets.
Nearby Short-Term Rental Market Comparison
How does the Nantua Airbnb market stack up against its neighbors? Compare key performance metrics like average monthly revenue, ADR, and occupancy rates in surrounding areas to understand the broader regional STR landscape.
| Market | Active Properties | Monthly Revenue | Daily Rate | Avg. Occupancy |
|---|---|---|---|---|
| La Rivière-Enverse | 17 | $5,972 | $624.02 | 41% |
| Les Clefs | 30 | $5,741 | $323.11 | 44% |
| Épinac | 14 | $5,147 | $333.01 | 37% |
| Manigod | 194 | $4,127 | $427.80 | 40% |
| Saint-Germain-au-Mont-d'Or | 10 | $3,928 | $316.02 | 40% |
| Puligny-Montrachet | 11 | $3,908 | $398.00 | 44% |
| Dommartin | 11 | $3,905 | $327.00 | 36% |
| Saint-Nicolas-la-Chapelle | 27 | $3,381 | $375.70 | 43% |
| Juliénas | 11 | $3,378 | $292.32 | 46% |
| Corgoloin | 10 | $3,314 | $296.49 | 44% |