Montricher-Albanne Airbnb Market Analysis 2025: Short Term Rental Data & Vacation Rental Statistics in Auvergne-Rhône-Alpes, France
Is Airbnb profitable in Montricher-Albanne in 2025? Explore comprehensive Airbnb analytics for Montricher-Albanne, Auvergne-Rhône-Alpes, France to uncover income potential. This 2025 STR market report for Montricher-Albanne, based on AirROI data from April 2024 to March 2025, reveals key trends in the niche market of 17 active listings.
Whether you're considering an Airbnb investment in Montricher-Albanne, optimizing your existing vacation rental, or exploring rental arbitrage opportunities, understanding the Montricher-Albanne Airbnb data is crucial. Leveraging the low regulation environment is key to maximizing your short term rental income potential. Let's dive into the specifics.
Key Montricher-Albanne Airbnb Performance Metrics Overview
Monthly Airbnb Revenue Variations & Income Potential in Montricher-Albanne (2025)
Understanding the monthly revenue variations for Airbnb listings in Montricher-Albanne is key to maximizing your short term rental income potential. Seasonality significantly impacts earnings. Our analysis, based on data from the past 12 months, shows that the peak revenue month for STRs in Montricher-Albanne is typically February, while October often presents the lowest earnings, highlighting opportunities for strategic pricing adjustments during shoulder and low seasons. Explore the typical Airbnb income in Montricher-Albanne across different performance tiers:
- Best-in-class properties (Top 10%) achieve $3,148+ monthly, often utilizing dynamic pricing and superior guest experiences.
- Strong performing properties (Top 25%) earn $2,118 or more, indicating effective management and desirable locations/amenities.
- Typical properties (Median) generate around $1,292 per month, representing the average market performance.
- Entry-level properties (Bottom 25%) see earnings around $803, often with potential for optimization.
Average Monthly Airbnb Earnings Trend in Montricher-Albanne
Montricher-Albanne Airbnb Occupancy Rate Trends (2025)
Maximize your bookings by understanding the Montricher-Albanne STR occupancy trends. Seasonal demand shifts significantly influence how often properties are booked. Typically, Februarysees the highest demand (peak season occupancy), while April experiences the lowest (low season). Effective strategies, like adjusting minimum stays or offering promotions, can boost occupancy during slower periods. Here's how different property tiers perform in Montricher-Albanne:
- Best-in-class properties (Top 10%) achieve 69%+ occupancy, indicating high desirability and potentially optimized availability.
- Strong performing properties (Top 25%) maintain 57% or higher occupancy, suggesting good market fit and guest satisfaction.
- Typical properties (Median) have an occupancy rate around 38%.
- Entry-level properties (Bottom 25%) average 24% occupancy, potentially facing higher vacancy.
Average Monthly Occupancy Rate Trend in Montricher-Albanne
Average Daily Rate (ADR) Airbnb Trends in Montricher-Albanne (2025)
Effective short term rental pricing strategy in Montricher-Albanne involves understanding monthly ADR fluctuations. The Average Daily Rate (ADR) for Airbnb in Montricher-Albanne typically peaks in February and dips lowest during November. Leveraging Airbnb dynamic pricing tools or strategies based on this seasonality can significantly boost revenue. Here's a look at the typical nightly rates achieved:
- Best-in-class properties (Top 10%) command rates of $222+ per night, often due to premium features or locations.
- Strong performing properties (Top 25%) achieve nightly rates of $152 or more.
- Typical properties (Median) charge around $104 per night.
- Entry-level properties (Bottom 25%) earn around $77 per night.
Average Daily Rate (ADR) Trend by Month in Montricher-Albanne
Get Live Montricher-Albanne Market Intelligence 👇

Explore Real-time Analytics
Airbnb Seasonality Analysis & Trends in Montricher-Albanne (2025)
Peak Season (February, January, December)
- Revenue averages $3,168 per month
- Occupancy rates average 57.9%
- Daily rates average $190
Shoulder Season
- Revenue averages $1,429 per month
- Occupancy maintains around 40.1%
- Daily rates hold near $124
Low Season (April, October, November)
- Revenue drops to average $857 per month
- Occupancy decreases to average 28.7%
- Daily rates adjust to average $113
Seasonality Insights for Montricher-Albanne
- The Airbnb seasonality in Montricher-Albanne shows highly seasonal trends requiring careful strategy. While the sections above show seasonal averages, it's also insightful to look at the extremes:
- During the high season, the absolute peak month showcases Montricher-Albanne's highest earning potential, with monthly revenues capable of climbing to $4,239, occupancy reaching a high of 74.2%, and ADRs peaking at $198.
- Conversely, the slowest single month of the year, typically falling within the low season, marks the market's lowest point. In this month, revenue might dip to $812, occupancy could drop to 27.6%, and ADRs may adjust down to $109.
- Understanding both the seasonal averages and these monthly peaks and troughs in revenue, occupancy, and ADR is crucial for maximizing your Airbnb profit potential in Montricher-Albanne.
Seasonal Strategies for Maximizing Profit
- Peak Season: Maximize revenue through premium pricing and potentially longer minimum stays. Ensure high availability.
- Low Season: Offer competitive pricing, special promotions (e.g., extended stay discounts), and flexible cancellation policies. Target off-season travelers like remote workers or budget-conscious guests.
- Shoulder Seasons: Implement dynamic pricing that balances peak and low rates. Target weekend travelers or specific events. Offer slightly more flexible terms than peak season.
- Regularly analyze your own performance against these Montricher-Albanne seasonality benchmarks and adjust your pricing and availability strategy accordingly.
Best Areas for Airbnb Investment in Montricher-Albanne (2025)
Exploring the top neighborhoods for short-term rentals in Montricher-Albanne? This section highlights key areas, outlining why they are attractive for hosts and guests, along with notable local attractions. Consider these locations based on your target guest profile and investment strategy.
| Neighborhood / Area | Why Host Here? (Target Guests & Appeal) | Key Attractions & Landmarks |
|---|---|---|
| La Toussuire | A popular ski resort offering direct access to the Les Sybelles ski domain. Ideal for winter sports enthusiasts and summer hikers alike, with plenty of family-friendly activities. | Ski slopes at Les Sybelles, Mountain hiking trails, Mountain biking, Local shops and restaurants, Annual ski festival |
| Saint-Jean-de-Maurienne | A charming Alpine town with rich history and access to various outdoor activities year-round, attracting visitors interested in culture and nature. | Saint-Jean-de-Maurienne Cathedral, Parc de l'Isère, Cycling routes, Proximity to the Alps, Local festivals |
| Valmeinier | An emerging ski destination with appealing prices and beautiful scenery, known for its family-friendly environment and variety of slopes. | Skiing and snowboarding, Summer hiking, Lakes and nature walks, Family programming, Scenic viewpoints |
| Albane | A lesser-known gem with a quiet environment, ideal for retreat seekers and those wanting to escape the crowds, perfect for nature lovers. | Tranquil natural landscapes, Hiking trails, Local cuisine, Cultural sites, Access to larger ski resorts |
| Orelle | A small resort with direct access to the 3 Vallées ski area, known for its stunning views and a more relaxed atmosphere away from larger tourist hotspots. | Access to Val Thorens, Beautiful mountain scenery, Skiing and snowboarding, Local gastronomy, Hiking opportunities |
| Valloire | A scenic mountain village combining authenticity and access to great skiing, perfect for families and adventurers seeking both relaxation and activity. | Valloire ski area, Cultural heritage sites, Local artisanal shops, Mountain biking, Festivals and events |
| Saint-Michel-de-Maurienne | A historic town with beautiful architecture, offering a blend of cultural and outdoor experiences, appealing to history and adventure enthusiasts. | Old town charm, Cycling routes, Proximity to ski resorts, Local markets, Cultural events |
| Montvernier | A picturesque village set in the mountains, ideal for peaceful retreats, it attracts those looking to unwind in nature with a backdrop of stunning scenery. | Scenic hiking routes, Quietude and nature, Local wines and cuisine, Breathtaking views, Cycling destinations |
Understanding Airbnb License Requirements & STR Laws in Montricher-Albanne (2025)
While Montricher-Albanne, Auvergne-Rhône-Alpes, France currently shows low STR regulations, specific Airbnb license requirements might still exist or change. Always verify the latest short term rental regulations and Airbnb license requirements directly with local government authorities for Montricher-Albanne to ensure full compliance before hosting.
(Source: AirROI data, 2025, finding no licensed listings among those analyzed)
Top Performing Airbnb Properties in Montricher-Albanne (2025)
Benchmark your potential! Explore examples of top-performing Airbnb properties in Montricher-Albannebased on Trailing Twelve Month (TTM) revenue. Analyze their characteristics, revenue, occupancy rate, and ADR to understand what drives success in this market.
Apartment 8 people Albanne
Entire Place • 3 bedrooms
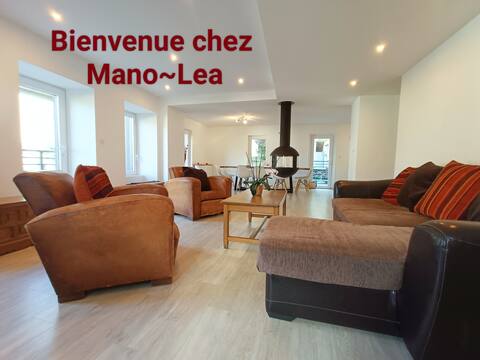
Mano~Léa #ski#bike#hiking#lake
Entire Place • 5 bedrooms
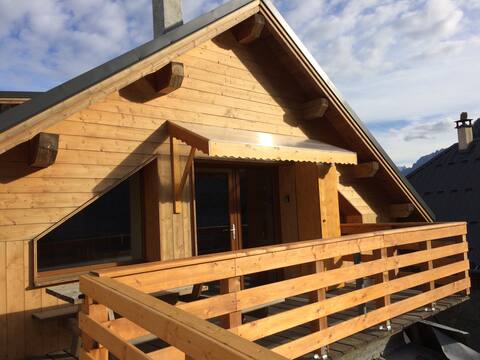
Small chalet
Entire Place • 2 bedrooms
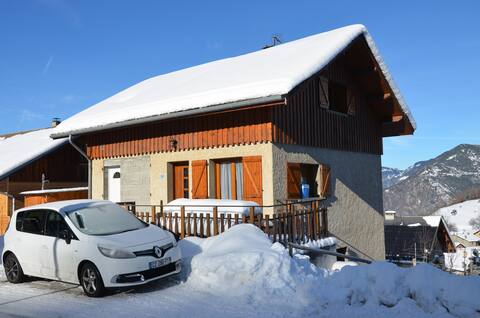
Chalet with 4 free parking spots
Entire Place • 4 bedrooms
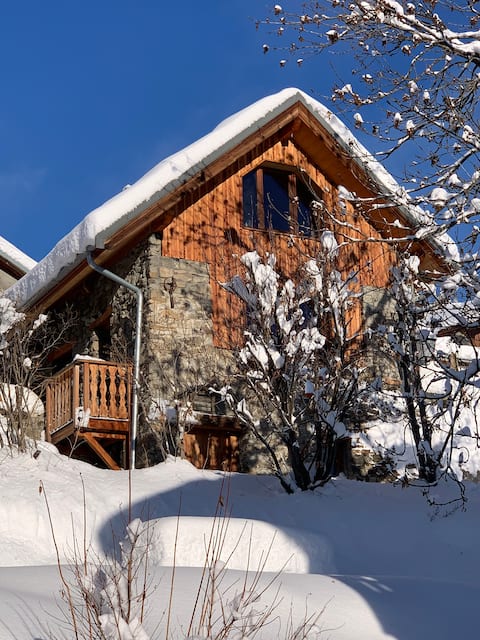
Chalet cœur de village Albanne-Les Karellis
Entire Place • 2 bedrooms
Chalet à Albanne/ Les Karellis
Entire Place • 3 bedrooms
Note: Performance varies based on location, size, amenities, seasonality, and management quality. Data reflects the past 12 months.
Top Performing Airbnb Hosts in Montricher-Albanne (2025)
Learn from the best! This table showcases top-performing Airbnb hosts in Montricher-Albanne based on the number of properties managed and estimated total revenue over the past year. Analyze their scale and performance metrics.
| Host Name | Properties | Grossing Revenue | Stay Reviews | Avg Rating |
|---|---|---|---|---|
| Eric | 1 | $32,018 | 82 | 4.94/5.0 |
| Mano~Léa | 1 | $23,151 | 68 | 4.90/5.0 |
| Franck | 2 | $20,476 | 41 | 4.88/5.0 |
| Bruno | 1 | $20,074 | 3 | 5.00/5.0 |
| Bernard | 1 | $19,982 | 6 | 4.17/5.0 |
| Nadine | 1 | $19,367 | 3 | 5.00/5.0 |
| Host #170511277 | 1 | $16,743 | 0 | 0.00/5.0 |
| Jacques | 1 | $15,861 | 52 | 4.81/5.0 |
| Fabien | 1 | $15,624 | 17 | 4.94/5.0 |
| Claire Et Christophe | 1 | $12,412 | 13 | 5.00/5.0 |
Analyzing the strategies of top hosts, such as their property selection, pricing, and guest communication, can offer valuable lessons for optimizing your own Airbnb operations in Montricher-Albanne.
Dive Deeper: Advanced Montricher-Albanne STR Market Data (2025)
Ready to unlock more insights? AirROI provides access to advanced metrics and comprehensive Airbnb data for Montricher-Albanne. Explore detailed analytics beyond this report to refine your investment strategy, optimize pricing, and maximize your vacation rental profits.
Explore Advanced MetricsMontricher-Albanne Short-Term Rental Market Composition (2025): Property & Room Types
Room Type Distribution
Property Type Distribution
Market Composition Insights for Montricher-Albanne
- The Montricher-Albanne Airbnb market composition is heavily skewed towards Entire Home/Apt listings, which make up 94.1% of the 17 active rentals. This indicates strong guest preference for privacy and space.
- Looking at the property type distribution in Montricher-Albanne, House properties are the most common (52.9%), reflecting the local real estate landscape.
- Houses represent a significant 52.9% portion, catering likely to families or larger groups.
Montricher-Albanne Airbnb Room Capacity Analysis (2025): Bedroom Distribution
Distribution of Listings by Number of Bedrooms
Room Capacity Insights for Montricher-Albanne
- The dominant room capacity in Montricher-Albanne is 2 bedrooms listings, making up 29.4% of the market. This suggests a strong demand for properties suitable for couples or solo travelers.
- Together, 2 bedrooms and 1 bedroom properties represent 52.9% of the active Airbnb listings in Montricher-Albanne, indicating a high concentration in these sizes.
- A significant 35.4% of listings offer 3+ bedrooms, catering to larger groups and families seeking more space in Montricher-Albanne.
Montricher-Albanne Vacation Rental Guest Capacity Trends (2025)
Distribution of Listings by Guest Capacity
Guest Capacity Insights for Montricher-Albanne
- The most common guest capacity trend in Montricher-Albanne vacation rentals is listings accommodating 8+ guests (35.3%). This suggests the primary traveler segment is likely larger groups.
- Properties designed for 8+ guests and 5 guests dominate the Montricher-Albanne STR market, accounting for 52.9% of listings.
- 47.1% of properties accommodate 6+ guests, serving the market segment for larger families or group travel in Montricher-Albanne.
- On average, properties in Montricher-Albanne are equipped to host 5.5 guests.
Montricher-Albanne Airbnb Booking Patterns (2025): Available vs. Booked Days
Available Days Distribution
Booked Days Distribution
Booking Pattern Insights for Montricher-Albanne
- The most common availability pattern in Montricher-Albanne falls within the 181-270 days range, representing 47.1% of listings. This suggests many properties have significant open periods on their calendars.
- Approximately 70.6% of listings show high availability (181+ days open annually), indicating potential for increased bookings or specific owner usage patterns.
- For booked days, the 91-180 days range is most frequent in Montricher-Albanne (47.1%), reflecting common guest stay durations or potential owner blocking patterns.
- A notable 29.4% of properties secure long booking periods (181+ days booked per year), highlighting successful long-term rental strategies or significant owner usage.
Montricher-Albanne Airbnb Minimum Stay Requirements Analysis
Distribution of Listings by Minimum Night Requirement
2 Nights
2 listings
12.5% of total
3 Nights
3 listings
18.8% of total
4-6 Nights
3 listings
18.8% of total
7-29 Nights
6 listings
37.5% of total
30+ Nights
2 listings
12.5% of total
Key Insights
- The most prevalent minimum stay requirement in Montricher-Albanne is 7-29 Nights, adopted by 37.5% of listings. This highlights the market's preference for shorter, flexible bookings.
- Very short stays (1-2 nights) are less common (12.5%), suggesting hosts prefer slightly longer bookings to optimize turnover.
- A significant segment (12.5%) caters to monthly stays (30+ nights) in Montricher-Albanne, pointing to opportunities in the extended-stay market.
Recommendations
- Align with the market by considering a 7-29 Nights minimum stay, as 37.5% of Montricher-Albanne hosts use this setting.
- Explore offering discounts for stays of 30+ nights to attract the 12.5% of the market seeking extended stays.
- Adjust minimum nights based on seasonality – potentially shorter during low season and longer during peak demand periods in Montricher-Albanne.
Montricher-Albanne Airbnb Cancellation Policy Trends Analysis (2025)
Flexible
3 listings
18.8% of total
Moderate
5 listings
31.3% of total
Firm
6 listings
37.5% of total
Strict
2 listings
12.5% of total
Cancellation Policy Insights for Montricher-Albanne
- The prevailing Airbnb cancellation policy trend in Montricher-Albanne is Firm, used by 37.5% of listings.
- There's a relatively balanced mix between guest-friendly (50.1%) and stricter (50.0%) policies, offering choices for different guest needs.
Recommendations for Hosts
- Consider adopting a Firm policy to align with the 37.5% market standard in Montricher-Albanne.
- Using a Strict policy might deter some guests, as only 12.5% of listings use it. Evaluate if potential revenue protection outweighs possible lower booking rates.
- Regularly review your cancellation policy against competitors and market demand shifts in Montricher-Albanne.
Montricher-Albanne STR Booking Lead Time Analysis (2025)
Average Booking Lead Time by Month
Booking Lead Time Insights for Montricher-Albanne
- The overall average booking lead time for vacation rentals in Montricher-Albanne is 84 days.
- Guests book furthest in advance for stays during February (average 140 days), likely coinciding with peak travel demand or local events.
- The shortest booking windows occur for stays in October (average 11 days), indicating more last-minute travel plans during this time.
- Seasonally, Summer (100 days avg.) sees the longest lead times, while Fall (35 days avg.) has the shortest, reflecting typical travel planning cycles.
Recommendations for Hosts
- Use the overall average lead time (84 days) as a baseline for your pricing and availability strategy in Montricher-Albanne.
- For February stays, consider implementing length-of-stay discounts or slightly higher rates for bookings made less than 140 days out to capitalize on advance planning.
- During October, focus on last-minute booking availability and promotions, as guests book with very short notice (11 days avg.).
- Target marketing efforts for the Summer season well in advance (at least 100 days) to capture early planners.
- Monitor your own booking lead times against these Montricher-Albanne averages to identify opportunities for dynamic pricing adjustments.
Popular & Essential Airbnb Amenities in Montricher-Albanne (2025)
Amenity Prevalence
Amenity Insights for Montricher-Albanne
- Essential amenities in Montricher-Albanne that guests expect include: Dishes and silverware, Smoke alarm, Heating, Kitchen, Coffee maker. Lacking these (any) could significantly impact bookings.
- Popular amenities like Hot water, Free parking on premises, Cooking basics are common but not universal. Offering these can provide a competitive edge.
Recommendations for Hosts
- Ensure your listing includes all essential amenities for Montricher-Albanne: Dishes and silverware, Smoke alarm, Heating, Kitchen, Coffee maker.
- Consider adding popular differentiators like Hot water or Free parking on premises to increase appeal.
- Highlight unique or less common amenities you offer (e.g., hot tub, dedicated workspace, EV charger) in your listing description and photos.
- Regularly check competitor amenities in Montricher-Albanne to stay competitive.
Montricher-Albanne Airbnb Guest Demographics & Profile Analysis (2025)
Guest Profile Summary for Montricher-Albanne
- The typical guest profile for Airbnb in Montricher-Albanne consists of primarily domestic travelers (71%), often arriving from nearby Lyon, typically belonging to the Post-2000s (Gen Z/Alpha) group (50%), primarily speaking French or English.
- Domestic travelers account for 70.9% of guests.
- Key international markets include France (70.9%) and Belgium (11.6%).
- Top languages spoken are French (41.1%) followed by English (32.9%).
- A significant demographic segment is the Post-2000s (Gen Z/Alpha) group, representing 50% of guests.
Recommendations for Hosts
- Target domestic marketing efforts towards travelers from Lyon and Grenoble.
- Tailor amenities and listing descriptions to appeal to the dominant Post-2000s (Gen Z/Alpha) demographic (e.g., highlight fast WiFi, smart home features, local guides).
- Highlight unique local experiences or amenities relevant to the primary guest profile.
- Consider seasonal promotions aligned with peak travel times for key origin markets.
Nearby Short-Term Rental Market Comparison
How does the Montricher-Albanne Airbnb market stack up against its neighbors? Compare key performance metrics like average monthly revenue, ADR, and occupancy rates in surrounding areas to understand the broader regional STR landscape.
| Market | Active Properties | Monthly Revenue | Daily Rate | Avg. Occupancy |
|---|---|---|---|---|
| Lauterbrunnen | 525 | $7,079 | $546.45 | 54% |
| La Rivière-Enverse | 17 | $5,972 | $624.02 | 41% |
| Les Clefs | 30 | $5,741 | $323.11 | 44% |
| Matten bei Interlaken | 52 | $5,674 | $316.63 | 63% |
| Iseltwald | 14 | $5,491 | $331.95 | 58% |
| Habkern | 13 | $5,382 | $344.74 | 50% |
| Interlaken | 288 | $4,987 | $310.52 | 56% |
| Zermatt | 734 | $4,604 | $463.00 | 46% |
| Oberhofen am Thunersee | 24 | $4,572 | $265.94 | 55% |
| Monteu Roero | 16 | $4,432 | $540.14 | 36% |