Montbrison Airbnb Market Analysis 2025: Short Term Rental Data & Vacation Rental Statistics in Auvergne-Rhône-Alpes, France
Is Airbnb profitable in Montbrison in 2025? Explore comprehensive Airbnb analytics for Montbrison, Auvergne-Rhône-Alpes, France to uncover income potential. This 2025 STR market report for Montbrison, based on AirROI data from April 2024 to March 2025, reveals key trends in the niche market of 52 active listings.
Whether you're considering an Airbnb investment in Montbrison, optimizing your existing vacation rental, or exploring rental arbitrage opportunities, understanding the Montbrison Airbnb data is crucial. Leveraging the low regulation environment is key to maximizing your short term rental income potential. Let's dive into the specifics.
Key Montbrison Airbnb Performance Metrics Overview
Monthly Airbnb Revenue Variations & Income Potential in Montbrison (2025)
Understanding the monthly revenue variations for Airbnb listings in Montbrison is key to maximizing your short term rental income potential. Seasonality significantly impacts earnings. Our analysis, based on data from the past 12 months, shows that the peak revenue month for STRs in Montbrison is typically May, while February often presents the lowest earnings, highlighting opportunities for strategic pricing adjustments during shoulder and low seasons. Explore the typical Airbnb income in Montbrison across different performance tiers:
- Best-in-class properties (Top 10%) achieve $1,815+ monthly, often utilizing dynamic pricing and superior guest experiences.
- Strong performing properties (Top 25%) earn $1,319 or more, indicating effective management and desirable locations/amenities.
- Typical properties (Median) generate around $846 per month, representing the average market performance.
- Entry-level properties (Bottom 25%) see earnings around $522, often with potential for optimization.
Average Monthly Airbnb Earnings Trend in Montbrison
Montbrison Airbnb Occupancy Rate Trends (2025)
Maximize your bookings by understanding the Montbrison STR occupancy trends. Seasonal demand shifts significantly influence how often properties are booked. Typically, Augustsees the highest demand (peak season occupancy), while September experiences the lowest (low season). Effective strategies, like adjusting minimum stays or offering promotions, can boost occupancy during slower periods. Here's how different property tiers perform in Montbrison:
- Best-in-class properties (Top 10%) achieve 79%+ occupancy, indicating high desirability and potentially optimized availability.
- Strong performing properties (Top 25%) maintain 66% or higher occupancy, suggesting good market fit and guest satisfaction.
- Typical properties (Median) have an occupancy rate around 48%.
- Entry-level properties (Bottom 25%) average 25% occupancy, potentially facing higher vacancy.
Average Monthly Occupancy Rate Trend in Montbrison
Average Daily Rate (ADR) Airbnb Trends in Montbrison (2025)
Effective short term rental pricing strategy in Montbrison involves understanding monthly ADR fluctuations. The Average Daily Rate (ADR) for Airbnb in Montbrison typically peaks in December and dips lowest during October. Leveraging Airbnb dynamic pricing tools or strategies based on this seasonality can significantly boost revenue. Here's a look at the typical nightly rates achieved:
- Best-in-class properties (Top 10%) command rates of $104+ per night, often due to premium features or locations.
- Strong performing properties (Top 25%) achieve nightly rates of $65 or more.
- Typical properties (Median) charge around $50 per night.
- Entry-level properties (Bottom 25%) earn around $38 per night.
Average Daily Rate (ADR) Trend by Month in Montbrison
Get Live Montbrison Market Intelligence 👇

Explore Real-time Analytics
Airbnb Seasonality Analysis & Trends in Montbrison (2025)
Peak Season (May, June, December)
- Revenue averages $1,342 per month
- Occupancy rates average 46.3%
- Daily rates average $72
Shoulder Season
- Revenue averages $1,120 per month
- Occupancy maintains around 47.9%
- Daily rates hold near $71
Low Season (January, February, September)
- Revenue drops to average $934 per month
- Occupancy decreases to average 43.6%
- Daily rates adjust to average $74
Seasonality Insights for Montbrison
- The Airbnb seasonality in Montbrison shows moderate seasonality with distinct peak and low periods. While the sections above show seasonal averages, it's also insightful to look at the extremes:
- During the high season, the absolute peak month showcases Montbrison's highest earning potential, with monthly revenues capable of climbing to $1,355, occupancy reaching a high of 53.3%, and ADRs peaking at $79.
- Conversely, the slowest single month of the year, typically falling within the low season, marks the market's lowest point. In this month, revenue might dip to $904, occupancy could drop to 39.5%, and ADRs may adjust down to $65.
- Understanding both the seasonal averages and these monthly peaks and troughs in revenue, occupancy, and ADR is crucial for maximizing your Airbnb profit potential in Montbrison.
Seasonal Strategies for Maximizing Profit
- Peak Season: Maximize revenue through premium pricing and potentially longer minimum stays. Ensure high availability.
- Low Season: Offer competitive pricing, special promotions (e.g., extended stay discounts), and flexible cancellation policies. Target off-season travelers like remote workers or budget-conscious guests.
- Shoulder Seasons: Implement dynamic pricing that balances peak and low rates. Target weekend travelers or specific events. Offer slightly more flexible terms than peak season.
- Regularly analyze your own performance against these Montbrison seasonality benchmarks and adjust your pricing and availability strategy accordingly.
Best Areas for Airbnb Investment in Montbrison (2025)
Exploring the top neighborhoods for short-term rentals in Montbrison? This section highlights key areas, outlining why they are attractive for hosts and guests, along with notable local attractions. Consider these locations based on your target guest profile and investment strategy.
| Neighborhood / Area | Why Host Here? (Target Guests & Appeal) | Key Attractions & Landmarks |
|---|---|---|
| Centre-Ville | The heart of Montbrison, offering a mix of historical architecture and modern amenities. Its charm attracts tourists looking for culture and local experiences. | Montbrison Cathedral, Place du Château, Les Petits Puy, local markets, cafés and bistros |
| Parc des Expositions | This area is popular for events and exhibitions, drawing attendees from surrounding regions. Perfect for hosts catering to business travelers and event attendees. | Parc des Expositions Montbrison, exhibition events, local fairs, business centers |
| Monts du Forez | A natural haven offering outdoor activities like hiking and skiing. It's ideal for tourists seeking nature and adventure close to Montbrison. | Forez Mountains, hiking trails, ski resorts, local flora and fauna, scenic viewpoints |
| Lay-Saint-Christophe | A quiet suburb that offers a more laid-back experience. It's great for families and those seeking a peaceful retreat while being close to Montbrison's attractions. | local parks, community events, peaceful neighborhoods |
| Hôpital | This area is well-known for its healthcare facilities and attracts visitors seeking medical tourism, as well as those visiting family and friends. | local hospitals, healthcare facilities, wellness centers |
| Château de Montbrison | The historic castle site attracts visitors interested in history and architecture. A key tourist spot that boosts local economies. | Château de Montbrison, guided tours, historical exhibitions |
| Route de Saint-Étienne | A strategic transport route that connects Montbrison to nearby cities, making it a convenient stop for travelers and tourists. | shopping areas, transport hubs, gastronomic restaurants |
| Cité scolaire | An educational district attracting families and student visitors, ideal for short-term rentals catering to those visiting students or attending events. | local schools, student housing, community activities |
Understanding Airbnb License Requirements & STR Laws in Montbrison (2025)
While Montbrison, Auvergne-Rhône-Alpes, France currently shows low STR regulations, specific Airbnb license requirements might still exist or change. Always verify the latest short term rental regulations and Airbnb license requirements directly with local government authorities for Montbrison to ensure full compliance before hosting.
(Source: AirROI data, 2025, based on 8% licensed listings)
Top Performing Airbnb Properties in Montbrison (2025)
Benchmark your potential! Explore examples of top-performing Airbnb properties in Montbrisonbased on Trailing Twelve Month (TTM) revenue. Analyze their characteristics, revenue, occupancy rate, and ADR to understand what drives success in this market.
Peaceful 5 bedroom farmhouse 10 people
Entire Place • 5 bedrooms
Townhouse with a garden
Entire Place • 4 bedrooms

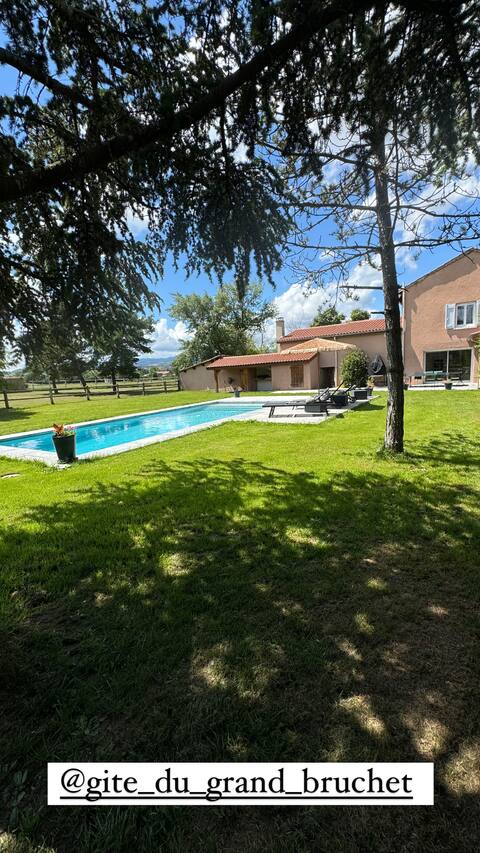
Contemporary villa with heated pool
Entire Place • 2 bedrooms

꧂ MAIS0N « Jungle House » 2-4 p / Montbrison ꧂
Entire Place • 2 bedrooms

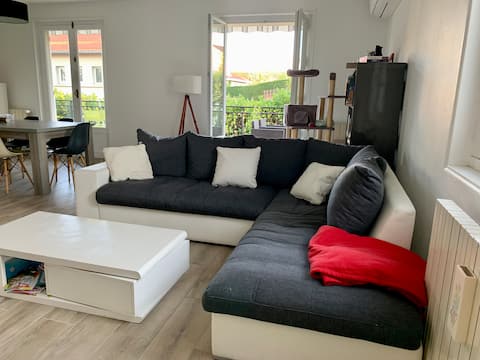
Single-family home downtown
Entire Place • 3 bedrooms
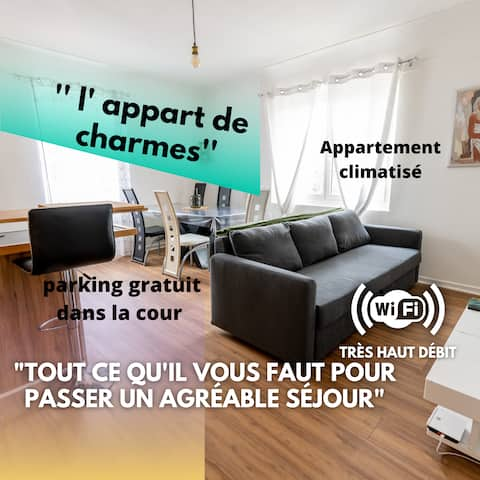
the charming apartment and its private parking
Entire Place • 1 bedroom
Note: Performance varies based on location, size, amenities, seasonality, and management quality. Data reflects the past 12 months.
Top Performing Airbnb Hosts in Montbrison (2025)
Learn from the best! This table showcases top-performing Airbnb hosts in Montbrison based on the number of properties managed and estimated total revenue over the past year. Analyze their scale and performance metrics.
| Host Name | Properties | Grossing Revenue | Stay Reviews | Avg Rating |
|---|---|---|---|---|
| Jessy | 1 | $61,203 | 5 | 5.00/5.0 |
| Denis | 3 | $38,805 | 115 | 4.76/5.0 |
| Emilie | 2 | $35,792 | 61 | 4.96/5.0 |
| Florian | 3 | $35,265 | 142 | 4.65/5.0 |
| Jeremy | 3 | $34,653 | 173 | 4.77/5.0 |
| Hélène | 1 | $33,750 | 21 | 4.90/5.0 |
| Mélissa | 1 | $26,181 | 5 | 5.00/5.0 |
| Cedric | 2 | $24,177 | 56 | 4.99/5.0 |
| Marie Claire | 1 | $23,916 | 36 | 5.00/5.0 |
| Host #377086036 | 3 | $17,958 | 321 | 4.59/5.0 |
Analyzing the strategies of top hosts, such as their property selection, pricing, and guest communication, can offer valuable lessons for optimizing your own Airbnb operations in Montbrison.
Dive Deeper: Advanced Montbrison STR Market Data (2025)
Ready to unlock more insights? AirROI provides access to advanced metrics and comprehensive Airbnb data for Montbrison. Explore detailed analytics beyond this report to refine your investment strategy, optimize pricing, and maximize your vacation rental profits.
Explore Advanced MetricsMontbrison Short-Term Rental Market Composition (2025): Property & Room Types
Room Type Distribution
Property Type Distribution
Market Composition Insights for Montbrison
- The Montbrison Airbnb market composition is heavily skewed towards Entire Home/Apt listings, which make up 86.5% of the 52 active rentals. This indicates strong guest preference for privacy and space.
- Looking at the property type distribution in Montbrison, Apartment/Condo properties are the most common (67.3%), reflecting the local real estate landscape.
- Houses represent a significant 26.9% portion, catering likely to families or larger groups.
- Smaller segments like hotel/boutique, outdoor/unique (combined 5.7%) offer potential for unique stay experiences.
Montbrison Airbnb Room Capacity Analysis (2025): Bedroom Distribution
Distribution of Listings by Number of Bedrooms
Room Capacity Insights for Montbrison
- The dominant room capacity in Montbrison is 1 bedroom listings, making up 46.2% of the market. This suggests a strong demand for properties suitable for couples or solo travelers.
- Together, 1 bedroom and 2 bedrooms properties represent 71.2% of the active Airbnb listings in Montbrison, indicating a high concentration in these sizes.
- Listings with 3+ bedrooms (9.5%) represent a smaller niche, potentially indicating an underserved market for larger group accommodations in Montbrison.
Montbrison Vacation Rental Guest Capacity Trends (2025)
Distribution of Listings by Guest Capacity
Guest Capacity Insights for Montbrison
- The most common guest capacity trend in Montbrison vacation rentals is listings accommodating 4 guests (38.5%). This suggests the primary traveler segment is likely small families or groups.
- Properties designed for 4 guests and 2 guests dominate the Montbrison STR market, accounting for 67.3% of listings.
- 13.4% of properties accommodate 6+ guests, serving the market segment for larger families or group travel in Montbrison.
- On average, properties in Montbrison are equipped to host 3.3 guests.
Montbrison Airbnb Booking Patterns (2025): Available vs. Booked Days
Available Days Distribution
Booked Days Distribution
Booking Pattern Insights for Montbrison
- The most common availability pattern in Montbrison falls within the 181-270 days range, representing 40.4% of listings. This suggests many properties have significant open periods on their calendars.
- Approximately 61.6% of listings show high availability (181+ days open annually), indicating potential for increased bookings or specific owner usage patterns.
- For booked days, the 91-180 days range is most frequent in Montbrison (40.4%), reflecting common guest stay durations or potential owner blocking patterns.
- A notable 38.5% of properties secure long booking periods (181+ days booked per year), highlighting successful long-term rental strategies or significant owner usage.
Montbrison Airbnb Minimum Stay Requirements Analysis
Distribution of Listings by Minimum Night Requirement
1 Night
24 listings
52.2% of total
2 Nights
13 listings
28.3% of total
3 Nights
5 listings
10.9% of total
4-6 Nights
2 listings
4.3% of total
7-29 Nights
1 listings
2.2% of total
30+ Nights
1 listings
2.2% of total
Key Insights
- The most prevalent minimum stay requirement in Montbrison is 1 Night, adopted by 52.2% of listings. This highlights the market's preference for shorter, flexible bookings.
- A strong majority (80.5%) of the Montbrison Airbnb data shows acceptance of very short stays (1-2 nights), indicating a dynamic, high-turnover market.
- Dedicated monthly rentals (30+ nights) represent a small niche (2.2%), possibly an untapped area for hosts.
Recommendations
- Align with the market by considering a 1 Night minimum stay, as 52.2% of Montbrison hosts use this setting.
- Adjust minimum nights based on seasonality – potentially shorter during low season and longer during peak demand periods in Montbrison.
Montbrison Airbnb Cancellation Policy Trends Analysis (2025)
Flexible
19 listings
42.2% of total
Moderate
18 listings
40% of total
Firm
3 listings
6.7% of total
Strict
5 listings
11.1% of total
Cancellation Policy Insights for Montbrison
- The prevailing Airbnb cancellation policy trend in Montbrison is Flexible, used by 42.2% of listings.
- The market strongly favors guest-friendly terms, with 82.2% of listings offering Flexible or Moderate policies. This suggests guests in Montbrison may expect booking flexibility.
Recommendations for Hosts
- Consider adopting a Flexible policy to align with the 42.2% market standard in Montbrison.
- Using a Strict policy might deter some guests, as only 11.1% of listings use it. Evaluate if potential revenue protection outweighs possible lower booking rates.
- Regularly review your cancellation policy against competitors and market demand shifts in Montbrison.
Montbrison STR Booking Lead Time Analysis (2025)
Average Booking Lead Time by Month
Booking Lead Time Insights for Montbrison
- The overall average booking lead time for vacation rentals in Montbrison is 27 days.
- Guests book furthest in advance for stays during May (average 63 days), likely coinciding with peak travel demand or local events.
- The shortest booking windows occur for stays in November (average 25 days), indicating more last-minute travel plans during this time.
- Seasonally, Spring (43 days avg.) sees the longest lead times, while Fall (27 days avg.) has the shortest, reflecting typical travel planning cycles.
Recommendations for Hosts
- Use the overall average lead time (27 days) as a baseline for your pricing and availability strategy in Montbrison.
- For May stays, consider implementing length-of-stay discounts or slightly higher rates for bookings made less than 63 days out to capitalize on advance planning.
- Target marketing efforts for the Spring season well in advance (at least 43 days) to capture early planners.
- Monitor your own booking lead times against these Montbrison averages to identify opportunities for dynamic pricing adjustments.
Popular & Essential Airbnb Amenities in Montbrison (2025)
Amenity Prevalence
Amenity Insights for Montbrison
- Essential amenities in Montbrison that guests expect include: Kitchen. Lacking these (this) could significantly impact bookings.
- Popular amenities like Heating, Dishes and silverware, Hot water are common but not universal. Offering these can provide a competitive edge.
- Warning: Wifi is not universally provided but is considered essential globally. Ensure reliable Wifi is offered.
Recommendations for Hosts
- Ensure your listing includes all essential amenities for Montbrison: Kitchen.
- Prioritize adding missing essentials: Kitchen.
- Consider adding popular differentiators like Heating or Dishes and silverware to increase appeal.
- Highlight unique or less common amenities you offer (e.g., hot tub, dedicated workspace, EV charger) in your listing description and photos.
- Regularly check competitor amenities in Montbrison to stay competitive.
Montbrison Airbnb Guest Demographics & Profile Analysis (2025)
Guest Profile Summary for Montbrison
- The typical guest profile for Airbnb in Montbrison consists of primarily domestic travelers (92%), often arriving from nearby Lyon, typically belonging to the Post-2000s (Gen Z/Alpha) group (50%), primarily speaking French or English.
- Domestic travelers account for 91.7% of guests.
- Key international markets include France (91.7%) and Germany (1.8%).
- Top languages spoken are French (48.5%) followed by English (29.6%).
- A significant demographic segment is the Post-2000s (Gen Z/Alpha) group, representing 50% of guests.
Recommendations for Hosts
- Target domestic marketing efforts towards travelers from Lyon and Paris.
- Tailor amenities and listing descriptions to appeal to the dominant Post-2000s (Gen Z/Alpha) demographic (e.g., highlight fast WiFi, smart home features, local guides).
- Highlight unique local experiences or amenities relevant to the primary guest profile.
- Consider seasonal promotions aligned with peak travel times for key origin markets.
Nearby Short-Term Rental Market Comparison
How does the Montbrison Airbnb market stack up against its neighbors? Compare key performance metrics like average monthly revenue, ADR, and occupancy rates in surrounding areas to understand the broader regional STR landscape.
| Market | Active Properties | Monthly Revenue | Daily Rate | Avg. Occupancy |
|---|---|---|---|---|
| Épinac | 14 | $5,147 | $333.01 | 37% |
| Divajeu | 19 | $3,941 | $410.65 | 42% |
| Saint-Germain-au-Mont-d'Or | 10 | $3,928 | $316.02 | 40% |
| Puligny-Montrachet | 11 | $3,908 | $398.00 | 44% |
| Dommartin | 11 | $3,905 | $327.00 | 36% |
| Juliénas | 11 | $3,378 | $292.32 | 46% |
| Courzieu | 11 | $3,267 | $287.83 | 52% |
| Vanosc | 13 | $3,072 | $224.52 | 44% |
| Chantepérier | 20 | $3,057 | $281.60 | 37% |
| Bligny-lès-Beaune | 24 | $2,930 | $233.89 | 44% |