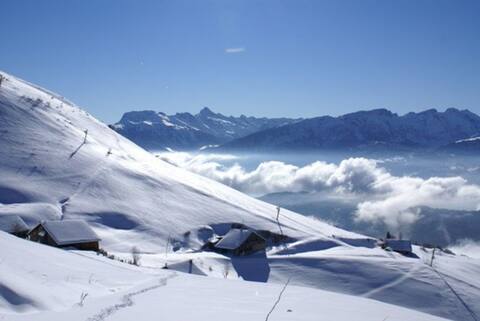
Mieussy Airbnb Market Analysis 2025: Short Term Rental Data & Vacation Rental Statistics in Auvergne-Rhône-Alpes, France
Is Airbnb profitable in Mieussy in 2025? Explore comprehensive Airbnb analytics for Mieussy, Auvergne-Rhône-Alpes, France to uncover income potential. This 2025 STR market report for Mieussy, based on AirROI data from April 2024 to March 2025, reveals key trends in the niche market of 64 active listings.
Whether you're considering an Airbnb investment in Mieussy, optimizing your existing vacation rental, or exploring rental arbitrage opportunities, understanding the Mieussy Airbnb data is crucial. Leveraging the low regulation environment is key to maximizing your short term rental income potential. Let's dive into the specifics.
Key Mieussy Airbnb Performance Metrics Overview
Monthly Airbnb Revenue Variations & Income Potential in Mieussy (2025)
Understanding the monthly revenue variations for Airbnb listings in Mieussy is key to maximizing your short term rental income potential. Seasonality significantly impacts earnings. Our analysis, based on data from the past 12 months, shows that the peak revenue month for STRs in Mieussy is typically February, while October often presents the lowest earnings, highlighting opportunities for strategic pricing adjustments during shoulder and low seasons. Explore the typical Airbnb income in Mieussy across different performance tiers:
- Best-in-class properties (Top 10%) achieve $4,200+ monthly, often utilizing dynamic pricing and superior guest experiences.
- Strong performing properties (Top 25%) earn $2,000 or more, indicating effective management and desirable locations/amenities.
- Typical properties (Median) generate around $1,094 per month, representing the average market performance.
- Entry-level properties (Bottom 25%) see earnings around $580, often with potential for optimization.
Average Monthly Airbnb Earnings Trend in Mieussy
Mieussy Airbnb Occupancy Rate Trends (2025)
Maximize your bookings by understanding the Mieussy STR occupancy trends. Seasonal demand shifts significantly influence how often properties are booked. Typically, Februarysees the highest demand (peak season occupancy), while October experiences the lowest (low season). Effective strategies, like adjusting minimum stays or offering promotions, can boost occupancy during slower periods. Here's how different property tiers perform in Mieussy:
- Best-in-class properties (Top 10%) achieve 77%+ occupancy, indicating high desirability and potentially optimized availability.
- Strong performing properties (Top 25%) maintain 60% or higher occupancy, suggesting good market fit and guest satisfaction.
- Typical properties (Median) have an occupancy rate around 36%.
- Entry-level properties (Bottom 25%) average 20% occupancy, potentially facing higher vacancy.
Average Monthly Occupancy Rate Trend in Mieussy
Average Daily Rate (ADR) Airbnb Trends in Mieussy (2025)
Effective short term rental pricing strategy in Mieussy involves understanding monthly ADR fluctuations. The Average Daily Rate (ADR) for Airbnb in Mieussy typically peaks in February and dips lowest during September. Leveraging Airbnb dynamic pricing tools or strategies based on this seasonality can significantly boost revenue. Here's a look at the typical nightly rates achieved:
- Best-in-class properties (Top 10%) command rates of $365+ per night, often due to premium features or locations.
- Strong performing properties (Top 25%) achieve nightly rates of $153 or more.
- Typical properties (Median) charge around $92 per night.
- Entry-level properties (Bottom 25%) earn around $66 per night.
Average Daily Rate (ADR) Trend by Month in Mieussy
Get Live Mieussy Market Intelligence 👇

Explore Real-time Analytics
Airbnb Seasonality Analysis & Trends in Mieussy (2025)
Peak Season (February, August, July)
- Revenue averages $2,840 per month
- Occupancy rates average 60.0%
- Daily rates average $179
Shoulder Season
- Revenue averages $1,867 per month
- Occupancy maintains around 35.3%
- Daily rates hold near $173
Low Season (September, October, November)
- Revenue drops to average $1,126 per month
- Occupancy decreases to average 31.2%
- Daily rates adjust to average $161
Seasonality Insights for Mieussy
- The Airbnb seasonality in Mieussy shows highly seasonal trends requiring careful strategy. While the sections above show seasonal averages, it's also insightful to look at the extremes:
- During the high season, the absolute peak month showcases Mieussy's highest earning potential, with monthly revenues capable of climbing to $3,430, occupancy reaching a high of 65.9%, and ADRs peaking at $211.
- Conversely, the slowest single month of the year, typically falling within the low season, marks the market's lowest point. In this month, revenue might dip to $1,006, occupancy could drop to 28.6%, and ADRs may adjust down to $154.
- Understanding both the seasonal averages and these monthly peaks and troughs in revenue, occupancy, and ADR is crucial for maximizing your Airbnb profit potential in Mieussy.
Seasonal Strategies for Maximizing Profit
- Peak Season: Maximize revenue through premium pricing and potentially longer minimum stays. Ensure high availability.
- Low Season: Offer competitive pricing, special promotions (e.g., extended stay discounts), and flexible cancellation policies. Target off-season travelers like remote workers or budget-conscious guests.
- Shoulder Seasons: Implement dynamic pricing that balances peak and low rates. Target weekend travelers or specific events. Offer slightly more flexible terms than peak season.
- Regularly analyze your own performance against these Mieussy seasonality benchmarks and adjust your pricing and availability strategy accordingly.
Best Areas for Airbnb Investment in Mieussy (2025)
Exploring the top neighborhoods for short-term rentals in Mieussy? This section highlights key areas, outlining why they are attractive for hosts and guests, along with notable local attractions. Consider these locations based on your target guest profile and investment strategy.
| Neighborhood / Area | Why Host Here? (Target Guests & Appeal) | Key Attractions & Landmarks |
|---|---|---|
| Mieussy Village | A charming mountain village that offers access to stunning natural landscapes. Perfect for tourists seeking tranquility and outdoor activities like hiking and skiing. | Ski Resorts, Hiking Trails, Scenic Views of Mont Blanc, Local Restaurants, Traditional Alpine Architecture |
| Les Gets | Popular ski resort town that attracts winter sports enthusiasts as well as summer vacationers. Ideal for Airbnb with year-round attractions. | Les Gets Ski Resort, Mountain Biking Trails, Village Center with Shops, Summer Music Festivals, Lake Lac des Ecoles |
| Chamonix-Mont-Blanc | Famous alpine resort town known for its skiing and Mont Blanc views. A hotspot for tourists year-round. | Mont Blanc, Aiguille du Midi, Chamonix Ski Area, Gorges du Verdon, Cham' Snow Park |
| Saint-Jean-de-Sixt | A picturesque village in the mountains with a serene atmosphere. Great for families and nature lovers. | La Clusaz Ski Area, Lake Annecy, Hiking Trails, Local Farmers' Markets, Cultural Sites |
| Thônes | Known for its rich culinary heritage, particularly cheese, and close proximity to outdoor activities. Appeals to foodies and nature lovers. | Thônes Market, Cheese Producers, Hiking in the Aravis Mountains, Historical Sites, Lake Annecy |
| Megève | An upscale ski resort known for its high-end charm and shopping. Attracts affluent tourists year-round. | Megève Ski Resort, Historic Village Center, Luxury Shopping, Fine Dining, Spa Resorts |
| Annecy | Often referred to as the 'Venice of the Alps', this beautiful city has canals and a stunning lake, drawing visitors for its picturesque views and activities. | Lake Annecy, Historic Old Town, Palais de l'Isle, Cycling Paths, Water Sports |
| Morillon | Charming village known for its family-friendly skiing and access to the Grand Massif ski area. Great for winter stays. | Grand Massif Ski Area, Nature Trails, Family Activities, Local Festivals, Gorge des Tines |
Understanding Airbnb License Requirements & STR Laws in Mieussy (2025)
While Mieussy, Auvergne-Rhône-Alpes, France currently shows low STR regulations, specific Airbnb license requirements might still exist or change. Always verify the latest short term rental regulations and Airbnb license requirements directly with local government authorities for Mieussy to ensure full compliance before hosting.
(Source: AirROI data, 2025, based on 9% licensed listings)
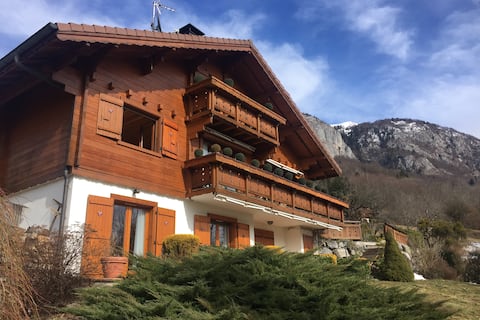
Top Performing Airbnb Properties in Mieussy (2025)
Benchmark your potential! Explore examples of top-performing Airbnb properties in Mieussybased on Trailing Twelve Month (TTM) revenue. Analyze their characteristics, revenue, occupancy rate, and ADR to understand what drives success in this market.

Alpine home 8p with superb views
Entire Place • 4 bedrooms
Chalet "Le Maclavierre" 15 people Magical view
Entire Place • 4 bedrooms
Chalet large terrace beautiful view ,Sauna
Entire Place • 5 bedrooms
Ski/summer chalet with pool and views. Sleeps 10.
Entire Place • 5 bedrooms
T6 la belle des praz
Entire Place • 4 bedrooms
Mountain house with SPA for 11 people
Entire Place • 4 bedrooms
Note: Performance varies based on location, size, amenities, seasonality, and management quality. Data reflects the past 12 months.
Top Performing Airbnb Hosts in Mieussy (2025)
Learn from the best! This table showcases top-performing Airbnb hosts in Mieussy based on the number of properties managed and estimated total revenue over the past year. Analyze their scale and performance metrics.
| Host Name | Properties | Grossing Revenue | Stay Reviews | Avg Rating |
|---|---|---|---|---|
| Host #88917874 | 1 | $141,879 | 0 | 0.00/5.0 |
| Marinelle | 1 | $94,539 | 6 | 5.00/5.0 |
| Jean-Baptiste | 2 | $57,065 | 34 | 4.88/5.0 |
| Axelle Et Jérôme | 1 | $54,957 | 29 | 4.90/5.0 |
| Katherine | 1 | $47,249 | 19 | 4.95/5.0 |
| Nicolas Et Mickaël | 1 | $34,686 | 7 | 4.86/5.0 |
| Antoine | 1 | $32,197 | 28 | 4.96/5.0 |
| Maxime | 1 | $29,554 | 45 | 4.93/5.0 |
| Thomas | 1 | $27,617 | 10 | 4.80/5.0 |
| Host #36286896 | 1 | $24,225 | 15 | 5.00/5.0 |
Analyzing the strategies of top hosts, such as their property selection, pricing, and guest communication, can offer valuable lessons for optimizing your own Airbnb operations in Mieussy.
Dive Deeper: Advanced Mieussy STR Market Data (2025)
Ready to unlock more insights? AirROI provides access to advanced metrics and comprehensive Airbnb data for Mieussy. Explore detailed analytics beyond this report to refine your investment strategy, optimize pricing, and maximize your vacation rental profits.
Explore Advanced MetricsMieussy Short-Term Rental Market Composition (2025): Property & Room Types
Room Type Distribution
Property Type Distribution
Market Composition Insights for Mieussy
- The Mieussy Airbnb market composition is heavily skewed towards Entire Home/Apt listings, which make up 90.6% of the 64 active rentals. This indicates strong guest preference for privacy and space.
- Looking at the property type distribution in Mieussy, Apartment/Condo properties are the most common (57.8%), reflecting the local real estate landscape.
- Houses represent a significant 40.6% portion, catering likely to families or larger groups.
- Smaller segments like outdoor/unique (combined 1.6%) offer potential for unique stay experiences.
Mieussy Airbnb Room Capacity Analysis (2025): Bedroom Distribution
Distribution of Listings by Number of Bedrooms
Room Capacity Insights for Mieussy
- The dominant room capacity in Mieussy is 2 bedrooms listings, making up 28.1% of the market. This suggests a strong demand for properties suitable for couples or solo travelers.
- Together, 2 bedrooms and 1 bedroom properties represent 53.1% of the active Airbnb listings in Mieussy, indicating a high concentration in these sizes.
- A significant 29.7% of listings offer 3+ bedrooms, catering to larger groups and families seeking more space in Mieussy.
Mieussy Vacation Rental Guest Capacity Trends (2025)
Distribution of Listings by Guest Capacity
Guest Capacity Insights for Mieussy
- The most common guest capacity trend in Mieussy vacation rentals is listings accommodating 4 guests (29.7%). This suggests the primary traveler segment is likely small families or groups.
- Properties designed for 4 guests and 8+ guests dominate the Mieussy STR market, accounting for 53.1% of listings.
- 40.6% of properties accommodate 6+ guests, serving the market segment for larger families or group travel in Mieussy.
- On average, properties in Mieussy are equipped to host 5.0 guests.
Mieussy Airbnb Booking Patterns (2025): Available vs. Booked Days
Available Days Distribution
Booked Days Distribution
Booking Pattern Insights for Mieussy
- The most common availability pattern in Mieussy falls within the 271-366 days range, representing 46.9% of listings. This suggests many properties have significant open periods on their calendars.
- Approximately 84.4% of listings show high availability (181+ days open annually), indicating potential for increased bookings or specific owner usage patterns.
- For booked days, the 91-180 days range is most frequent in Mieussy (35.9%), reflecting common guest stay durations or potential owner blocking patterns.
- A notable 17.2% of properties secure long booking periods (181+ days booked per year), highlighting successful long-term rental strategies or significant owner usage.
Mieussy Airbnb Minimum Stay Requirements Analysis
Distribution of Listings by Minimum Night Requirement
1 Night
6 listings
9.5% of total
2 Nights
16 listings
25.4% of total
3 Nights
11 listings
17.5% of total
4-6 Nights
11 listings
17.5% of total
7-29 Nights
7 listings
11.1% of total
30+ Nights
12 listings
19% of total
Key Insights
- The most prevalent minimum stay requirement in Mieussy is 2 Nights, adopted by 25.4% of listings. This highlights the market's preference for shorter, flexible bookings.
- A significant segment (19%) caters to monthly stays (30+ nights) in Mieussy, pointing to opportunities in the extended-stay market.
Recommendations
- Align with the market by considering a 2 Nights minimum stay, as 25.4% of Mieussy hosts use this setting.
- If feasible, allowing 1-night stays, especially midweek or during low season, could capture last-minute bookings, as only 9.5% currently do.
- Explore offering discounts for stays of 30+ nights to attract the 19% of the market seeking extended stays.
- Adjust minimum nights based on seasonality – potentially shorter during low season and longer during peak demand periods in Mieussy.
Mieussy Airbnb Cancellation Policy Trends Analysis (2025)
Flexible
7 listings
12.7% of total
Moderate
16 listings
29.1% of total
Firm
15 listings
27.3% of total
Strict
17 listings
30.9% of total
Cancellation Policy Insights for Mieussy
- The prevailing Airbnb cancellation policy trend in Mieussy is Strict, used by 30.9% of listings.
- A majority (58.2%) of hosts in Mieussy utilize Firm or Strict policies, indicating a market where hosts prioritize booking security.
Recommendations for Hosts
- Consider adopting a Strict policy to align with the 30.9% market standard in Mieussy.
- With 30.9% using Strict terms, this is a viable option in Mieussy, particularly for high-value properties or during peak demand periods.
- Regularly review your cancellation policy against competitors and market demand shifts in Mieussy.
Mieussy STR Booking Lead Time Analysis (2025)
Average Booking Lead Time by Month
Booking Lead Time Insights for Mieussy
- The overall average booking lead time for vacation rentals in Mieussy is 68 days.
- Guests book furthest in advance for stays during February (average 108 days), likely coinciding with peak travel demand or local events.
- The shortest booking windows occur for stays in October (average 28 days), indicating more last-minute travel plans during this time.
- Seasonally, Summer (90 days avg.) sees the longest lead times, while Fall (41 days avg.) has the shortest, reflecting typical travel planning cycles.
Recommendations for Hosts
- Use the overall average lead time (68 days) as a baseline for your pricing and availability strategy in Mieussy.
- For February stays, consider implementing length-of-stay discounts or slightly higher rates for bookings made less than 108 days out to capitalize on advance planning.
- Target marketing efforts for the Summer season well in advance (at least 90 days) to capture early planners.
- Monitor your own booking lead times against these Mieussy averages to identify opportunities for dynamic pricing adjustments.
Popular & Essential Airbnb Amenities in Mieussy (2025)
Amenity Prevalence
Amenity Insights for Mieussy
- Essential amenities in Mieussy that guests expect include: Free parking on premises, Kitchen, Heating. Lacking these (any) could significantly impact bookings.
- Popular amenities like TV, Coffee maker, Smoke alarm are common but not universal. Offering these can provide a competitive edge.
Recommendations for Hosts
- Ensure your listing includes all essential amenities for Mieussy: Free parking on premises, Kitchen, Heating.
- Prioritize adding missing essentials: Kitchen, Heating.
- Consider adding popular differentiators like TV or Coffee maker to increase appeal.
- Highlight unique or less common amenities you offer (e.g., hot tub, dedicated workspace, EV charger) in your listing description and photos.
- Regularly check competitor amenities in Mieussy to stay competitive.
Mieussy Airbnb Guest Demographics & Profile Analysis (2025)
Guest Profile Summary for Mieussy
- The typical guest profile for Airbnb in Mieussy consists of primarily domestic travelers (79%), often arriving from nearby Paris, typically belonging to the Post-2000s (Gen Z/Alpha) group (50%), primarily speaking French or English.
- Domestic travelers account for 78.6% of guests.
- Key international markets include France (78.6%) and Belgium (6.3%).
- Top languages spoken are French (45.4%) followed by English (33%).
- A significant demographic segment is the Post-2000s (Gen Z/Alpha) group, representing 50% of guests.
Recommendations for Hosts
- Target domestic marketing efforts towards travelers from Paris and Lyon.
- Tailor amenities and listing descriptions to appeal to the dominant Post-2000s (Gen Z/Alpha) demographic (e.g., highlight fast WiFi, smart home features, local guides).
- Highlight unique local experiences or amenities relevant to the primary guest profile.
- Consider seasonal promotions aligned with peak travel times for key origin markets.
Nearby Short-Term Rental Market Comparison
How does the Mieussy Airbnb market stack up against its neighbors? Compare key performance metrics like average monthly revenue, ADR, and occupancy rates in surrounding areas to understand the broader regional STR landscape.
| Market | Active Properties | Monthly Revenue | Daily Rate | Avg. Occupancy |
|---|---|---|---|---|
| Lauterbrunnen | 525 | $7,079 | $546.45 | 54% |
| La Rivière-Enverse | 17 | $5,972 | $624.02 | 41% |
| Les Clefs | 30 | $5,741 | $323.11 | 44% |
| Matten bei Interlaken | 52 | $5,674 | $316.63 | 63% |
| Iseltwald | 14 | $5,491 | $331.95 | 58% |
| Habkern | 13 | $5,382 | $344.74 | 50% |
| Interlaken | 288 | $4,987 | $310.52 | 56% |
| Zermatt | 734 | $4,604 | $463.00 | 46% |
| Oberhofen am Thunersee | 24 | $4,572 | $265.94 | 55% |
| Sigriswil | 99 | $4,371 | $271.90 | 58% |