Marsanne Airbnb Market Analysis 2025: Short Term Rental Data & Vacation Rental Statistics in Auvergne-Rhône-Alpes, France
Is Airbnb profitable in Marsanne in 2025? Explore comprehensive Airbnb analytics for Marsanne, Auvergne-Rhône-Alpes, France to uncover income potential. This 2025 STR market report for Marsanne, based on AirROI data from April 2024 to March 2025, reveals key trends in the niche market of 22 active listings.
Whether you're considering an Airbnb investment in Marsanne, optimizing your existing vacation rental, or exploring rental arbitrage opportunities, understanding the Marsanne Airbnb data is crucial. Leveraging the low regulation environment is key to maximizing your short term rental income potential. Let's dive into the specifics.
Key Marsanne Airbnb Performance Metrics Overview
Monthly Airbnb Revenue Variations & Income Potential in Marsanne (2025)
Understanding the monthly revenue variations for Airbnb listings in Marsanne is key to maximizing your short term rental income potential. Seasonality significantly impacts earnings. Our analysis, based on data from the past 12 months, shows that the peak revenue month for STRs in Marsanne is typically August, while February often presents the lowest earnings, highlighting opportunities for strategic pricing adjustments during shoulder and low seasons. Explore the typical Airbnb income in Marsanne across different performance tiers:
- Best-in-class properties (Top 10%) achieve $6,026+ monthly, often utilizing dynamic pricing and superior guest experiences.
- Strong performing properties (Top 25%) earn $2,799 or more, indicating effective management and desirable locations/amenities.
- Typical properties (Median) generate around $1,393 per month, representing the average market performance.
- Entry-level properties (Bottom 25%) see earnings around $736, often with potential for optimization.
Average Monthly Airbnb Earnings Trend in Marsanne
Marsanne Airbnb Occupancy Rate Trends (2025)
Maximize your bookings by understanding the Marsanne STR occupancy trends. Seasonal demand shifts significantly influence how often properties are booked. Typically, Augustsees the highest demand (peak season occupancy), while February experiences the lowest (low season). Effective strategies, like adjusting minimum stays or offering promotions, can boost occupancy during slower periods. Here's how different property tiers perform in Marsanne:
- Best-in-class properties (Top 10%) achieve 59%+ occupancy, indicating high desirability and potentially optimized availability.
- Strong performing properties (Top 25%) maintain 47% or higher occupancy, suggesting good market fit and guest satisfaction.
- Typical properties (Median) have an occupancy rate around 32%.
- Entry-level properties (Bottom 25%) average 22% occupancy, potentially facing higher vacancy.
Average Monthly Occupancy Rate Trend in Marsanne
Average Daily Rate (ADR) Airbnb Trends in Marsanne (2025)
Effective short term rental pricing strategy in Marsanne involves understanding monthly ADR fluctuations. The Average Daily Rate (ADR) for Airbnb in Marsanne typically peaks in December and dips lowest during April. Leveraging Airbnb dynamic pricing tools or strategies based on this seasonality can significantly boost revenue. Here's a look at the typical nightly rates achieved:
- Best-in-class properties (Top 10%) command rates of $328+ per night, often due to premium features or locations.
- Strong performing properties (Top 25%) achieve nightly rates of $184 or more.
- Typical properties (Median) charge around $104 per night.
- Entry-level properties (Bottom 25%) earn around $82 per night.
Average Daily Rate (ADR) Trend by Month in Marsanne
Get Live Marsanne Market Intelligence 👇

Explore Real-time Analytics
Airbnb Seasonality Analysis & Trends in Marsanne (2025)
Peak Season (August, July, June)
- Revenue averages $4,539 per month
- Occupancy rates average 57.9%
- Daily rates average $170
Shoulder Season
- Revenue averages $2,688 per month
- Occupancy maintains around 29.0%
- Daily rates hold near $175
Low Season (January, February, March)
- Revenue drops to average $1,581 per month
- Occupancy decreases to average 21.9%
- Daily rates adjust to average $191
Seasonality Insights for Marsanne
- The Airbnb seasonality in Marsanne shows highly seasonal trends requiring careful strategy. While the sections above show seasonal averages, it's also insightful to look at the extremes:
- During the high season, the absolute peak month showcases Marsanne's highest earning potential, with monthly revenues capable of climbing to $4,668, occupancy reaching a high of 65.4%, and ADRs peaking at $199.
- Conversely, the slowest single month of the year, typically falling within the low season, marks the market's lowest point. In this month, revenue might dip to $1,443, occupancy could drop to 17.8%, and ADRs may adjust down to $161.
- Understanding both the seasonal averages and these monthly peaks and troughs in revenue, occupancy, and ADR is crucial for maximizing your Airbnb profit potential in Marsanne.
Seasonal Strategies for Maximizing Profit
- Peak Season: Maximize revenue through premium pricing and potentially longer minimum stays. Ensure high availability.
- Low Season: Offer competitive pricing, special promotions (e.g., extended stay discounts), and flexible cancellation policies. Target off-season travelers like remote workers or budget-conscious guests.
- Shoulder Seasons: Implement dynamic pricing that balances peak and low rates. Target weekend travelers or specific events. Offer slightly more flexible terms than peak season.
- Regularly analyze your own performance against these Marsanne seasonality benchmarks and adjust your pricing and availability strategy accordingly.
Best Areas for Airbnb Investment in Marsanne (2025)
Exploring the top neighborhoods for short-term rentals in Marsanne? This section highlights key areas, outlining why they are attractive for hosts and guests, along with notable local attractions. Consider these locations based on your target guest profile and investment strategy.
| Neighborhood / Area | Why Host Here? (Target Guests & Appeal) | Key Attractions & Landmarks |
|---|---|---|
| Marsanne Village | Charming village known for its picturesque surroundings, historic architecture, and tranquil atmosphere. Ideal for guests seeking a peaceful retreat in the French countryside, close to local vineyards and nature trails. | Saint-Jean-Baptiste Church, local vineyards and wineries, hiking trails, scenic views of the Drôme Valley |
| Grignan | Nearby town famed for its beautiful Château, vibrant markets, and lovely cobblestone streets. Attracts tourists interested in history, culture, and gastronomy, making it a popular day trip from Marsanne. | Château de Grignan, Grignan Village Market, lavender fields, local art galleries, ponds and nature parks |
| Montélimar | The nearest city famous for nougat and its rich history. Offers a variety of shops, restaurants, and cultural sites, appealing to travelers seeking both culinary experiences and urban amenities. | Nougat factories, Château des Adhémar, Towers of Montélimar, local festivals, historic downtown |
| Dieulefit | Known for its pottery and arts scene, Dieulefit attracts art lovers and those interested in local craftsmanship. It offers a laid-back environment with plenty of artisan shops and galleries. | Pottery workshops, local artisan shops, art galleries, beautiful landscapes, cultural events |
| Nyons | A charming town known as the 'olive capital of France', popular for its olive oil and wine production. Ideal for gourmets and nature lovers looking to explore the region's flavors and outdoor activities. | Olive oil mills, Nyons Vineyards, Provencal market, historic village center, hiking and biking trails |
| Vaison-la-Romaine | Famed for its Roman ruins and medieval town, it attracts history enthusiasts and cultural tourists. Offers a unique blend of ancient architecture and vibrant local life. | Roman ruins, Castles, Outdoor Markets, Vaison-la-Romaine Festival, scenic hilltop views |
| Valréas | A lovely town in the heart of the wine-producing area. Known for its historic sites and rural charm, perfect for wine enthusiasts and those seeking a relaxing getaway. | Valréas Vineyards, local historic buildings, wine tasting tours, festivals, picturesque countryside |
| Buis-les-Baronnies | A quaint village surrounded by beautiful mountains, offering outdoor activities and stunning scenery. Attracts nature lovers and adventure seekers looking for hiking and wellness retreats. | hiking trails, local organic markets, natural parks, wellness retreats, art and craft shops |
Understanding Airbnb License Requirements & STR Laws in Marsanne (2025)
While Marsanne, Auvergne-Rhône-Alpes, France currently shows low STR regulations, specific Airbnb license requirements might still exist or change. Always verify the latest short term rental regulations and Airbnb license requirements directly with local government authorities for Marsanne to ensure full compliance before hosting.
(Source: AirROI data, 2025, based on 9% licensed listings)
Top Performing Airbnb Properties in Marsanne (2025)
Benchmark your potential! Explore examples of top-performing Airbnb properties in Marsannebased on Trailing Twelve Month (TTM) revenue. Analyze their characteristics, revenue, occupancy rate, and ADR to understand what drives success in this market.

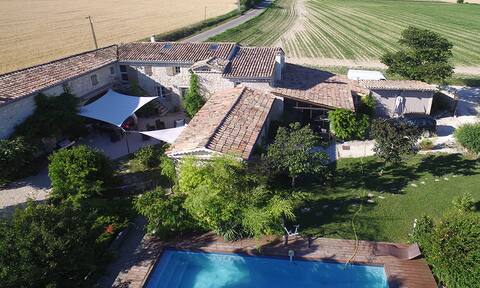
Le Mas de La Source, Marsanne, 26 people, 2 hectares
Entire Place • 11 bedrooms
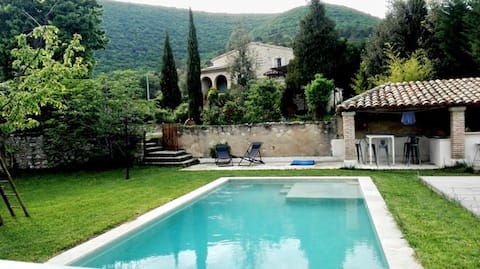
Le Mas du Pas, 16 p, 7 hp, 5 bathrooms, heated pool
Entire Place • 7 bedrooms
House in the Drôme
Entire Place • 4 bedrooms
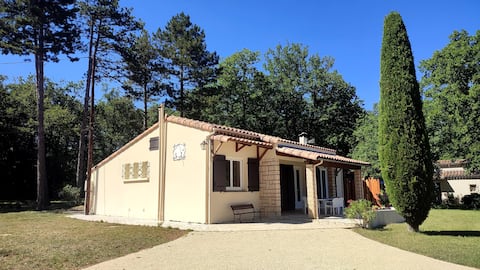
Countryside house with garden/pool Marsanne
Entire Place • 2 bedrooms
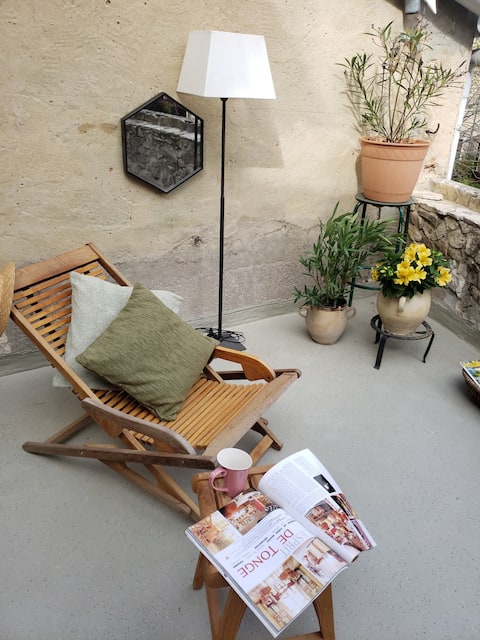
Le refuge du Marquis: Pleasant T3 with terrace
Entire Place • 2 bedrooms

Large apartment with terrace
Entire Place • 2 bedrooms
Note: Performance varies based on location, size, amenities, seasonality, and management quality. Data reflects the past 12 months.
Top Performing Airbnb Hosts in Marsanne (2025)
Learn from the best! This table showcases top-performing Airbnb hosts in Marsanne based on the number of properties managed and estimated total revenue over the past year. Analyze their scale and performance metrics.
| Host Name | Properties | Grossing Revenue | Stay Reviews | Avg Rating |
|---|---|---|---|---|
| Thibault | 1 | $212,582 | 42 | 5.00/5.0 |
| Isabelle | 1 | $83,788 | 54 | 4.87/5.0 |
| Marie | 5 | $68,408 | 37 | 4.74/5.0 |
| Sophie | 1 | $49,405 | 4 | 5.00/5.0 |
| Nicolas | 1 | $25,581 | 14 | 4.93/5.0 |
| Marie | 1 | $14,920 | 67 | 4.96/5.0 |
| Thierry | 1 | $14,050 | 7 | 4.86/5.0 |
| Philippe | 1 | $12,095 | 227 | 4.93/5.0 |
| Frédérique | 1 | $11,222 | 54 | 5.00/5.0 |
| Pascale | 1 | $8,385 | 20 | 4.90/5.0 |
Analyzing the strategies of top hosts, such as their property selection, pricing, and guest communication, can offer valuable lessons for optimizing your own Airbnb operations in Marsanne.
Dive Deeper: Advanced Marsanne STR Market Data (2025)
Ready to unlock more insights? AirROI provides access to advanced metrics and comprehensive Airbnb data for Marsanne. Explore detailed analytics beyond this report to refine your investment strategy, optimize pricing, and maximize your vacation rental profits.
Explore Advanced MetricsMarsanne Short-Term Rental Market Composition (2025): Property & Room Types
Room Type Distribution
Property Type Distribution
Market Composition Insights for Marsanne
- The Marsanne Airbnb market composition is heavily skewed towards Entire Home/Apt listings, which make up 90.9% of the 22 active rentals. This indicates strong guest preference for privacy and space.
- Looking at the property type distribution in Marsanne, House properties are the most common (63.6%), reflecting the local real estate landscape.
- Houses represent a significant 63.6% portion, catering likely to families or larger groups.
- Smaller segments like others (combined 4.5%) offer potential for unique stay experiences.
Marsanne Airbnb Room Capacity Analysis (2025): Bedroom Distribution
Distribution of Listings by Number of Bedrooms
Room Capacity Insights for Marsanne
- The dominant room capacity in Marsanne is 1 bedroom listings, making up 40.9% of the market. This suggests a strong demand for properties suitable for couples or solo travelers.
- Together, 1 bedroom and 2 bedrooms properties represent 68.2% of the active Airbnb listings in Marsanne, indicating a high concentration in these sizes.
- A significant 27.2% of listings offer 3+ bedrooms, catering to larger groups and families seeking more space in Marsanne.
Marsanne Vacation Rental Guest Capacity Trends (2025)
Distribution of Listings by Guest Capacity
Guest Capacity Insights for Marsanne
- The most common guest capacity trend in Marsanne vacation rentals is listings accommodating 4 guests (27.3%). This suggests the primary traveler segment is likely small families or groups.
- Properties designed for 4 guests and 6 guests dominate the Marsanne STR market, accounting for 50.0% of listings.
- 45.4% of properties accommodate 6+ guests, serving the market segment for larger families or group travel in Marsanne.
- On average, properties in Marsanne are equipped to host 4.7 guests.
Marsanne Airbnb Booking Patterns (2025): Available vs. Booked Days
Available Days Distribution
Booked Days Distribution
Booking Pattern Insights for Marsanne
- The most common availability pattern in Marsanne falls within the 181-270 days range, representing 54.5% of listings. This suggests many properties have significant open periods on their calendars.
- Approximately 100.0% of listings show high availability (181+ days open annually), indicating potential for increased bookings or specific owner usage patterns.
- For booked days, the 91-180 days range is most frequent in Marsanne (59.1%), reflecting common guest stay durations or potential owner blocking patterns.
Marsanne Airbnb Minimum Stay Requirements Analysis
Distribution of Listings by Minimum Night Requirement
1 Night
4 listings
19% of total
2 Nights
10 listings
47.6% of total
3 Nights
2 listings
9.5% of total
4-6 Nights
2 listings
9.5% of total
7-29 Nights
2 listings
9.5% of total
30+ Nights
1 listings
4.8% of total
Key Insights
- The most prevalent minimum stay requirement in Marsanne is 2 Nights, adopted by 47.6% of listings. This highlights the market's preference for shorter, flexible bookings.
- A strong majority (66.6%) of the Marsanne Airbnb data shows acceptance of very short stays (1-2 nights), indicating a dynamic, high-turnover market.
Recommendations
- Align with the market by considering a 2 Nights minimum stay, as 47.6% of Marsanne hosts use this setting.
- If feasible, allowing 1-night stays, especially midweek or during low season, could capture last-minute bookings, as only 19% currently do.
- A 2-night minimum appears standard (47.6%). Consider this for weekends or peak periods.
- Adjust minimum nights based on seasonality – potentially shorter during low season and longer during peak demand periods in Marsanne.
Marsanne Airbnb Cancellation Policy Trends Analysis (2025)
Flexible
11 listings
55% of total
Moderate
4 listings
20% of total
Firm
1 listings
5% of total
Strict
4 listings
20% of total
Cancellation Policy Insights for Marsanne
- The prevailing Airbnb cancellation policy trend in Marsanne is Flexible, used by 55% of listings.
- The market strongly favors guest-friendly terms, with 75.0% of listings offering Flexible or Moderate policies. This suggests guests in Marsanne may expect booking flexibility.
Recommendations for Hosts
- Consider adopting a Flexible policy to align with the 55% market standard in Marsanne.
- Given the high prevalence of Flexible policies (55%), offering this can enhance booking appeal, especially during shoulder seasons.
- Regularly review your cancellation policy against competitors and market demand shifts in Marsanne.
Marsanne STR Booking Lead Time Analysis (2025)
Average Booking Lead Time by Month
Booking Lead Time Insights for Marsanne
- The overall average booking lead time for vacation rentals in Marsanne is 57 days.
- Guests book furthest in advance for stays during June (average 154 days), likely coinciding with peak travel demand or local events.
- The shortest booking windows occur for stays in March (average 34 days), indicating more last-minute travel plans during this time.
- Seasonally, Summer (119 days avg.) sees the longest lead times, while Winter (51 days avg.) has the shortest, reflecting typical travel planning cycles.
Recommendations for Hosts
- Use the overall average lead time (57 days) as a baseline for your pricing and availability strategy in Marsanne.
- For June stays, consider implementing length-of-stay discounts or slightly higher rates for bookings made less than 154 days out to capitalize on advance planning.
- Target marketing efforts for the Summer season well in advance (at least 119 days) to capture early planners.
- Monitor your own booking lead times against these Marsanne averages to identify opportunities for dynamic pricing adjustments.
Popular & Essential Airbnb Amenities in Marsanne (2025)
Amenity Prevalence
Amenity Insights for Marsanne
- Essential amenities in Marsanne that guests expect include: Kitchen, Oven, Free parking on premises, Dishes and silverware. Lacking these (any) could significantly impact bookings.
- Popular amenities like Clothing storage, Wifi, Outdoor dining area are common but not universal. Offering these can provide a competitive edge.
- Warning: Wifi is not universally provided but is considered essential globally. Ensure reliable Wifi is offered.
Recommendations for Hosts
- Ensure your listing includes all essential amenities for Marsanne: Kitchen, Oven, Free parking on premises, Dishes and silverware.
- Prioritize adding missing essentials: Kitchen, Oven, Free parking on premises, Dishes and silverware.
- Consider adding popular differentiators like Clothing storage or Wifi to increase appeal.
- Highlight unique or less common amenities you offer (e.g., hot tub, dedicated workspace, EV charger) in your listing description and photos.
- Regularly check competitor amenities in Marsanne to stay competitive.
Marsanne Airbnb Guest Demographics & Profile Analysis (2025)
Guest Profile Summary for Marsanne
- The typical guest profile for Airbnb in Marsanne consists of primarily domestic travelers (78%), often arriving from nearby Lyon, typically belonging to the Post-2000s (Gen Z/Alpha) group (50%), primarily speaking French or English.
- Domestic travelers account for 77.6% of guests.
- Key international markets include France (77.6%) and Switzerland (5.6%).
- Top languages spoken are French (37.5%) followed by English (36.5%).
- A significant demographic segment is the Post-2000s (Gen Z/Alpha) group, representing 50% of guests.
Recommendations for Hosts
- Target domestic marketing efforts towards travelers from Lyon and Paris.
- Tailor amenities and listing descriptions to appeal to the dominant Post-2000s (Gen Z/Alpha) demographic (e.g., highlight fast WiFi, smart home features, local guides).
- Highlight unique local experiences or amenities relevant to the primary guest profile.
- Consider seasonal promotions aligned with peak travel times for key origin markets.
Nearby Short-Term Rental Market Comparison
How does the Marsanne Airbnb market stack up against its neighbors? Compare key performance metrics like average monthly revenue, ADR, and occupancy rates in surrounding areas to understand the broader regional STR landscape.
| Market | Active Properties | Monthly Revenue | Daily Rate | Avg. Occupancy |
|---|---|---|---|---|
| Villeneuvette | 13 | $4,150 | $337.56 | 44% |
| Divajeu | 19 | $3,941 | $410.65 | 42% |
| Saint-Germain-au-Mont-d'Or | 10 | $3,928 | $316.02 | 40% |
| Dommartin | 11 | $3,905 | $327.00 | 36% |
| Courzieu | 11 | $3,267 | $287.83 | 52% |
| Vanosc | 13 | $3,072 | $224.52 | 44% |
| Chantepérier | 20 | $3,057 | $281.60 | 37% |
| Gordes | 225 | $2,913 | $366.32 | 43% |
| Redessan | 19 | $2,834 | $334.82 | 34% |
| Fontarèches | 11 | $2,802 | $525.31 | 34% |