Limonest Airbnb Market Analysis 2025: Short Term Rental Data & Vacation Rental Statistics in Auvergne-Rhône-Alpes, France
Is Airbnb profitable in Limonest in 2025? Explore comprehensive Airbnb analytics for Limonest, Auvergne-Rhône-Alpes, France to uncover income potential. This 2025 STR market report for Limonest, based on AirROI data from April 2024 to March 2025, reveals key trends in the niche market of 26 active listings.
Whether you're considering an Airbnb investment in Limonest, optimizing your existing vacation rental, or exploring rental arbitrage opportunities, understanding the Limonest Airbnb data is crucial. Understanding the local regulations is key to maximizing your short term rental income potential. Let's dive into the specifics.
Key Limonest Airbnb Performance Metrics Overview
Monthly Airbnb Revenue Variations & Income Potential in Limonest (2025)
Understanding the monthly revenue variations for Airbnb listings in Limonest is key to maximizing your short term rental income potential. Seasonality significantly impacts earnings. Our analysis, based on data from the past 12 months, shows that the peak revenue month for STRs in Limonest is typically August, while March often presents the lowest earnings, highlighting opportunities for strategic pricing adjustments during shoulder and low seasons. Explore the typical Airbnb income in Limonest across different performance tiers:
- Best-in-class properties (Top 10%) achieve $6,867+ monthly, often utilizing dynamic pricing and superior guest experiences.
- Strong performing properties (Top 25%) earn $2,702 or more, indicating effective management and desirable locations/amenities.
- Typical properties (Median) generate around $1,535 per month, representing the average market performance.
- Entry-level properties (Bottom 25%) see earnings around $637, often with potential for optimization.
Average Monthly Airbnb Earnings Trend in Limonest
Limonest Airbnb Occupancy Rate Trends (2025)
Maximize your bookings by understanding the Limonest STR occupancy trends. Seasonal demand shifts significantly influence how often properties are booked. Typically, Augustsees the highest demand (peak season occupancy), while March experiences the lowest (low season). Effective strategies, like adjusting minimum stays or offering promotions, can boost occupancy during slower periods. Here's how different property tiers perform in Limonest:
- Best-in-class properties (Top 10%) achieve 78%+ occupancy, indicating high desirability and potentially optimized availability.
- Strong performing properties (Top 25%) maintain 65% or higher occupancy, suggesting good market fit and guest satisfaction.
- Typical properties (Median) have an occupancy rate around 45%.
- Entry-level properties (Bottom 25%) average 21% occupancy, potentially facing higher vacancy.
Average Monthly Occupancy Rate Trend in Limonest
Average Daily Rate (ADR) Airbnb Trends in Limonest (2025)
Effective short term rental pricing strategy in Limonest involves understanding monthly ADR fluctuations. The Average Daily Rate (ADR) for Airbnb in Limonest typically peaks in December and dips lowest during October. Leveraging Airbnb dynamic pricing tools or strategies based on this seasonality can significantly boost revenue. Here's a look at the typical nightly rates achieved:
- Best-in-class properties (Top 10%) command rates of $360+ per night, often due to premium features or locations.
- Strong performing properties (Top 25%) achieve nightly rates of $191 or more.
- Typical properties (Median) charge around $85 per night.
- Entry-level properties (Bottom 25%) earn around $58 per night.
Average Daily Rate (ADR) Trend by Month in Limonest
Get Live Limonest Market Intelligence 👇

Explore Real-time Analytics
Airbnb Seasonality Analysis & Trends in Limonest (2025)
Peak Season (August, May, July)
- Revenue averages $3,691 per month
- Occupancy rates average 51.1%
- Daily rates average $149
Shoulder Season
- Revenue averages $2,372 per month
- Occupancy maintains around 46.3%
- Daily rates hold near $153
Low Season (January, February, March)
- Revenue drops to average $1,366 per month
- Occupancy decreases to average 34.6%
- Daily rates adjust to average $160
Seasonality Insights for Limonest
- The Airbnb seasonality in Limonest shows highly seasonal trends requiring careful strategy. While the sections above show seasonal averages, it's also insightful to look at the extremes:
- During the high season, the absolute peak month showcases Limonest's highest earning potential, with monthly revenues capable of climbing to $4,494, occupancy reaching a high of 60.7%, and ADRs peaking at $165.
- Conversely, the slowest single month of the year, typically falling within the low season, marks the market's lowest point. In this month, revenue might dip to $979, occupancy could drop to 28.5%, and ADRs may adjust down to $141.
- Understanding both the seasonal averages and these monthly peaks and troughs in revenue, occupancy, and ADR is crucial for maximizing your Airbnb profit potential in Limonest.
Seasonal Strategies for Maximizing Profit
- Peak Season: Maximize revenue through premium pricing and potentially longer minimum stays. Ensure high availability.
- Low Season: Offer competitive pricing, special promotions (e.g., extended stay discounts), and flexible cancellation policies. Target off-season travelers like remote workers or budget-conscious guests.
- Shoulder Seasons: Implement dynamic pricing that balances peak and low rates. Target weekend travelers or specific events. Offer slightly more flexible terms than peak season.
- Regularly analyze your own performance against these Limonest seasonality benchmarks and adjust your pricing and availability strategy accordingly.
Best Areas for Airbnb Investment in Limonest (2025)
Exploring the top neighborhoods for short-term rentals in Limonest? This section highlights key areas, outlining why they are attractive for hosts and guests, along with notable local attractions. Consider these locations based on your target guest profile and investment strategy.
| Neighborhood / Area | Why Host Here? (Target Guests & Appeal) | Key Attractions & Landmarks |
|---|---|---|
| Limonest Village | Charming village atmosphere with historic architecture and a peaceful setting. Popular for visitors looking for a quieter experience while still being close to Lyon's attractions. | Historic Church of Limonest, Château de la Barge, Parc de la Mairie, Local markets, Hiking trails in the surrounding hills |
| Lyon City Center | Vibrant urban area with rich cultural heritage, renowned gastronomy, and a lively nightlife. Ideal for attracting both leisure and business travelers. | Basilica of Notre-Dame de Fourvière, Lyon Cathedral, Place des Terreaux, Museum of Fine Arts, Rue de la République |
| Tassin-la-Demi-Lune | Close to Lyon, this suburb offers a suburban feel with convenient access to the city. Perfect for families and business travelers seeking short commutes. | Parc de la Mairie, Local shops and cafes, Metro access to Lyon, Cultural events, Nearby parks |
| Charbonnières-les-Bains | Known for its thermal baths and spa resorts, it attracts visitors seeking relaxation and wellness retreats. | Thermal Baths of Charbonnières, Casino, Parc des Fontaines, Local vineyards, Cultural festivals |
| Écully | Residential area with educational institutions and a culinary school, making it appealing for students and gastronomes visiting Lyon. | EM Lyon Business School, Culinary Institute, Local parks, Wine tastings, Gastronomy events |
| Saint-Didier-au-Mont-d'Or | Picturesque area known for its natural beauty and outdoor activities, ideal for those looking to escape the city hustle. | Mont d'Or hiking trails, Historic village center, Local vineyards, Parc de la Mairie, Cultural events |
| Neuville-sur-Saône | Historic town on the banks of the Saône river, offering a relaxing riverfront atmosphere. Popular for water sports and nature walks. | Riverside walks, Historical architecture, Local markets, Nearby vineyards, Cultural activities |
| Limonest Business Park | Located near business centers and tech hubs, this area is ideal for business travelers looking for convenient stay options during their trips to Lyon. | Office complexes, Tech start-ups, Business events, Proximity to Lyon, Transport links |
Understanding Airbnb License Requirements & STR Laws in Limonest (2025)
With 12% of listings showing registration in 2025, understanding potential Airbnb license requirements is crucial in Limonest. Always verify the latest short term rental regulations and Airbnb license requirements directly with local government authorities for Limonest to ensure full compliance before hosting.
(Source: AirROI data, 2025, based on 12% licensed listings)
Top Performing Airbnb Properties in Limonest (2025)
Benchmark your potential! Explore examples of top-performing Airbnb properties in Limonestbased on Trailing Twelve Month (TTM) revenue. Analyze their characteristics, revenue, occupancy rate, and ADR to understand what drives success in this market.

Karen Chocolat's place
Entire Place • 4 bedrooms
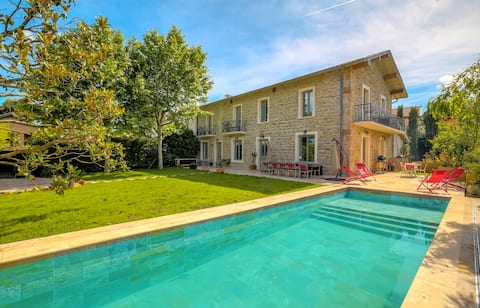
Charming house with Pool near Lyon
Entire Place • 6 bedrooms
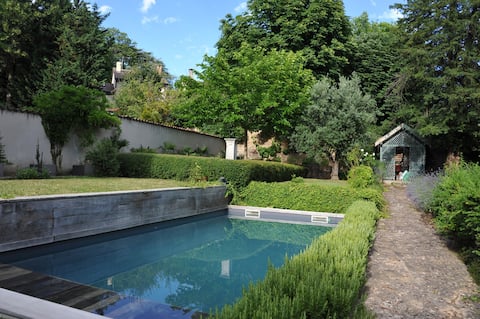
Large quiet house in a private property
Entire Place • 3 bedrooms
charming home sleeping 8... pool garden
Entire Place • 4 bedrooms
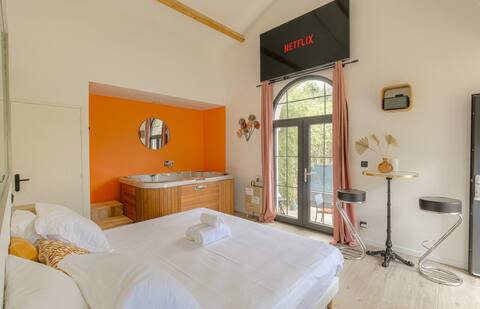
Romantic and Sensuelle
Entire Place • 1 bedroom
Fanny's apartment, close to Lyon and Techlid
Entire Place • 1 bedroom
Note: Performance varies based on location, size, amenities, seasonality, and management quality. Data reflects the past 12 months.
Top Performing Airbnb Hosts in Limonest (2025)
Learn from the best! This table showcases top-performing Airbnb hosts in Limonest based on the number of properties managed and estimated total revenue over the past year. Analyze their scale and performance metrics.
| Host Name | Properties | Grossing Revenue | Stay Reviews | Avg Rating |
|---|---|---|---|---|
| Guillaume | 2 | $119,512 | 123 | 4.75/5.0 |
| Karen | 1 | $115,216 | 61 | 4.74/5.0 |
| Stephanie | 2 | $46,567 | 80 | 4.97/5.0 |
| Mickael | 1 | $43,330 | 9 | 4.33/5.0 |
| Jean-Pierre | 1 | $40,164 | 8 | 4.75/5.0 |
| Pierre | 3 | $28,198 | 22 | 5.00/5.0 |
| Eric | 1 | $23,395 | 20 | 4.85/5.0 |
| Remi | 1 | $23,262 | 67 | 4.93/5.0 |
| Margaret | 1 | $17,751 | 185 | 4.96/5.0 |
| Host #13433038 | 1 | $14,084 | 0 | 0.00/5.0 |
Analyzing the strategies of top hosts, such as their property selection, pricing, and guest communication, can offer valuable lessons for optimizing your own Airbnb operations in Limonest.
Dive Deeper: Advanced Limonest STR Market Data (2025)
Ready to unlock more insights? AirROI provides access to advanced metrics and comprehensive Airbnb data for Limonest. Explore detailed analytics beyond this report to refine your investment strategy, optimize pricing, and maximize your vacation rental profits.
Explore Advanced MetricsLimonest Short-Term Rental Market Composition (2025): Property & Room Types
Room Type Distribution
Property Type Distribution
Market Composition Insights for Limonest
- The Limonest Airbnb market composition is heavily skewed towards Entire Home/Apt listings, which make up 92.3% of the 26 active rentals. This indicates strong guest preference for privacy and space.
- Looking at the property type distribution in Limonest, House properties are the most common (57.7%), reflecting the local real estate landscape.
- Houses represent a significant 57.7% portion, catering likely to families or larger groups.
Limonest Airbnb Room Capacity Analysis (2025): Bedroom Distribution
Distribution of Listings by Number of Bedrooms
Room Capacity Insights for Limonest
- The dominant room capacity in Limonest is 1 bedroom listings, making up 53.8% of the market. This suggests a strong demand for properties suitable for couples or solo travelers.
- Together, 1 bedroom and 4 bedrooms properties represent 65.3% of the active Airbnb listings in Limonest, indicating a high concentration in these sizes.
- With over half the market (53.8%) consisting of studios or 1-bedroom units, Limonest is particularly well-suited for individuals or couples.
- A significant 30.7% of listings offer 3+ bedrooms, catering to larger groups and families seeking more space in Limonest.
Limonest Vacation Rental Guest Capacity Trends (2025)
Distribution of Listings by Guest Capacity
Guest Capacity Insights for Limonest
- The most common guest capacity trend in Limonest vacation rentals is listings accommodating 2 guests (42.3%). This suggests the primary traveler segment is likely couples or solo travelers.
- Properties designed for 2 guests and 8+ guests dominate the Limonest STR market, accounting for 65.4% of listings.
- A significant 50.0% of listings cater specifically to 1-2 guests, highlighting strong demand from couples and solo travelers in Limonest.
- 30.7% of properties accommodate 6+ guests, serving the market segment for larger families or group travel in Limonest.
- On average, properties in Limonest are equipped to host 3.9 guests.
Limonest Airbnb Booking Patterns (2025): Available vs. Booked Days
Available Days Distribution
Booked Days Distribution
Booking Pattern Insights for Limonest
- The most common availability pattern in Limonest falls within the 181-270 days range, representing 38.5% of listings. This suggests many properties have significant open periods on their calendars.
- Approximately 73.1% of listings show high availability (181+ days open annually), indicating potential for increased bookings or specific owner usage patterns.
- For booked days, the 91-180 days range is most frequent in Limonest (38.5%), reflecting common guest stay durations or potential owner blocking patterns.
- A notable 26.9% of properties secure long booking periods (181+ days booked per year), highlighting successful long-term rental strategies or significant owner usage.
Limonest Airbnb Minimum Stay Requirements Analysis
Distribution of Listings by Minimum Night Requirement
1 Night
3 listings
13% of total
2 Nights
7 listings
30.4% of total
3 Nights
1 listings
4.3% of total
4-6 Nights
7 listings
30.4% of total
7-29 Nights
3 listings
13% of total
30+ Nights
2 listings
8.7% of total
Key Insights
- The most prevalent minimum stay requirement in Limonest is 2 Nights, adopted by 30.4% of listings. This highlights the market's preference for shorter, flexible bookings.
Recommendations
- Align with the market by considering a 2 Nights minimum stay, as 30.4% of Limonest hosts use this setting.
- If feasible, allowing 1-night stays, especially midweek or during low season, could capture last-minute bookings, as only 13% currently do.
- A 2-night minimum appears standard (30.4%). Consider this for weekends or peak periods.
- Explore offering discounts for stays of 30+ nights to attract the 8.7% of the market seeking extended stays.
- Adjust minimum nights based on seasonality – potentially shorter during low season and longer during peak demand periods in Limonest.
Limonest Airbnb Cancellation Policy Trends Analysis (2025)
Flexible
3 listings
15% of total
Moderate
9 listings
45% of total
Firm
5 listings
25% of total
Strict
3 listings
15% of total
Cancellation Policy Insights for Limonest
- The prevailing Airbnb cancellation policy trend in Limonest is Moderate, used by 45% of listings.
- There's a relatively balanced mix between guest-friendly (60.0%) and stricter (40.0%) policies, offering choices for different guest needs.
Recommendations for Hosts
- Consider adopting a Moderate policy to align with the 45% market standard in Limonest.
- Regularly review your cancellation policy against competitors and market demand shifts in Limonest.
Limonest STR Booking Lead Time Analysis (2025)
Average Booking Lead Time by Month
Booking Lead Time Insights for Limonest
- The overall average booking lead time for vacation rentals in Limonest is 43 days.
- Guests book furthest in advance for stays during June (average 86 days), likely coinciding with peak travel demand or local events.
- The shortest booking windows occur for stays in January (average 33 days), indicating more last-minute travel plans during this time.
- Seasonally, Summer (73 days avg.) sees the longest lead times, while Winter (36 days avg.) has the shortest, reflecting typical travel planning cycles.
Recommendations for Hosts
- Use the overall average lead time (43 days) as a baseline for your pricing and availability strategy in Limonest.
- For June stays, consider implementing length-of-stay discounts or slightly higher rates for bookings made less than 86 days out to capitalize on advance planning.
- Target marketing efforts for the Summer season well in advance (at least 73 days) to capture early planners.
- Monitor your own booking lead times against these Limonest averages to identify opportunities for dynamic pricing adjustments.
Popular & Essential Airbnb Amenities in Limonest (2025)
Amenity Prevalence
Amenity Insights for Limonest
- Essential amenities in Limonest that guests expect include: Essentials, Hot water, Wifi, Heating, TV. Lacking these (any) could significantly impact bookings.
- Popular amenities like Kitchen, Hair dryer, Dishes and silverware are common but not universal. Offering these can provide a competitive edge.
Recommendations for Hosts
- Ensure your listing includes all essential amenities for Limonest: Essentials, Hot water, Wifi, Heating, TV.
- Consider adding popular differentiators like Kitchen or Hair dryer to increase appeal.
- Highlight unique or less common amenities you offer (e.g., hot tub, dedicated workspace, EV charger) in your listing description and photos.
- Regularly check competitor amenities in Limonest to stay competitive.
Limonest Airbnb Guest Demographics & Profile Analysis (2025)
Guest Profile Summary for Limonest
- The typical guest profile for Airbnb in Limonest consists of primarily domestic travelers (85%), often arriving from nearby Lyon, typically belonging to the Post-2000s (Gen Z/Alpha) group (50%), primarily speaking French or English.
- Domestic travelers account for 84.8% of guests.
- Key international markets include France (84.8%) and United Kingdom (3.9%).
- Top languages spoken are French (48.2%) followed by English (32.6%).
- A significant demographic segment is the Post-2000s (Gen Z/Alpha) group, representing 50% of guests.
Recommendations for Hosts
- Target domestic marketing efforts towards travelers from Lyon and Paris.
- Tailor amenities and listing descriptions to appeal to the dominant Post-2000s (Gen Z/Alpha) demographic (e.g., highlight fast WiFi, smart home features, local guides).
- Highlight unique local experiences or amenities relevant to the primary guest profile.
- Consider seasonal promotions aligned with peak travel times for key origin markets.
Nearby Short-Term Rental Market Comparison
How does the Limonest Airbnb market stack up against its neighbors? Compare key performance metrics like average monthly revenue, ADR, and occupancy rates in surrounding areas to understand the broader regional STR landscape.
| Market | Active Properties | Monthly Revenue | Daily Rate | Avg. Occupancy |
|---|---|---|---|---|
| Épinac | 14 | $5,147 | $333.01 | 37% |
| Divajeu | 19 | $3,941 | $410.65 | 42% |
| Saint-Germain-au-Mont-d'Or | 10 | $3,928 | $316.02 | 40% |
| Puligny-Montrachet | 11 | $3,908 | $398.00 | 44% |
| Dommartin | 11 | $3,905 | $327.00 | 36% |
| Juliénas | 11 | $3,378 | $292.32 | 46% |
| Courzieu | 11 | $3,267 | $287.83 | 52% |
| Vanosc | 13 | $3,072 | $224.52 | 44% |
| Chantepérier | 20 | $3,057 | $281.60 | 37% |
| Bligny-lès-Beaune | 24 | $2,930 | $233.89 | 44% |