Les Ollières-sur-Eyrieux Airbnb Market Analysis 2025: Short Term Rental Data & Vacation Rental Statistics in Auvergne-Rhône-Alpes, France
Is Airbnb profitable in Les Ollières-sur-Eyrieux in 2025? Explore comprehensive Airbnb analytics for Les Ollières-sur-Eyrieux, Auvergne-Rhône-Alpes, France to uncover income potential. This 2025 STR market report for Les Ollières-sur-Eyrieux, based on AirROI data from April 2024 to March 2025, reveals key trends in the niche market of 26 active listings.
Whether you're considering an Airbnb investment in Les Ollières-sur-Eyrieux, optimizing your existing vacation rental, or exploring rental arbitrage opportunities, understanding the Les Ollières-sur-Eyrieux Airbnb data is crucial. Understanding the local regulations is key to maximizing your short term rental income potential. Let's dive into the specifics.
Key Les Ollières-sur-Eyrieux Airbnb Performance Metrics Overview
Monthly Airbnb Revenue Variations & Income Potential in Les Ollières-sur-Eyrieux (2025)
Understanding the monthly revenue variations for Airbnb listings in Les Ollières-sur-Eyrieux is key to maximizing your short term rental income potential. Seasonality significantly impacts earnings. Our analysis, based on data from the past 12 months, shows that the peak revenue month for STRs in Les Ollières-sur-Eyrieux is typically August, while January often presents the lowest earnings, highlighting opportunities for strategic pricing adjustments during shoulder and low seasons. Explore the typical Airbnb income in Les Ollières-sur-Eyrieux across different performance tiers:
- Best-in-class properties (Top 10%) achieve $3,748+ monthly, often utilizing dynamic pricing and superior guest experiences.
- Strong performing properties (Top 25%) earn $2,571 or more, indicating effective management and desirable locations/amenities.
- Typical properties (Median) generate around $1,541 per month, representing the average market performance.
- Entry-level properties (Bottom 25%) see earnings around $756, often with potential for optimization.
Average Monthly Airbnb Earnings Trend in Les Ollières-sur-Eyrieux
Les Ollières-sur-Eyrieux Airbnb Occupancy Rate Trends (2025)
Maximize your bookings by understanding the Les Ollières-sur-Eyrieux STR occupancy trends. Seasonal demand shifts significantly influence how often properties are booked. Typically, Augustsees the highest demand (peak season occupancy), while January experiences the lowest (low season). Effective strategies, like adjusting minimum stays or offering promotions, can boost occupancy during slower periods. Here's how different property tiers perform in Les Ollières-sur-Eyrieux:
- Best-in-class properties (Top 10%) achieve 70%+ occupancy, indicating high desirability and potentially optimized availability.
- Strong performing properties (Top 25%) maintain 58% or higher occupancy, suggesting good market fit and guest satisfaction.
- Typical properties (Median) have an occupancy rate around 43%.
- Entry-level properties (Bottom 25%) average 24% occupancy, potentially facing higher vacancy.
Average Monthly Occupancy Rate Trend in Les Ollières-sur-Eyrieux
Average Daily Rate (ADR) Airbnb Trends in Les Ollières-sur-Eyrieux (2025)
Effective short term rental pricing strategy in Les Ollières-sur-Eyrieux involves understanding monthly ADR fluctuations. The Average Daily Rate (ADR) for Airbnb in Les Ollières-sur-Eyrieux typically peaks in August and dips lowest during March. Leveraging Airbnb dynamic pricing tools or strategies based on this seasonality can significantly boost revenue. Here's a look at the typical nightly rates achieved:
- Best-in-class properties (Top 10%) command rates of $207+ per night, often due to premium features or locations.
- Strong performing properties (Top 25%) achieve nightly rates of $173 or more.
- Typical properties (Median) charge around $108 per night.
- Entry-level properties (Bottom 25%) earn around $80 per night.
Average Daily Rate (ADR) Trend by Month in Les Ollières-sur-Eyrieux
Get Live Les Ollières-sur-Eyrieux Market Intelligence 👇

Explore Real-time Analytics
Airbnb Seasonality Analysis & Trends in Les Ollières-sur-Eyrieux (2025)
Peak Season (August, July, May)
- Revenue averages $3,043 per month
- Occupancy rates average 65.6%
- Daily rates average $137
Shoulder Season
- Revenue averages $1,881 per month
- Occupancy maintains around 41.9%
- Daily rates hold near $130
Low Season (January, February, December)
- Revenue drops to average $950 per month
- Occupancy decreases to average 23.0%
- Daily rates adjust to average $118
Seasonality Insights for Les Ollières-sur-Eyrieux
- The Airbnb seasonality in Les Ollières-sur-Eyrieux shows highly seasonal trends requiring careful strategy. While the sections above show seasonal averages, it's also insightful to look at the extremes:
- During the high season, the absolute peak month showcases Les Ollières-sur-Eyrieux's highest earning potential, with monthly revenues capable of climbing to $3,420, occupancy reaching a high of 74.0%, and ADRs peaking at $140.
- Conversely, the slowest single month of the year, typically falling within the low season, marks the market's lowest point. In this month, revenue might dip to $643, occupancy could drop to 15.8%, and ADRs may adjust down to $115.
- Understanding both the seasonal averages and these monthly peaks and troughs in revenue, occupancy, and ADR is crucial for maximizing your Airbnb profit potential in Les Ollières-sur-Eyrieux.
Seasonal Strategies for Maximizing Profit
- Peak Season: Maximize revenue through premium pricing and potentially longer minimum stays. Ensure high availability.
- Low Season: Offer competitive pricing, special promotions (e.g., extended stay discounts), and flexible cancellation policies. Target off-season travelers like remote workers or budget-conscious guests.
- Shoulder Seasons: Implement dynamic pricing that balances peak and low rates. Target weekend travelers or specific events. Offer slightly more flexible terms than peak season.
- Regularly analyze your own performance against these Les Ollières-sur-Eyrieux seasonality benchmarks and adjust your pricing and availability strategy accordingly.
Best Areas for Airbnb Investment in Les Ollières-sur-Eyrieux (2025)
Exploring the top neighborhoods for short-term rentals in Les Ollières-sur-Eyrieux? This section highlights key areas, outlining why they are attractive for hosts and guests, along with notable local attractions. Consider these locations based on your target guest profile and investment strategy.
| Neighborhood / Area | Why Host Here? (Target Guests & Appeal) | Key Attractions & Landmarks |
|---|---|---|
| Les Ollières-sur-Eyrieux Village Center | Charming village atmosphere with local cafes, markets, and easy access to scenic views. Ideal for guests seeking a quiet retreat in nature. | Eyrieux River, Local Markets, Nature Trails, Historic Church of St. Joseph |
| River Access Areas | Areas near the Eyrieux River perfect for outdoor activities like kayaking and fishing. Popular among adventure seekers and nature lovers. | Kayaking, Fishing Spots, Picnic Areas, Walking Trails |
| Surrounding Countryside | The scenic countryside around Les Ollières offers peace and beautiful landscapes. Attracts those looking for rural escapes and hiking opportunities. | Hiking Trails, Vineyards, Panoramic Views, Cultural Heritage Sites |
| Nearby Monts d'Ardèche | Famous for stunning natural landscapes and outdoor recreation. Appeals to tourists interested in hiking, cycling, and exploring the Ardèche region. | Monts d'Ardèche Regional Park, Gorges de l'Ardèche, Château de Crussol |
| Local Restaurants and Cafés | Known for its regional gastronomy, Les Ollières is a hub for food lovers who want to explore traditional French cuisine and local wines. | Bistrots and Boulangeries, Wine Tasting Experiences, Culinary Tours |
| Cultural and Historical Sites | Rich in history with various sites of cultural importance. Draws history enthusiasts and cultural tourists. | Historic Sites, Local Museums, Art Exhibits |
| Family-Friendly Locations | Safe and welcoming for families with many activities for children and family-oriented attractions. Great for vacationing families. | Playgrounds, Family Activities, Educational Tours |
| Nearby Tourism Hubs (like Valence) | Close proximity to larger towns like Valence provides access to more amenities, shopping, and nightlife, appealing to a broader range of guests. | Shopping Areas, Cultural Events, Transportation Links |
Understanding Airbnb License Requirements & STR Laws in Les Ollières-sur-Eyrieux (2025)
With 19% of listings showing registration in 2025, understanding potential Airbnb license requirements is crucial in Les Ollières-sur-Eyrieux. Always verify the latest short term rental regulations and Airbnb license requirements directly with local government authorities for Les Ollières-sur-Eyrieux to ensure full compliance before hosting.
(Source: AirROI data, 2025, based on 19% licensed listings)
Top Performing Airbnb Properties in Les Ollières-sur-Eyrieux (2025)
Benchmark your potential! Explore examples of top-performing Airbnb properties in Les Ollières-sur-Eyrieuxbased on Trailing Twelve Month (TTM) revenue. Analyze their characteristics, revenue, occupancy rate, and ADR to understand what drives success in this market.
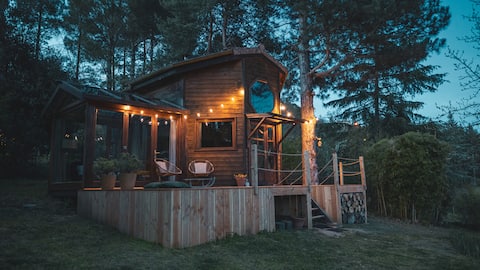
Cottage with private Nordic bath
Entire Place • 1 bedroom

Les chalets du Boucillon Albizia spa & pool 4*
Entire Place • 3 bedrooms
Les chalets du Boucillon - Chalet Chêne spa 4*
Entire Place • 1 bedroom
Les chalets du Boucillon -Chalet Acacia spa 4*
Entire Place • 1 bedroom
Le Pavillon - Les lodges de Praly
Entire Place • 1 bedroom
L'Escale - Les Lodges de Praly
Entire Place • 1 bedroom
Note: Performance varies based on location, size, amenities, seasonality, and management quality. Data reflects the past 12 months.
Top Performing Airbnb Hosts in Les Ollières-sur-Eyrieux (2025)
Learn from the best! This table showcases top-performing Airbnb hosts in Les Ollières-sur-Eyrieux based on the number of properties managed and estimated total revenue over the past year. Analyze their scale and performance metrics.
| Host Name | Properties | Grossing Revenue | Stay Reviews | Avg Rating |
|---|---|---|---|---|
| Valérie | 5 | $178,594 | 196 | 4.94/5.0 |
| Laurine | 4 | $142,504 | 227 | 4.97/5.0 |
| Jessika | 2 | $29,615 | 113 | 4.64/5.0 |
| Violette | 2 | $27,014 | 13 | 4.49/5.0 |
| Gaëtan | 1 | $22,033 | 74 | 5.00/5.0 |
| Roland | 1 | $21,736 | 41 | 4.90/5.0 |
| Marie-Pierre | 2 | $17,294 | 113 | 4.88/5.0 |
| Thierry | 1 | $14,023 | 25 | 4.88/5.0 |
| Marine | 1 | $11,593 | 23 | 4.83/5.0 |
| Catherine | 1 | $7,534 | 3 | 4.00/5.0 |
Analyzing the strategies of top hosts, such as their property selection, pricing, and guest communication, can offer valuable lessons for optimizing your own Airbnb operations in Les Ollières-sur-Eyrieux.
Dive Deeper: Advanced Les Ollières-sur-Eyrieux STR Market Data (2025)
Ready to unlock more insights? AirROI provides access to advanced metrics and comprehensive Airbnb data for Les Ollières-sur-Eyrieux. Explore detailed analytics beyond this report to refine your investment strategy, optimize pricing, and maximize your vacation rental profits.
Explore Advanced MetricsLes Ollières-sur-Eyrieux Short-Term Rental Market Composition (2025): Property & Room Types
Room Type Distribution
Property Type Distribution
Market Composition Insights for Les Ollières-sur-Eyrieux
- The Les Ollières-sur-Eyrieux Airbnb market composition is heavily skewed towards Entire Home/Apt listings, which make up 92.3% of the 26 active rentals. This indicates strong guest preference for privacy and space.
- Looking at the property type distribution in Les Ollières-sur-Eyrieux, House properties are the most common (84.6%), reflecting the local real estate landscape.
- Houses represent a significant 84.6% portion, catering likely to families or larger groups.
- The presence of 11.5% Hotel/Boutique listings indicates integration with traditional hospitality.
- Smaller segments like apartment/condo (combined 3.8%) offer potential for unique stay experiences.
Les Ollières-sur-Eyrieux Airbnb Room Capacity Analysis (2025): Bedroom Distribution
Distribution of Listings by Number of Bedrooms
Room Capacity Insights for Les Ollières-sur-Eyrieux
- The dominant room capacity in Les Ollières-sur-Eyrieux is 1 bedroom listings, making up 46.2% of the market. This suggests a strong demand for properties suitable for couples or solo travelers.
- Together, 1 bedroom and 2 bedrooms properties represent 69.3% of the active Airbnb listings in Les Ollières-sur-Eyrieux, indicating a high concentration in these sizes.
- A significant 26.9% of listings offer 3+ bedrooms, catering to larger groups and families seeking more space in Les Ollières-sur-Eyrieux.
Les Ollières-sur-Eyrieux Vacation Rental Guest Capacity Trends (2025)
Distribution of Listings by Guest Capacity
Guest Capacity Insights for Les Ollières-sur-Eyrieux
- The most common guest capacity trend in Les Ollières-sur-Eyrieux vacation rentals is listings accommodating 4 guests (34.6%). This suggests the primary traveler segment is likely small families or groups.
- Properties designed for 4 guests and 2 guests dominate the Les Ollières-sur-Eyrieux STR market, accounting for 65.4% of listings.
- 30.8% of properties accommodate 6+ guests, serving the market segment for larger families or group travel in Les Ollières-sur-Eyrieux.
- On average, properties in Les Ollières-sur-Eyrieux are equipped to host 4.3 guests.
Les Ollières-sur-Eyrieux Airbnb Booking Patterns (2025): Available vs. Booked Days
Available Days Distribution
Booked Days Distribution
Booking Pattern Insights for Les Ollières-sur-Eyrieux
- The most common availability pattern in Les Ollières-sur-Eyrieux falls within the 181-270 days range, representing 46.2% of listings. This suggests many properties have significant open periods on their calendars.
- Approximately 69.3% of listings show high availability (181+ days open annually), indicating potential for increased bookings or specific owner usage patterns.
- For booked days, the 91-180 days range is most frequent in Les Ollières-sur-Eyrieux (46.2%), reflecting common guest stay durations or potential owner blocking patterns.
- A notable 34.6% of properties secure long booking periods (181+ days booked per year), highlighting successful long-term rental strategies or significant owner usage.
Les Ollières-sur-Eyrieux Airbnb Minimum Stay Requirements Analysis
Distribution of Listings by Minimum Night Requirement
1 Night
8 listings
32% of total
2 Nights
8 listings
32% of total
3 Nights
2 listings
8% of total
4-6 Nights
2 listings
8% of total
7-29 Nights
1 listings
4% of total
30+ Nights
4 listings
16% of total
Key Insights
- The most prevalent minimum stay requirement in Les Ollières-sur-Eyrieux is 1 Night, adopted by 32% of listings. This highlights the market's preference for shorter, flexible bookings.
- A strong majority (64.0%) of the Les Ollières-sur-Eyrieux Airbnb data shows acceptance of very short stays (1-2 nights), indicating a dynamic, high-turnover market.
- A significant segment (16%) caters to monthly stays (30+ nights) in Les Ollières-sur-Eyrieux, pointing to opportunities in the extended-stay market.
Recommendations
- Align with the market by considering a 1 Night minimum stay, as 32% of Les Ollières-sur-Eyrieux hosts use this setting.
- Explore offering discounts for stays of 30+ nights to attract the 16% of the market seeking extended stays.
- Adjust minimum nights based on seasonality – potentially shorter during low season and longer during peak demand periods in Les Ollières-sur-Eyrieux.
Les Ollières-sur-Eyrieux Airbnb Cancellation Policy Trends Analysis (2025)
Flexible
7 listings
28% of total
Moderate
4 listings
16% of total
Firm
6 listings
24% of total
Strict
8 listings
32% of total
Cancellation Policy Insights for Les Ollières-sur-Eyrieux
- The prevailing Airbnb cancellation policy trend in Les Ollières-sur-Eyrieux is Strict, used by 32% of listings.
- A majority (56.0%) of hosts in Les Ollières-sur-Eyrieux utilize Firm or Strict policies, indicating a market where hosts prioritize booking security.
Recommendations for Hosts
- Consider adopting a Strict policy to align with the 32% market standard in Les Ollières-sur-Eyrieux.
- With 32% using Strict terms, this is a viable option in Les Ollières-sur-Eyrieux, particularly for high-value properties or during peak demand periods.
- Regularly review your cancellation policy against competitors and market demand shifts in Les Ollières-sur-Eyrieux.
Les Ollières-sur-Eyrieux STR Booking Lead Time Analysis (2025)
Average Booking Lead Time by Month
Booking Lead Time Insights for Les Ollières-sur-Eyrieux
- The overall average booking lead time for vacation rentals in Les Ollières-sur-Eyrieux is 45 days.
- Guests book furthest in advance for stays during July (average 95 days), likely coinciding with peak travel demand or local events.
- The shortest booking windows occur for stays in February (average 24 days), indicating more last-minute travel plans during this time.
- Seasonally, Summer (75 days avg.) sees the longest lead times, while Winter (33 days avg.) has the shortest, reflecting typical travel planning cycles.
Recommendations for Hosts
- Use the overall average lead time (45 days) as a baseline for your pricing and availability strategy in Les Ollières-sur-Eyrieux.
- For July stays, consider implementing length-of-stay discounts or slightly higher rates for bookings made less than 95 days out to capitalize on advance planning.
- Target marketing efforts for the Summer season well in advance (at least 75 days) to capture early planners.
- Monitor your own booking lead times against these Les Ollières-sur-Eyrieux averages to identify opportunities for dynamic pricing adjustments.
Popular & Essential Airbnb Amenities in Les Ollières-sur-Eyrieux (2025)
Amenity Prevalence
Amenity Insights for Les Ollières-sur-Eyrieux
- Popular amenities like Kitchen, Refrigerator, Coffee maker are common but not universal. Offering these can provide a competitive edge.
Recommendations for Hosts
- Consider adding popular differentiators like Kitchen or Refrigerator to increase appeal.
- Highlight unique or less common amenities you offer (e.g., hot tub, dedicated workspace, EV charger) in your listing description and photos.
- Regularly check competitor amenities in Les Ollières-sur-Eyrieux to stay competitive.
Les Ollières-sur-Eyrieux Airbnb Guest Demographics & Profile Analysis (2025)
Guest Profile Summary for Les Ollières-sur-Eyrieux
- The typical guest profile for Airbnb in Les Ollières-sur-Eyrieux consists of primarily domestic travelers (88%), often arriving from nearby Lyon, typically belonging to the Post-2000s (Gen Z/Alpha) group (50%), primarily speaking French or English.
- Domestic travelers account for 88.3% of guests.
- Key international markets include France (88.3%) and Switzerland (3.5%).
- Top languages spoken are French (48%) followed by English (32.1%).
- A significant demographic segment is the Post-2000s (Gen Z/Alpha) group, representing 50% of guests.
Recommendations for Hosts
- Target domestic marketing efforts towards travelers from Lyon and Grenoble.
- Tailor amenities and listing descriptions to appeal to the dominant Post-2000s (Gen Z/Alpha) demographic (e.g., highlight fast WiFi, smart home features, local guides).
- Highlight unique local experiences or amenities relevant to the primary guest profile.
- Consider seasonal promotions aligned with peak travel times for key origin markets.
Nearby Short-Term Rental Market Comparison
How does the Les Ollières-sur-Eyrieux Airbnb market stack up against its neighbors? Compare key performance metrics like average monthly revenue, ADR, and occupancy rates in surrounding areas to understand the broader regional STR landscape.
| Market | Active Properties | Monthly Revenue | Daily Rate | Avg. Occupancy |
|---|---|---|---|---|
| Villeneuvette | 13 | $4,150 | $337.56 | 44% |
| Divajeu | 19 | $3,941 | $410.65 | 42% |
| Saint-Germain-au-Mont-d'Or | 10 | $3,928 | $316.02 | 40% |
| Dommartin | 11 | $3,905 | $327.00 | 36% |
| Courzieu | 11 | $3,267 | $287.83 | 52% |
| Vanosc | 13 | $3,072 | $224.52 | 44% |
| Chantepérier | 20 | $3,057 | $281.60 | 37% |
| Gordes | 225 | $2,913 | $366.32 | 43% |
| Redessan | 19 | $2,834 | $334.82 | 34% |
| Fontarèches | 11 | $2,802 | $525.31 | 34% |