Les Belleville Airbnb Market Analysis 2025: Short Term Rental Data & Vacation Rental Statistics in Auvergne-Rhône-Alpes, France
Is Airbnb profitable in Les Belleville in 2025? Explore comprehensive Airbnb analytics for Les Belleville, Auvergne-Rhône-Alpes, France to uncover income potential. This 2025 STR market report for Les Belleville, based on AirROI data from April 2024 to March 2025, reveals key trends in the bustling market of 1,156 active listings.
Whether you're considering an Airbnb investment in Les Belleville, optimizing your existing vacation rental, or exploring rental arbitrage opportunities, understanding the Les Belleville Airbnb data is crucial. Navigating the high regulation landscape is key to maximizing your short term rental income potential. Let's dive into the specifics.
Key Les Belleville Airbnb Performance Metrics Overview
Monthly Airbnb Revenue Variations & Income Potential in Les Belleville (2025)
Understanding the monthly revenue variations for Airbnb listings in Les Belleville is key to maximizing your short term rental income potential. Seasonality significantly impacts earnings. Our analysis, based on data from the past 12 months, shows that the peak revenue month for STRs in Les Belleville is typically February, while October often presents the lowest earnings, highlighting opportunities for strategic pricing adjustments during shoulder and low seasons. Explore the typical Airbnb income in Les Belleville across different performance tiers:
- Best-in-class properties (Top 10%) achieve $5,987+ monthly, often utilizing dynamic pricing and superior guest experiences.
- Strong performing properties (Top 25%) earn $3,292 or more, indicating effective management and desirable locations/amenities.
- Typical properties (Median) generate around $1,786 per month, representing the average market performance.
- Entry-level properties (Bottom 25%) see earnings around $957, often with potential for optimization.
Average Monthly Airbnb Earnings Trend in Les Belleville
Les Belleville Airbnb Occupancy Rate Trends (2025)
Maximize your bookings by understanding the Les Belleville STR occupancy trends. Seasonal demand shifts significantly influence how often properties are booked. Typically, Februarysees the highest demand (peak season occupancy), while October experiences the lowest (low season). Effective strategies, like adjusting minimum stays or offering promotions, can boost occupancy during slower periods. Here's how different property tiers perform in Les Belleville:
- Best-in-class properties (Top 10%) achieve 74%+ occupancy, indicating high desirability and potentially optimized availability.
- Strong performing properties (Top 25%) maintain 53% or higher occupancy, suggesting good market fit and guest satisfaction.
- Typical properties (Median) have an occupancy rate around 35%.
- Entry-level properties (Bottom 25%) average 17% occupancy, potentially facing higher vacancy.
Average Monthly Occupancy Rate Trend in Les Belleville
Average Daily Rate (ADR) Airbnb Trends in Les Belleville (2025)
Effective short term rental pricing strategy in Les Belleville involves understanding monthly ADR fluctuations. The Average Daily Rate (ADR) for Airbnb in Les Belleville typically peaks in February and dips lowest during August. Leveraging Airbnb dynamic pricing tools or strategies based on this seasonality can significantly boost revenue. Here's a look at the typical nightly rates achieved:
- Best-in-class properties (Top 10%) command rates of $504+ per night, often due to premium features or locations.
- Strong performing properties (Top 25%) achieve nightly rates of $274 or more.
- Typical properties (Median) charge around $155 per night.
- Entry-level properties (Bottom 25%) earn around $105 per night.
Average Daily Rate (ADR) Trend by Month in Les Belleville
Get Live Les Belleville Market Intelligence 👇

Explore Real-time Analytics
Airbnb Seasonality Analysis & Trends in Les Belleville (2025)
Peak Season (February, January, March)
- Revenue averages $5,722 per month
- Occupancy rates average 59.9%
- Daily rates average $296
Shoulder Season
- Revenue averages $2,123 per month
- Occupancy maintains around 33.9%
- Daily rates hold near $230
Low Season (June, September, October)
- Revenue drops to average $1,050 per month
- Occupancy decreases to average 21.4%
- Daily rates adjust to average $216
Seasonality Insights for Les Belleville
- The Airbnb seasonality in Les Belleville shows highly seasonal trends requiring careful strategy. While the sections above show seasonal averages, it's also insightful to look at the extremes:
- During the high season, the absolute peak month showcases Les Belleville's highest earning potential, with monthly revenues capable of climbing to $6,610, occupancy reaching a high of 65.9%, and ADRs peaking at $312.
- Conversely, the slowest single month of the year, typically falling within the low season, marks the market's lowest point. In this month, revenue might dip to $987, occupancy could drop to 19.3%, and ADRs may adjust down to $213.
- Understanding both the seasonal averages and these monthly peaks and troughs in revenue, occupancy, and ADR is crucial for maximizing your Airbnb profit potential in Les Belleville.
Seasonal Strategies for Maximizing Profit
- Peak Season: Maximize revenue through premium pricing and potentially longer minimum stays. Ensure high availability.
- Low Season: Offer competitive pricing, special promotions (e.g., extended stay discounts), and flexible cancellation policies. Target off-season travelers like remote workers or budget-conscious guests.
- Shoulder Seasons: Implement dynamic pricing that balances peak and low rates. Target weekend travelers or specific events. Offer slightly more flexible terms than peak season.
- Regularly analyze your own performance against these Les Belleville seasonality benchmarks and adjust your pricing and availability strategy accordingly.
Best Areas for Airbnb Investment in Les Belleville (2025)
Exploring the top neighborhoods for short-term rentals in Les Belleville? This section highlights key areas, outlining why they are attractive for hosts and guests, along with notable local attractions. Consider these locations based on your target guest profile and investment strategy.
| Neighborhood / Area | Why Host Here? (Target Guests & Appeal) | Key Attractions & Landmarks |
|---|---|---|
| Les Menuires | A lively ski resort popular among families and groups, offering a wide range of winter activities. Ideal for tourists looking for ski-in/ski-out options and vibrant après-ski. | Three Valleys Ski Area, Les Menuires Ski School, La Masse Glacier, Ski lifts and slopes, Shopping at Les Menuires, Winter hiking trails |
| Val Thorens | Known as the highest ski resort in Europe, Val Thorens is ideal for snow enthusiasts who want guaranteed snow and a bustling atmosphere. Great for both winter sports and summer mountain activities. | Val Thorens Ski Area, Skiing and snowboarding, Après-ski venues, Biking and hiking trails, Panoramic views from the highest peaks, Spa and wellness centers |
| Saint-Martin-de-Belleville | A charming alpine village that offers a more traditional and peaceful experience compared to larger resorts. Attracts those looking for authentic local culture alongside outdoor activities. | Historic village center, Local cheese farms, Skiing in the Belleville Valley, Summer hiking paths, Cultural events and festivals |
| Brides-les-Bains | A quaint thermal spa town that serves as a gateway to the vast ski areas of the Three Valleys. Appeals to wellness seekers and eco-tourists looking for a relaxing retreat with quick access to the slopes. | Thermal baths and spa treatments, Massage and wellness centers, Grand Spa Thermal, Ski shuttle service to the slopes, Beautiful natural scenery, Gourmet dining options |
| Méribel | A favorite among experienced skiers and families alike, this resort combines charm and convenience with easy access to the extensive Three Valleys ski area. Popular for both winter and summer activities. | Méribel Ski Area, Scenic mountain trails, Charming chalets and hotels, Apres-ski venues, Summer hiking and biking, Local markets |
| Allemont | A picturesque village that offers a peaceful retreat while being close to ski areas and outdoor activities. Good option for those looking for value and nature experiences. | Alpe d'Huez Ski Area, Hiking and cycling paths, Isère river views, Local cafés and restaurants, Family-friendly activities |
| Orelle | An up-and-coming destination providing access to the vast ski terrains of the Three Valleys. Less crowded and offers a more laid-back atmosphere for tourists seeking tranquility. | Orelle Ski Area, Access to the slopes of Val Thorens, Beautiful alpine landscapes, Quiet village charm, Outdoor sports and activities year-round |
| Termignon | A smaller ski resort known for its authentic atmosphere and less commercial appeal. Ideal for adventurous travelers looking for a unique and tranquil alpine experience. | Termignon Ski Area, Ski touring routes, Mountain restaurants, Hiking trails, Breathtaking views of the Vanoise mountains |
Understanding Airbnb License Requirements & STR Laws in Les Belleville (2025)
Yes, Les Belleville, Auvergne-Rhône-Alpes, France enforces high STR regulations. Obtaining a license and ensuring compliance is almost certainly required according to current 2025 STR laws. Always verify the latest short term rental regulations and Airbnb license requirements directly with local government authorities for Les Belleville to ensure full compliance before hosting.
(Source: AirROI data, 2025, based on 34% licensed listings)
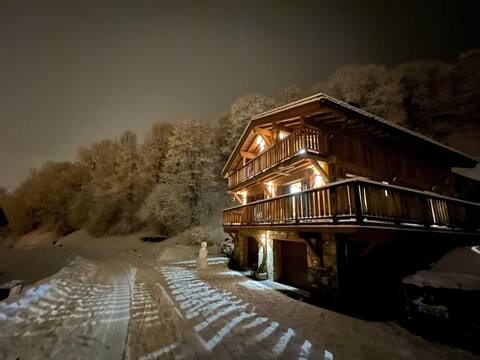
Top Performing Airbnb Properties in Les Belleville (2025)
Benchmark your potential! Explore examples of top-performing Airbnb properties in Les Bellevillebased on Trailing Twelve Month (TTM) revenue. Analyze their characteristics, revenue, occupancy rate, and ADR to understand what drives success in this market.
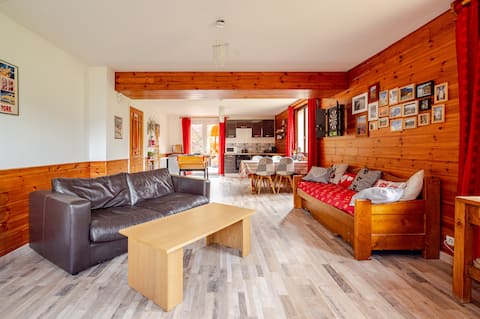
Chalet near Meribel 3 valleys
Entire Place • 5 bedrooms
Chalet spa sauna, taxi, 1km from slopes, 3 Vallées
Entire Place • 5 bedrooms
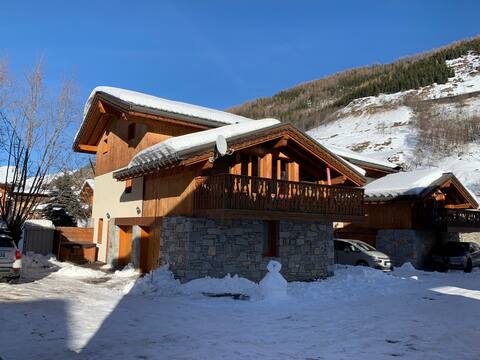
Le Refuge du Cabri 15P sauna jacuzzi les Ménuires.
Entire Place • 7 bedrooms
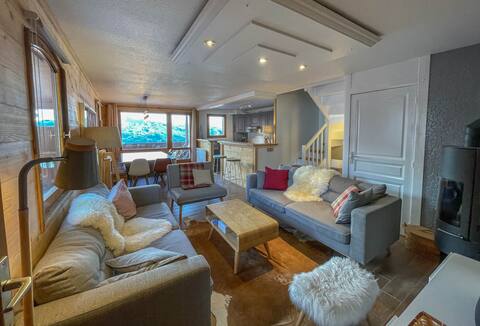
Duplex Val Thorens - La Lombarde 4 BR 10P (sunday to sunday)
Entire Place • 4 bedrooms
Luxury Private Chalet 3 bedrm - 10 pax VAL THORENS
Entire Place • 3 bedrooms
Chalet Aspen - Spa/Sauna/Gym/Fireplace/Parking
Entire Place • 8 bedrooms
Note: Performance varies based on location, size, amenities, seasonality, and management quality. Data reflects the past 12 months.
Top Performing Airbnb Hosts in Les Belleville (2025)
Learn from the best! This table showcases top-performing Airbnb hosts in Les Belleville based on the number of properties managed and estimated total revenue over the past year. Analyze their scale and performance metrics.
| Host Name | Properties | Grossing Revenue | Stay Reviews | Avg Rating |
|---|---|---|---|---|
| Sophie | 18 | $948,753 | 363 | 4.72/5.0 |
| Anne - Interhome Group | 62 | $461,633 | 243 | 2.86/5.0 |
| Christophe | 31 | $435,953 | 255 | 4.27/5.0 |
| Hugo | 6 | $374,758 | 37 | 2.32/5.0 |
| Jessica - Interhome Group | 39 | $300,490 | 187 | 3.41/5.0 |
| Host #449488095 | 7 | $278,268 | 0 | 0.00/5.0 |
| Mont-Blanc Booking | 24 | $278,030 | 151 | 3.03/5.0 |
| Thomas | 5 | $236,655 | 193 | 4.93/5.0 |
| Geraud | 2 | $231,403 | 16 | 4.96/5.0 |
| Bernard | 5 | $205,709 | 219 | 4.58/5.0 |
Analyzing the strategies of top hosts, such as their property selection, pricing, and guest communication, can offer valuable lessons for optimizing your own Airbnb operations in Les Belleville.
Dive Deeper: Advanced Les Belleville STR Market Data (2025)
Ready to unlock more insights? AirROI provides access to advanced metrics and comprehensive Airbnb data for Les Belleville. Explore detailed analytics beyond this report to refine your investment strategy, optimize pricing, and maximize your vacation rental profits.
Explore Advanced MetricsLes Belleville Short-Term Rental Market Composition (2025): Property & Room Types
Room Type Distribution
Property Type Distribution
Market Composition Insights for Les Belleville
- The Les Belleville Airbnb market composition is heavily skewed towards Entire Home/Apt listings, which make up 99.8% of the 1,156 active rentals. This indicates strong guest preference for privacy and space.
- Looking at the property type distribution in Les Belleville, Apartment/Condo properties are the most common (86.7%), reflecting the local real estate landscape.
- Smaller segments like hotel/boutique, unique stays, others (combined 0.4%) offer potential for unique stay experiences.
Les Belleville Airbnb Room Capacity Analysis (2025): Bedroom Distribution
Distribution of Listings by Number of Bedrooms
Room Capacity Insights for Les Belleville
- The dominant room capacity in Les Belleville is 1 bedroom listings, making up 41.7% of the market. This suggests a strong demand for properties suitable for couples or solo travelers.
- Together, 1 bedroom and 2 bedrooms properties represent 63.3% of the active Airbnb listings in Les Belleville, indicating a high concentration in these sizes.
- A significant 24.3% of listings offer 3+ bedrooms, catering to larger groups and families seeking more space in Les Belleville.
Les Belleville Vacation Rental Guest Capacity Trends (2025)
Distribution of Listings by Guest Capacity
Guest Capacity Insights for Les Belleville
- The most common guest capacity trend in Les Belleville vacation rentals is listings accommodating 4 guests (35.5%). This suggests the primary traveler segment is likely small families or groups.
- Properties designed for 4 guests and 6 guests dominate the Les Belleville STR market, accounting for 56.8% of listings.
- 43.0% of properties accommodate 6+ guests, serving the market segment for larger families or group travel in Les Belleville.
- On average, properties in Les Belleville are equipped to host 5.3 guests.
Les Belleville Airbnb Booking Patterns (2025): Available vs. Booked Days
Available Days Distribution
Booked Days Distribution
Booking Pattern Insights for Les Belleville
- The most common availability pattern in Les Belleville falls within the 271-366 days range, representing 54.2% of listings. This suggests many properties have significant open periods on their calendars.
- Approximately 94.0% of listings show high availability (181+ days open annually), indicating potential for increased bookings or specific owner usage patterns.
- For booked days, the 91-180 days range is most frequent in Les Belleville (41.3%), reflecting common guest stay durations or potential owner blocking patterns.
- A notable 6.6% of properties secure long booking periods (181+ days booked per year), highlighting successful long-term rental strategies or significant owner usage.
Les Belleville Airbnb Minimum Stay Requirements Analysis
Distribution of Listings by Minimum Night Requirement
1 Night
166 listings
16.2% of total
2 Nights
49 listings
4.8% of total
3 Nights
64 listings
6.2% of total
4-6 Nights
242 listings
23.6% of total
7-29 Nights
228 listings
22.2% of total
30+ Nights
277 listings
27% of total
Key Insights
- The most prevalent minimum stay requirement in Les Belleville is 30+ Nights, adopted by 27% of listings. This highlights the market's preference for longer commitments.
- A significant segment (27%) caters to monthly stays (30+ nights) in Les Belleville, pointing to opportunities in the extended-stay market.
Recommendations
- Align with the market by considering a 30+ Nights minimum stay, as 27% of Les Belleville hosts use this setting.
- If feasible, allowing 1-night stays, especially midweek or during low season, could capture last-minute bookings, as only 16.2% currently do.
- Explore offering discounts for stays of 30+ nights to attract the 27% of the market seeking extended stays.
- Adjust minimum nights based on seasonality – potentially shorter during low season and longer during peak demand periods in Les Belleville.
Les Belleville Airbnb Cancellation Policy Trends Analysis (2025)
Super Strict 60 Days
33 listings
3.2% of total
Super Strict 30 Days
43 listings
4.2% of total
Flexible
88 listings
8.5% of total
Moderate
108 listings
10.5% of total
Firm
303 listings
29.4% of total
Strict
455 listings
44.2% of total
Cancellation Policy Insights for Les Belleville
- The prevailing Airbnb cancellation policy trend in Les Belleville is Strict, used by 44.2% of listings.
- A majority (73.6%) of hosts in Les Belleville utilize Firm or Strict policies, indicating a market where hosts prioritize booking security.
Recommendations for Hosts
- Consider adopting a Strict policy to align with the 44.2% market standard in Les Belleville.
- With 44.2% using Strict terms, this is a viable option in Les Belleville, particularly for high-value properties or during peak demand periods.
- Regularly review your cancellation policy against competitors and market demand shifts in Les Belleville.
Les Belleville STR Booking Lead Time Analysis (2025)
Average Booking Lead Time by Month
Booking Lead Time Insights for Les Belleville
- The overall average booking lead time for vacation rentals in Les Belleville is 102 days.
- Guests book furthest in advance for stays during February (average 137 days), likely coinciding with peak travel demand or local events.
- The shortest booking windows occur for stays in August (average 58 days), indicating more last-minute travel plans during this time.
- Seasonally, Winter (113 days avg.) sees the longest lead times, while Summer (61 days avg.) has the shortest, reflecting typical travel planning cycles.
Recommendations for Hosts
- Use the overall average lead time (102 days) as a baseline for your pricing and availability strategy in Les Belleville.
- For February stays, consider implementing length-of-stay discounts or slightly higher rates for bookings made less than 137 days out to capitalize on advance planning.
- Target marketing efforts for the Winter season well in advance (at least 113 days) to capture early planners.
- Monitor your own booking lead times against these Les Belleville averages to identify opportunities for dynamic pricing adjustments.
Popular & Essential Airbnb Amenities in Les Belleville (2025)
Amenity Prevalence
Amenity Insights for Les Belleville
- Essential amenities in Les Belleville that guests expect include: Kitchen, Heating, TV. Lacking these (any) could significantly impact bookings.
- Popular amenities like Hot water, Smoke alarm, Refrigerator are common but not universal. Offering these can provide a competitive edge.
Recommendations for Hosts
- Ensure your listing includes all essential amenities for Les Belleville: Kitchen, Heating, TV.
- Prioritize adding missing essentials: Kitchen, Heating, TV.
- Consider adding popular differentiators like Hot water or Smoke alarm to increase appeal.
- Highlight unique or less common amenities you offer (e.g., hot tub, dedicated workspace, EV charger) in your listing description and photos.
- Regularly check competitor amenities in Les Belleville to stay competitive.
Les Belleville Airbnb Guest Demographics & Profile Analysis (2025)
Guest Profile Summary for Les Belleville
- The typical guest profile for Airbnb in Les Belleville consists of a mix of domestic (57%) and international guests, often arriving from nearby Paris, typically belonging to the Post-2000s (Gen Z/Alpha) group (50%), primarily speaking English or French.
- Domestic travelers account for 57.3% of guests.
- Key international markets include France (57.3%) and United Kingdom (16.2%).
- Top languages spoken are English (38.7%) followed by French (34.1%).
- A significant demographic segment is the Post-2000s (Gen Z/Alpha) group, representing 50% of guests.
Recommendations for Hosts
- Balance marketing efforts between domestic and international channels based on the guest mix.
- Tailor amenities and listing descriptions to appeal to the dominant Post-2000s (Gen Z/Alpha) demographic (e.g., highlight fast WiFi, smart home features, local guides).
- Highlight unique local experiences or amenities relevant to the primary guest profile.
- Consider seasonal promotions aligned with peak travel times for key origin markets.
Nearby Short-Term Rental Market Comparison
How does the Les Belleville Airbnb market stack up against its neighbors? Compare key performance metrics like average monthly revenue, ADR, and occupancy rates in surrounding areas to understand the broader regional STR landscape.
| Market | Active Properties | Monthly Revenue | Daily Rate | Avg. Occupancy |
|---|---|---|---|---|
| Lauterbrunnen | 525 | $7,079 | $546.45 | 54% |
| La Rivière-Enverse | 17 | $5,972 | $624.02 | 41% |
| Les Clefs | 30 | $5,741 | $323.11 | 44% |
| Matten bei Interlaken | 52 | $5,674 | $316.63 | 63% |
| Iseltwald | 14 | $5,491 | $331.95 | 58% |
| Habkern | 13 | $5,382 | $344.74 | 50% |
| Interlaken | 288 | $4,987 | $310.52 | 56% |
| Zermatt | 734 | $4,604 | $463.00 | 46% |
| Oberhofen am Thunersee | 24 | $4,572 | $265.94 | 55% |
| Monteu Roero | 16 | $4,432 | $540.14 | 36% |