La Rivière-Enverse Airbnb Market Analysis 2025: Short Term Rental Data & Vacation Rental Statistics in Auvergne-Rhône-Alpes, France
Is Airbnb profitable in La Rivière-Enverse in 2025? Explore comprehensive Airbnb analytics for La Rivière-Enverse, Auvergne-Rhône-Alpes, France to uncover income potential. This 2025 STR market report for La Rivière-Enverse, based on AirROI data from April 2024 to March 2025, reveals key trends in the niche market of 17 active listings.
Whether you're considering an Airbnb investment in La Rivière-Enverse, optimizing your existing vacation rental, or exploring rental arbitrage opportunities, understanding the La Rivière-Enverse Airbnb data is crucial. Leveraging the low regulation environment is key to maximizing your short term rental income potential. Let's dive into the specifics.
Key La Rivière-Enverse Airbnb Performance Metrics Overview
Monthly Airbnb Revenue Variations & Income Potential in La Rivière-Enverse (2025)
Understanding the monthly revenue variations for Airbnb listings in La Rivière-Enverse is key to maximizing your short term rental income potential. Seasonality significantly impacts earnings. Our analysis, based on data from the past 12 months, shows that the peak revenue month for STRs in La Rivière-Enverse is typically May, while August often presents the lowest earnings, highlighting opportunities for strategic pricing adjustments during shoulder and low seasons. Explore the typical Airbnb income in La Rivière-Enverse across different performance tiers:
- Best-in-class properties (Top 10%) achieve $21,317+ monthly, often utilizing dynamic pricing and superior guest experiences.
- Strong performing properties (Top 25%) earn $3,845 or more, indicating effective management and desirable locations/amenities.
- Typical properties (Median) generate around $2,018 per month, representing the average market performance.
- Entry-level properties (Bottom 25%) see earnings around $1,224, often with potential for optimization.
Average Monthly Airbnb Earnings Trend in La Rivière-Enverse
La Rivière-Enverse Airbnb Occupancy Rate Trends (2025)
Maximize your bookings by understanding the La Rivière-Enverse STR occupancy trends. Seasonal demand shifts significantly influence how often properties are booked. Typically, Augustsees the highest demand (peak season occupancy), while November experiences the lowest (low season). Effective strategies, like adjusting minimum stays or offering promotions, can boost occupancy during slower periods. Here's how different property tiers perform in La Rivière-Enverse:
- Best-in-class properties (Top 10%) achieve 72%+ occupancy, indicating high desirability and potentially optimized availability.
- Strong performing properties (Top 25%) maintain 60% or higher occupancy, suggesting good market fit and guest satisfaction.
- Typical properties (Median) have an occupancy rate around 37%.
- Entry-level properties (Bottom 25%) average 23% occupancy, potentially facing higher vacancy.
Average Monthly Occupancy Rate Trend in La Rivière-Enverse
Average Daily Rate (ADR) Airbnb Trends in La Rivière-Enverse (2025)
Effective short term rental pricing strategy in La Rivière-Enverse involves understanding monthly ADR fluctuations. The Average Daily Rate (ADR) for Airbnb in La Rivière-Enverse typically peaks in March and dips lowest during July. Leveraging Airbnb dynamic pricing tools or strategies based on this seasonality can significantly boost revenue. Here's a look at the typical nightly rates achieved:
- Best-in-class properties (Top 10%) command rates of $1,873+ per night, often due to premium features or locations.
- Strong performing properties (Top 25%) achieve nightly rates of $321 or more.
- Typical properties (Median) charge around $200 per night.
- Entry-level properties (Bottom 25%) earn around $104 per night.
Average Daily Rate (ADR) Trend by Month in La Rivière-Enverse
Get Live La Rivière-Enverse Market Intelligence 👇

Explore Real-time Analytics
Airbnb Seasonality Analysis & Trends in La Rivière-Enverse (2025)
Peak Season (May, October, July)
- Revenue averages $11,885 per month
- Occupancy rates average 37.7%
- Daily rates average $477
Shoulder Season
- Revenue averages $7,324 per month
- Occupancy maintains around 37.3%
- Daily rates hold near $583
Low Season (February, March, August)
- Revenue drops to average $5,679 per month
- Occupancy decreases to average 53.7%
- Daily rates adjust to average $590
Seasonality Insights for La Rivière-Enverse
- The Airbnb seasonality in La Rivière-Enverse shows highly seasonal trends requiring careful strategy. While the sections above show seasonal averages, it's also insightful to look at the extremes:
- During the high season, the absolute peak month showcases La Rivière-Enverse's highest earning potential, with monthly revenues capable of climbing to $13,222, occupancy reaching a high of 66.9%, and ADRs peaking at $711.
- Conversely, the slowest single month of the year, typically falling within the low season, marks the market's lowest point. In this month, revenue might dip to $5,306, occupancy could drop to 25.5%, and ADRs may adjust down to $379.
- Understanding both the seasonal averages and these monthly peaks and troughs in revenue, occupancy, and ADR is crucial for maximizing your Airbnb profit potential in La Rivière-Enverse.
Seasonal Strategies for Maximizing Profit
- Peak Season: Maximize revenue through premium pricing and potentially longer minimum stays. Ensure high availability.
- Low Season: Offer competitive pricing, special promotions (e.g., extended stay discounts), and flexible cancellation policies. Target off-season travelers like remote workers or budget-conscious guests.
- Shoulder Seasons: Implement dynamic pricing that balances peak and low rates. Target weekend travelers or specific events. Offer slightly more flexible terms than peak season.
- Regularly analyze your own performance against these La Rivière-Enverse seasonality benchmarks and adjust your pricing and availability strategy accordingly.
Best Areas for Airbnb Investment in La Rivière-Enverse (2025)
Exploring the top neighborhoods for short-term rentals in La Rivière-Enverse? This section highlights key areas, outlining why they are attractive for hosts and guests, along with notable local attractions. Consider these locations based on your target guest profile and investment strategy.
| Neighborhood / Area | Why Host Here? (Target Guests & Appeal) | Key Attractions & Landmarks |
|---|---|---|
| La Rivière-Enverse Centre | The heart of La Rivière-Enverse, offering charming local shops and cafes. It attracts visitors looking for a quaint village experience while being close to natural wonders. | Local markets, Scenic walking trails, Lac de La Rivière-Enverse, Village festivals, Historical architecture |
| Surrounding Nature Parks | This area features beautiful landscapes and outdoor activities, perfect for nature enthusiasts and families seeking outdoor adventures, including hiking and fishing. | Parc Naturel Régional des Volcans d'Auvergne, Fishing spots, Hiking trails, Scenic viewpoints, Wildlife observing |
| Chalet District | A popular spot for winter sports lovers, this area offers numerous chalets and is close to ski resorts. Ideal for seasonal rentals, particularly in winter. | Ski resorts, Winter sports activities, Local restaurants, Après-ski bars, Scenic views of the mountains |
| Lac de La Rivière-Enverse | This pristine lake area provides opportunities for relaxation and watersports, attracting visitors during the summer months and families on holiday. | Swimming, Water sports, Picnic areas, Cycling paths, Fishing |
| Nearby Historical Towns | Historic towns like Thiers and Ambert are rich in heritage and attract tourists interested in culture, history, and architecture, making them great options for Airbnb. | Historic sites, Local cuisine, Cultural festivals, Museums, Art galleries |
| Charming Countryside | The surrounding countryside offers a peaceful retreat with picturesque landscapes, appealing to those looking for relaxation and rural tourism. | Vineyard tours, Countryside walks, Local farm experiences, Scenic views, Cultural heritage |
| Family-friendly Activities | This area provides family-oriented attractions and recreational parks, making it perfect for families seeking engaging activities during their stay. | Adventure parks, Amusement parks, Outdoor playgrounds, Family-friendly restaurants, Campsites |
| Local Gastronomy | Investing in locations that highlight local cuisine can attract food lovers. This area is known for its delicious regional dishes and culinary experiences. | Local restaurants, Food festivals, Culinary tours, Wine tasting events, Cooking classes |
Understanding Airbnb License Requirements & STR Laws in La Rivière-Enverse (2025)
While La Rivière-Enverse, Auvergne-Rhône-Alpes, France currently shows low STR regulations, specific Airbnb license requirements might still exist or change. Always verify the latest short term rental regulations and Airbnb license requirements directly with local government authorities for La Rivière-Enverse to ensure full compliance before hosting.
(Source: AirROI data, 2025, based on 6% licensed listings)
Top Performing Airbnb Properties in La Rivière-Enverse (2025)
Benchmark your potential! Explore examples of top-performing Airbnb properties in La Rivière-Enversebased on Trailing Twelve Month (TTM) revenue. Analyze their characteristics, revenue, occupancy rate, and ADR to understand what drives success in this market.
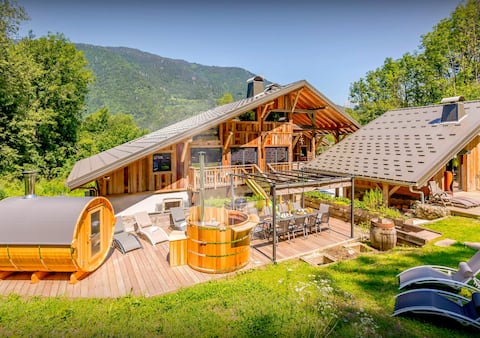
Luxury for 15 sauna and nordic bath
Entire Place • 7 bedrooms
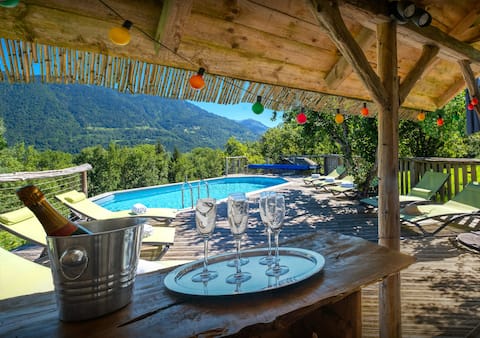
Farmhouse 15p - hot tub and pool
Entire Place • 7 bedrooms
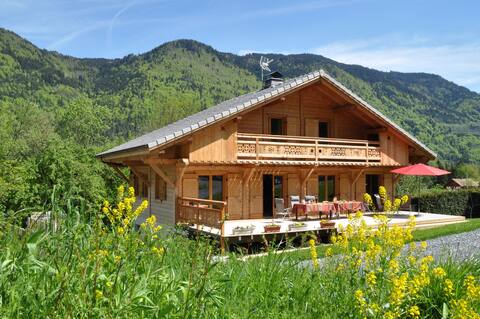
3 * mountain chalet in a quiet: sauna spa
Entire Place • 5 bedrooms
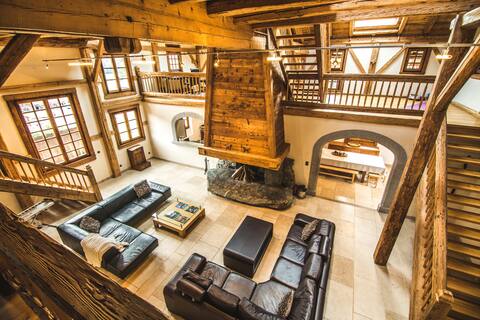
Chalet Forest - Luxurious renovated farmhouse - 12 people
Entire Place • 5 bedrooms
Nice apartment located in a quiet area.
Entire Place • 4 bedrooms
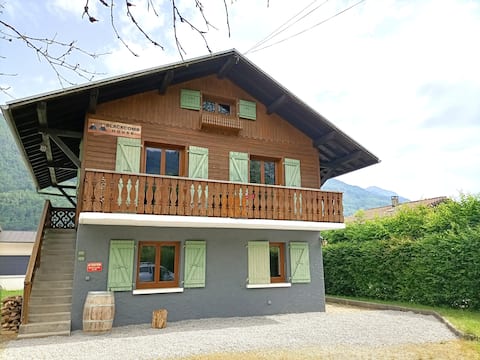
Chalet BLACKCOMB HOUSE close the ski piste & lake
Entire Place • 4 bedrooms
Note: Performance varies based on location, size, amenities, seasonality, and management quality. Data reflects the past 12 months.
Top Performing Airbnb Hosts in La Rivière-Enverse (2025)
Learn from the best! This table showcases top-performing Airbnb hosts in La Rivière-Enverse based on the number of properties managed and estimated total revenue over the past year. Analyze their scale and performance metrics.
| Host Name | Properties | Grossing Revenue | Stay Reviews | Avg Rating |
|---|---|---|---|---|
| OVO Network | 2 | $912,267 | 28 | 4.95/5.0 |
| Céline | 1 | $55,232 | 80 | 4.84/5.0 |
| Pascal | 1 | $37,347 | 22 | 4.95/5.0 |
| Virginia | 2 | $30,452 | 29 | 4.36/5.0 |
| Fabienne | 1 | $25,864 | 20 | 4.85/5.0 |
| Isabelle Et Mariano | 1 | $22,628 | 58 | 5.00/5.0 |
| Raphaël | 1 | $22,558 | 11 | 4.91/5.0 |
| Nicolas Et Vanessa | 1 | $22,159 | 89 | 4.96/5.0 |
| Claire | 1 | $18,783 | 31 | 4.81/5.0 |
| Christine | 1 | $18,195 | 59 | 4.75/5.0 |
Analyzing the strategies of top hosts, such as their property selection, pricing, and guest communication, can offer valuable lessons for optimizing your own Airbnb operations in La Rivière-Enverse.
Dive Deeper: Advanced La Rivière-Enverse STR Market Data (2025)
Ready to unlock more insights? AirROI provides access to advanced metrics and comprehensive Airbnb data for La Rivière-Enverse. Explore detailed analytics beyond this report to refine your investment strategy, optimize pricing, and maximize your vacation rental profits.
Explore Advanced MetricsLa Rivière-Enverse Short-Term Rental Market Composition (2025): Property & Room Types
Room Type Distribution
Property Type Distribution
Market Composition Insights for La Rivière-Enverse
- The La Rivière-Enverse Airbnb market composition is heavily skewed towards Entire Home/Apt listings, which make up 100% of the 17 active rentals. This indicates strong guest preference for privacy and space.
- Looking at the property type distribution in La Rivière-Enverse, House properties are the most common (76.5%), reflecting the local real estate landscape.
- Houses represent a significant 76.5% portion, catering likely to families or larger groups.
La Rivière-Enverse Airbnb Room Capacity Analysis (2025): Bedroom Distribution
Distribution of Listings by Number of Bedrooms
Room Capacity Insights for La Rivière-Enverse
- The dominant room capacity in La Rivière-Enverse is 4 bedrooms listings, making up 29.4% of the market. This suggests a strong demand for properties suitable for families or small groups.
- Together, 4 bedrooms and 1 bedroom properties represent 52.9% of the active Airbnb listings in La Rivière-Enverse, indicating a high concentration in these sizes.
- A significant 70.5% of listings offer 3+ bedrooms, catering to larger groups and families seeking more space in La Rivière-Enverse.
La Rivière-Enverse Vacation Rental Guest Capacity Trends (2025)
Distribution of Listings by Guest Capacity
Guest Capacity Insights for La Rivière-Enverse
- The most common guest capacity trend in La Rivière-Enverse vacation rentals is listings accommodating 8+ guests (70.6%). This suggests the primary traveler segment is likely larger groups.
- Properties designed for 8+ guests and 4 guests dominate the La Rivière-Enverse STR market, accounting for 88.2% of listings.
- 70.6% of properties accommodate 6+ guests, serving the market segment for larger families or group travel in La Rivière-Enverse.
- On average, properties in La Rivière-Enverse are equipped to host 6.6 guests.
La Rivière-Enverse Airbnb Booking Patterns (2025): Available vs. Booked Days
Available Days Distribution
Booked Days Distribution
Booking Pattern Insights for La Rivière-Enverse
- The most common availability pattern in La Rivière-Enverse falls within the 181-270 days range, representing 41.2% of listings. This suggests many properties have significant open periods on their calendars.
- Approximately 76.5% of listings show high availability (181+ days open annually), indicating potential for increased bookings or specific owner usage patterns.
- For booked days, the 91-180 days range is most frequent in La Rivière-Enverse (41.2%), reflecting common guest stay durations or potential owner blocking patterns.
- A notable 23.5% of properties secure long booking periods (181+ days booked per year), highlighting successful long-term rental strategies or significant owner usage.
La Rivière-Enverse Airbnb Minimum Stay Requirements Analysis
Distribution of Listings by Minimum Night Requirement
1 Night
4 listings
23.5% of total
2 Nights
4 listings
23.5% of total
4-6 Nights
5 listings
29.4% of total
7-29 Nights
1 listings
5.9% of total
30+ Nights
3 listings
17.6% of total
Key Insights
- The most prevalent minimum stay requirement in La Rivière-Enverse is 4-6 Nights, adopted by 29.4% of listings. This highlights the market's preference for longer commitments.
- A significant segment (17.6%) caters to monthly stays (30+ nights) in La Rivière-Enverse, pointing to opportunities in the extended-stay market.
Recommendations
- Align with the market by considering a 4-6 Nights minimum stay, as 29.4% of La Rivière-Enverse hosts use this setting.
- If feasible, allowing 1-night stays, especially midweek or during low season, could capture last-minute bookings, as only 23.5% currently do.
- Explore offering discounts for stays of 30+ nights to attract the 17.6% of the market seeking extended stays.
- Adjust minimum nights based on seasonality – potentially shorter during low season and longer during peak demand periods in La Rivière-Enverse.
La Rivière-Enverse Airbnb Cancellation Policy Trends Analysis (2025)
Super Strict 60 Days
2 listings
12.5% of total
Flexible
1 listings
6.3% of total
Moderate
2 listings
12.5% of total
Firm
6 listings
37.5% of total
Strict
5 listings
31.3% of total
Cancellation Policy Insights for La Rivière-Enverse
- The prevailing Airbnb cancellation policy trend in La Rivière-Enverse is Firm, used by 37.5% of listings.
- A majority (68.8%) of hosts in La Rivière-Enverse utilize Firm or Strict policies, indicating a market where hosts prioritize booking security.
Recommendations for Hosts
- Consider adopting a Firm policy to align with the 37.5% market standard in La Rivière-Enverse.
- With 31.3% using Strict terms, this is a viable option in La Rivière-Enverse, particularly for high-value properties or during peak demand periods.
- Regularly review your cancellation policy against competitors and market demand shifts in La Rivière-Enverse.
La Rivière-Enverse STR Booking Lead Time Analysis (2025)
Average Booking Lead Time by Month
Booking Lead Time Insights for La Rivière-Enverse
- The overall average booking lead time for vacation rentals in La Rivière-Enverse is 83 days.
- Guests book furthest in advance for stays during December (average 138 days), likely coinciding with peak travel demand or local events.
- The shortest booking windows occur for stays in June (average 41 days), indicating more last-minute travel plans during this time.
- Seasonally, Fall (109 days avg.) sees the longest lead times, while Summer (73 days avg.) has the shortest, reflecting typical travel planning cycles.
Recommendations for Hosts
- Use the overall average lead time (83 days) as a baseline for your pricing and availability strategy in La Rivière-Enverse.
- For December stays, consider implementing length-of-stay discounts or slightly higher rates for bookings made less than 138 days out to capitalize on advance planning.
- Target marketing efforts for the Fall season well in advance (at least 109 days) to capture early planners.
- Monitor your own booking lead times against these La Rivière-Enverse averages to identify opportunities for dynamic pricing adjustments.
Popular & Essential Airbnb Amenities in La Rivière-Enverse (2025)
Amenity Prevalence
Amenity Insights for La Rivière-Enverse
- Essential amenities in La Rivière-Enverse that guests expect include: Kitchen, Free parking on premises, Smoke alarm, Wifi. Lacking these (any) could significantly impact bookings.
- Popular amenities like Washer, Heating, Dryer are common but not universal. Offering these can provide a competitive edge.
Recommendations for Hosts
- Ensure your listing includes all essential amenities for La Rivière-Enverse: Kitchen, Free parking on premises, Smoke alarm, Wifi.
- Consider adding popular differentiators like Washer or Heating to increase appeal.
- Highlight unique or less common amenities you offer (e.g., hot tub, dedicated workspace, EV charger) in your listing description and photos.
- Regularly check competitor amenities in La Rivière-Enverse to stay competitive.
La Rivière-Enverse Airbnb Guest Demographics & Profile Analysis (2025)
Guest Profile Summary for La Rivière-Enverse
- The typical guest profile for Airbnb in La Rivière-Enverse consists of primarily domestic travelers (71%), often arriving from nearby Paris, typically belonging to the Post-2000s (Gen Z/Alpha) group (50%), primarily speaking French or English.
- Domestic travelers account for 71.1% of guests.
- Key international markets include France (71.1%) and Belgium (7.2%).
- Top languages spoken are French (42.9%) followed by English (33.7%).
- A significant demographic segment is the Post-2000s (Gen Z/Alpha) group, representing 50% of guests.
Recommendations for Hosts
- Target domestic marketing efforts towards travelers from Paris and Lyon.
- Tailor amenities and listing descriptions to appeal to the dominant Post-2000s (Gen Z/Alpha) demographic (e.g., highlight fast WiFi, smart home features, local guides).
- Highlight unique local experiences or amenities relevant to the primary guest profile.
- Consider seasonal promotions aligned with peak travel times for key origin markets.
Nearby Short-Term Rental Market Comparison
How does the La Rivière-Enverse Airbnb market stack up against its neighbors? Compare key performance metrics like average monthly revenue, ADR, and occupancy rates in surrounding areas to understand the broader regional STR landscape.
| Market | Active Properties | Monthly Revenue | Daily Rate | Avg. Occupancy |
|---|---|---|---|---|
| Lauterbrunnen | 525 | $7,079 | $546.45 | 54% |
| Les Clefs | 30 | $5,741 | $323.11 | 44% |
| Matten bei Interlaken | 52 | $5,674 | $316.63 | 63% |
| Iseltwald | 14 | $5,491 | $331.95 | 58% |
| Habkern | 13 | $5,382 | $344.74 | 50% |
| Interlaken | 288 | $4,987 | $310.52 | 56% |
| Zermatt | 734 | $4,604 | $463.00 | 46% |
| Oberhofen am Thunersee | 24 | $4,572 | $265.94 | 55% |
| Sigriswil | 99 | $4,371 | $271.90 | 58% |
| Bönigen | 32 | $4,321 | $253.84 | 64% |