Grenoble Airbnb Market Analysis 2025: Short Term Rental Data & Vacation Rental Statistics in Auvergne-Rhône-Alpes, France
Is Airbnb profitable in Grenoble in 2025? Explore comprehensive Airbnb analytics for Grenoble, Auvergne-Rhône-Alpes, France to uncover income potential. This 2025 STR market report for Grenoble, based on AirROI data from April 2024 to March 2025, reveals key trends in the bustling market of 1,288 active listings.
Whether you're considering an Airbnb investment in Grenoble, optimizing your existing vacation rental, or exploring rental arbitrage opportunities, understanding the Grenoble Airbnb data is crucial. Understanding the local regulations is key to maximizing your short term rental income potential. Let's dive into the specifics.
Key Grenoble Airbnb Performance Metrics Overview
Monthly Airbnb Revenue Variations & Income Potential in Grenoble (2025)
Understanding the monthly revenue variations for Airbnb listings in Grenoble is key to maximizing your short term rental income potential. Seasonality significantly impacts earnings. Our analysis, based on data from the past 12 months, shows that the peak revenue month for STRs in Grenoble is typically May, while March often presents the lowest earnings, highlighting opportunities for strategic pricing adjustments during shoulder and low seasons. Explore the typical Airbnb income in Grenoble across different performance tiers:
- Best-in-class properties (Top 10%) achieve $1,999+ monthly, often utilizing dynamic pricing and superior guest experiences.
- Strong performing properties (Top 25%) earn $1,444 or more, indicating effective management and desirable locations/amenities.
- Typical properties (Median) generate around $940 per month, representing the average market performance.
- Entry-level properties (Bottom 25%) see earnings around $495, often with potential for optimization.
Average Monthly Airbnb Earnings Trend in Grenoble
Grenoble Airbnb Occupancy Rate Trends (2025)
Maximize your bookings by understanding the Grenoble STR occupancy trends. Seasonal demand shifts significantly influence how often properties are booked. Typically, Septembersees the highest demand (peak season occupancy), while March experiences the lowest (low season). Effective strategies, like adjusting minimum stays or offering promotions, can boost occupancy during slower periods. Here's how different property tiers perform in Grenoble:
- Best-in-class properties (Top 10%) achieve 85%+ occupancy, indicating high desirability and potentially optimized availability.
- Strong performing properties (Top 25%) maintain 72% or higher occupancy, suggesting good market fit and guest satisfaction.
- Typical properties (Median) have an occupancy rate around 50%.
- Entry-level properties (Bottom 25%) average 26% occupancy, potentially facing higher vacancy.
Average Monthly Occupancy Rate Trend in Grenoble
Average Daily Rate (ADR) Airbnb Trends in Grenoble (2025)
Effective short term rental pricing strategy in Grenoble involves understanding monthly ADR fluctuations. The Average Daily Rate (ADR) for Airbnb in Grenoble typically peaks in December and dips lowest during April. Leveraging Airbnb dynamic pricing tools or strategies based on this seasonality can significantly boost revenue. Here's a look at the typical nightly rates achieved:
- Best-in-class properties (Top 10%) command rates of $102+ per night, often due to premium features or locations.
- Strong performing properties (Top 25%) achieve nightly rates of $77 or more.
- Typical properties (Median) charge around $56 per night.
- Entry-level properties (Bottom 25%) earn around $41 per night.
Average Daily Rate (ADR) Trend by Month in Grenoble
Get Live Grenoble Market Intelligence 👇

Explore Real-time Analytics
Airbnb Seasonality Analysis & Trends in Grenoble (2025)
Peak Season (May, April, June)
- Revenue averages $1,258 per month
- Occupancy rates average 45.6%
- Daily rates average $65
Shoulder Season
- Revenue averages $1,057 per month
- Occupancy maintains around 52.1%
- Daily rates hold near $66
Low Season (January, March, August)
- Revenue drops to average $906 per month
- Occupancy decreases to average 45.7%
- Daily rates adjust to average $65
Seasonality Insights for Grenoble
- The Airbnb seasonality in Grenoble shows moderate seasonality with distinct peak and low periods. While the sections above show seasonal averages, it's also insightful to look at the extremes:
- During the high season, the absolute peak month showcases Grenoble's highest earning potential, with monthly revenues capable of climbing to $1,284, occupancy reaching a high of 55.4%, and ADRs peaking at $69.
- Conversely, the slowest single month of the year, typically falling within the low season, marks the market's lowest point. In this month, revenue might dip to $817, occupancy could drop to 42.7%, and ADRs may adjust down to $64.
- Understanding both the seasonal averages and these monthly peaks and troughs in revenue, occupancy, and ADR is crucial for maximizing your Airbnb profit potential in Grenoble.
Seasonal Strategies for Maximizing Profit
- Peak Season: Maximize revenue through premium pricing and potentially longer minimum stays. Ensure high availability.
- Low Season: Offer competitive pricing, special promotions (e.g., extended stay discounts), and flexible cancellation policies. Target off-season travelers like remote workers or budget-conscious guests.
- Shoulder Seasons: Implement dynamic pricing that balances peak and low rates. Target weekend travelers or specific events. Offer slightly more flexible terms than peak season.
- Regularly analyze your own performance against these Grenoble seasonality benchmarks and adjust your pricing and availability strategy accordingly.
Best Areas for Airbnb Investment in Grenoble (2025)
Exploring the top neighborhoods for short-term rentals in Grenoble? This section highlights key areas, outlining why they are attractive for hosts and guests, along with notable local attractions. Consider these locations based on your target guest profile and investment strategy.
| Neighborhood / Area | Why Host Here? (Target Guests & Appeal) | Key Attractions & Landmarks |
|---|---|---|
| Vieille Ville | Grenoble's charming old town, known for its historic architecture and vibrant atmosphere. Popular among tourists for its narrow streets, local shops, and cafes, making it ideal for vacation rentals. | Place Grenette, Saint-Louis Church, Museum of Grenoble, Isère River Promenade, Bastille Fort |
| Bastille | Located on the hills overlooking Grenoble, it's a scenic area with stunning views, hiking trails, and historical significance. Great for adventurous tourists and outdoor activities. | The Bastille, Cable car to Bastille, Hiking trails, Parc Paul Mistral |
| Quartier Europole | Modern business district known for its vibrant atmosphere and proximity to transport links. Attracts business travelers, making it suitable for short-term rentals. | Cité Internationale, European Congress Center, Tram connections, Restaurant and cafes |
| Mistral | A residential area close to the city center and university. Appeals to students and young professionals, making it great for affordable stays. | Université Grenoble Alpes, Local markets, Parks and green spaces |
| Saint Bruno | A lively neighborhood known for its multicultural vibe, local dining options, and proximity to the city center, making it perfect for diverse travelers. | Saint Bruno Church, Local eateries, Public parks, Shopping options |
| Le Village Olympique | Renowned for its unique architecture and proximity to sports venues. Ideal for tourists attending events or looking for a modern stay. | Stadium, Olympic museums, Green spaces |
| Grand'Place | A vibrant area known for shopping, restaurants, and cultural activities. It attracts both tourists and locals, making it an excellent location for Airbnb hosting. | Shopping streets, Restaurants and cafes, Local events |
| Champagnier | A suburban area on the outskirts of Grenoble that offers a peaceful retreat while still being close to the city. Perfect for families or those seeking tranquility. | Local parks, Nature trails, Family-friendly activities |
Understanding Airbnb License Requirements & STR Laws in Grenoble (2025)
With 12% of listings showing registration in 2025, understanding potential Airbnb license requirements is crucial in Grenoble. Always verify the latest short term rental regulations and Airbnb license requirements directly with local government authorities for Grenoble to ensure full compliance before hosting.
(Source: AirROI data, 2025, based on 12% licensed listings)
Top Performing Airbnb Properties in Grenoble (2025)
Benchmark your potential! Explore examples of top-performing Airbnb properties in Grenoblebased on Trailing Twelve Month (TTM) revenue. Analyze their characteristics, revenue, occupancy rate, and ADR to understand what drives success in this market.

NOCNOC Le Reverso - 2 bright floors with view
Entire Place • 5 bedrooms
Big appartement in pedestrian center town parking
Entire Place • 5 bedrooms
Air conditioning | Garden 4 Parking | Large 5 Bedroom House
Entire Place • 5 bedrooms
Townhouse in the heart of Grenoble
Entire Place • 5 bedrooms
Family apartment, with view and private garage
Entire Place • 4 bedrooms
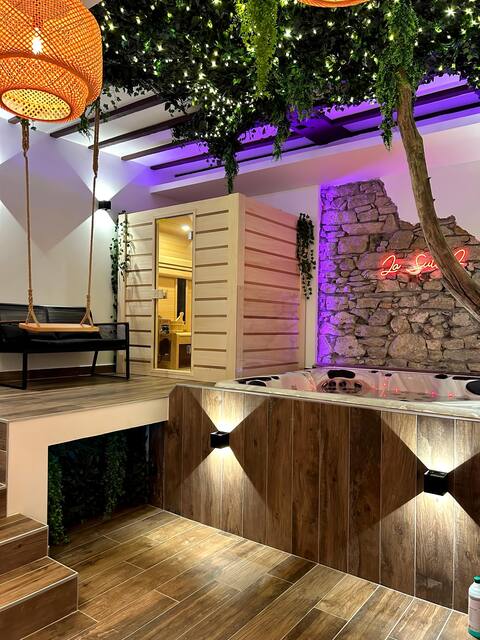
La Suite 2 Grenoble
Entire Place • 1 bedroom
Note: Performance varies based on location, size, amenities, seasonality, and management quality. Data reflects the past 12 months.
Top Performing Airbnb Hosts in Grenoble (2025)
Learn from the best! This table showcases top-performing Airbnb hosts in Grenoble based on the number of properties managed and estimated total revenue over the past year. Analyze their scale and performance metrics.
| Host Name | Properties | Grossing Revenue | Stay Reviews | Avg Rating |
|---|---|---|---|---|
| Clément | 45 | $738,175 | 9131 | 4.56/5.0 |
| Gooddays | 55 | $634,106 | 2949 | 4.59/5.0 |
| Golden Gestion | 36 | $412,434 | 1113 | 4.67/5.0 |
| Majordome Privé | 56 | $394,164 | 1140 | 3.84/5.0 |
| Michael | 38 | $351,194 | 650 | 4.20/5.0 |
| Capsule Corp | 23 | $268,736 | 918 | 4.10/5.0 |
| Simon | 16 | $231,209 | 964 | 4.84/5.0 |
| Sebastien | 23 | $160,932 | 1262 | 3.85/5.0 |
| Gcb | 8 | $158,402 | 99 | 4.71/5.0 |
| Benjamin | 16 | $157,695 | 791 | 4.35/5.0 |
Analyzing the strategies of top hosts, such as their property selection, pricing, and guest communication, can offer valuable lessons for optimizing your own Airbnb operations in Grenoble.
Dive Deeper: Advanced Grenoble STR Market Data (2025)
Ready to unlock more insights? AirROI provides access to advanced metrics and comprehensive Airbnb data for Grenoble. Explore detailed analytics beyond this report to refine your investment strategy, optimize pricing, and maximize your vacation rental profits.
Explore Advanced MetricsGrenoble Short-Term Rental Market Composition (2025): Property & Room Types
Room Type Distribution
Property Type Distribution
Market Composition Insights for Grenoble
- The Grenoble Airbnb market composition is heavily skewed towards Entire Home/Apt listings, which make up 84.2% of the 1,288 active rentals. This indicates strong guest preference for privacy and space.
- Looking at the property type distribution in Grenoble, Apartment/Condo properties are the most common (94.6%), reflecting the local real estate landscape.
- Smaller segments like house, hotel/boutique, others (combined 5.5%) offer potential for unique stay experiences.
Grenoble Airbnb Room Capacity Analysis (2025): Bedroom Distribution
Distribution of Listings by Number of Bedrooms
Room Capacity Insights for Grenoble
- The dominant room capacity in Grenoble is 1 bedroom listings, making up 49.4% of the market. This suggests a strong demand for properties suitable for couples or solo travelers.
- Together, 1 bedroom and 2 bedrooms properties represent 65.2% of the active Airbnb listings in Grenoble, indicating a high concentration in these sizes.
- Listings with 3+ bedrooms (9.4%) represent a smaller niche, potentially indicating an underserved market for larger group accommodations in Grenoble.
Grenoble Vacation Rental Guest Capacity Trends (2025)
Distribution of Listings by Guest Capacity
Guest Capacity Insights for Grenoble
- The most common guest capacity trend in Grenoble vacation rentals is listings accommodating 2 guests (36.3%). This suggests the primary traveler segment is likely couples or solo travelers.
- Properties designed for 2 guests and 4 guests dominate the Grenoble STR market, accounting for 60.6% of listings.
- A significant 40.2% of listings cater specifically to 1-2 guests, highlighting strong demand from couples and solo travelers in Grenoble.
- 13.9% of properties accommodate 6+ guests, serving the market segment for larger families or group travel in Grenoble.
- On average, properties in Grenoble are equipped to host 3.0 guests.
Grenoble Airbnb Booking Patterns (2025): Available vs. Booked Days
Available Days Distribution
Booked Days Distribution
Booking Pattern Insights for Grenoble
- The most common availability pattern in Grenoble falls within the 271-366 days range, representing 35.9% of listings. This suggests many properties have significant open periods on their calendars.
- Approximately 64.3% of listings show high availability (181+ days open annually), indicating potential for increased bookings or specific owner usage patterns.
- For booked days, the 91-180 days range is most frequent in Grenoble (28%), reflecting common guest stay durations or potential owner blocking patterns.
- A notable 36.8% of properties secure long booking periods (181+ days booked per year), highlighting successful long-term rental strategies or significant owner usage.
Grenoble Airbnb Minimum Stay Requirements Analysis
Distribution of Listings by Minimum Night Requirement
1 Night
412 listings
35.8% of total
2 Nights
357 listings
31% of total
3 Nights
100 listings
8.7% of total
4-6 Nights
104 listings
9% of total
7-29 Nights
42 listings
3.6% of total
30+ Nights
136 listings
11.8% of total
Key Insights
- The most prevalent minimum stay requirement in Grenoble is 1 Night, adopted by 35.8% of listings. This highlights the market's preference for shorter, flexible bookings.
- A strong majority (66.8%) of the Grenoble Airbnb data shows acceptance of very short stays (1-2 nights), indicating a dynamic, high-turnover market.
- A significant segment (11.8%) caters to monthly stays (30+ nights) in Grenoble, pointing to opportunities in the extended-stay market.
Recommendations
- Align with the market by considering a 1 Night minimum stay, as 35.8% of Grenoble hosts use this setting.
- Explore offering discounts for stays of 30+ nights to attract the 11.8% of the market seeking extended stays.
- Adjust minimum nights based on seasonality – potentially shorter during low season and longer during peak demand periods in Grenoble.
Grenoble Airbnb Cancellation Policy Trends Analysis (2025)
Super Strict 30 Days
6 listings
0.6% of total
Super Strict 60 Days
8 listings
0.7% of total
Flexible
394 listings
36.4% of total
Moderate
474 listings
43.8% of total
Firm
67 listings
6.2% of total
Strict
133 listings
12.3% of total
Cancellation Policy Insights for Grenoble
- The prevailing Airbnb cancellation policy trend in Grenoble is Moderate, used by 43.8% of listings.
- The market strongly favors guest-friendly terms, with 80.2% of listings offering Flexible or Moderate policies. This suggests guests in Grenoble may expect booking flexibility.
Recommendations for Hosts
- Consider adopting a Moderate policy to align with the 43.8% market standard in Grenoble.
- Using a Strict policy might deter some guests, as only 12.3% of listings use it. Evaluate if potential revenue protection outweighs possible lower booking rates.
- Regularly review your cancellation policy against competitors and market demand shifts in Grenoble.
Grenoble STR Booking Lead Time Analysis (2025)
Average Booking Lead Time by Month
Booking Lead Time Insights for Grenoble
- The overall average booking lead time for vacation rentals in Grenoble is 32 days.
- Guests book furthest in advance for stays during July (average 44 days), likely coinciding with peak travel demand or local events.
- The shortest booking windows occur for stays in February (average 28 days), indicating more last-minute travel plans during this time.
- Seasonally, Summer (40 days avg.) sees the longest lead times, while Winter (30 days avg.) has the shortest, reflecting typical travel planning cycles.
Recommendations for Hosts
- Use the overall average lead time (32 days) as a baseline for your pricing and availability strategy in Grenoble.
- For July stays, consider implementing length-of-stay discounts or slightly higher rates for bookings made less than 44 days out to capitalize on advance planning.
- Target marketing efforts for the Summer season well in advance (at least 40 days) to capture early planners.
- Monitor your own booking lead times against these Grenoble averages to identify opportunities for dynamic pricing adjustments.
Popular & Essential Airbnb Amenities in Grenoble (2025)
Amenity Prevalence
Amenity Insights for Grenoble
- Essential amenities in Grenoble that guests expect include: Heating, Kitchen, Wifi. Lacking these (any) could significantly impact bookings.
- Popular amenities like Hot water, Smoke alarm, Essentials are common but not universal. Offering these can provide a competitive edge.
Recommendations for Hosts
- Ensure your listing includes all essential amenities for Grenoble: Heating, Kitchen, Wifi.
- Prioritize adding missing essentials: Heating, Kitchen, Wifi.
- Consider adding popular differentiators like Hot water or Smoke alarm to increase appeal.
- Highlight unique or less common amenities you offer (e.g., hot tub, dedicated workspace, EV charger) in your listing description and photos.
- Regularly check competitor amenities in Grenoble to stay competitive.
Grenoble Airbnb Guest Demographics & Profile Analysis (2025)
Guest Profile Summary for Grenoble
- The typical guest profile for Airbnb in Grenoble consists of primarily domestic travelers (71%), often arriving from nearby Paris, typically belonging to the Post-2000s (Gen Z/Alpha) group (50%), primarily speaking French or English.
- Domestic travelers account for 71.1% of guests.
- Key international markets include France (71.1%) and Germany (3.5%).
- Top languages spoken are French (36.9%) followed by English (33.5%).
- A significant demographic segment is the Post-2000s (Gen Z/Alpha) group, representing 50% of guests.
Recommendations for Hosts
- Target domestic marketing efforts towards travelers from Paris and Lyon.
- Tailor amenities and listing descriptions to appeal to the dominant Post-2000s (Gen Z/Alpha) demographic (e.g., highlight fast WiFi, smart home features, local guides).
- Highlight unique local experiences or amenities relevant to the primary guest profile.
- Consider seasonal promotions aligned with peak travel times for key origin markets.
Nearby Short-Term Rental Market Comparison
How does the Grenoble Airbnb market stack up against its neighbors? Compare key performance metrics like average monthly revenue, ADR, and occupancy rates in surrounding areas to understand the broader regional STR landscape.
| Market | Active Properties | Monthly Revenue | Daily Rate | Avg. Occupancy |
|---|---|---|---|---|
| La Rivière-Enverse | 17 | $5,972 | $624.02 | 41% |
| Les Clefs | 30 | $5,741 | $323.11 | 44% |
| Épinac | 14 | $5,147 | $333.01 | 37% |
| Manigod | 194 | $4,127 | $427.80 | 40% |
| Divajeu | 19 | $3,941 | $410.65 | 42% |
| Saint-Germain-au-Mont-d'Or | 10 | $3,928 | $316.02 | 40% |
| Puligny-Montrachet | 11 | $3,908 | $398.00 | 44% |
| Dommartin | 11 | $3,905 | $327.00 | 36% |
| Saint-Nicolas-la-Chapelle | 27 | $3,381 | $375.70 | 43% |
| Juliénas | 11 | $3,378 | $292.32 | 46% |