Gras Airbnb Market Analysis 2025: Short Term Rental Data & Vacation Rental Statistics in Auvergne-Rhône-Alpes, France
Is Airbnb profitable in Gras in 2025? Explore comprehensive Airbnb analytics for Gras, Auvergne-Rhône-Alpes, France to uncover income potential. This 2025 STR market report for Gras, based on AirROI data from April 2024 to March 2025, reveals key trends in the niche market of 18 active listings.
Whether you're considering an Airbnb investment in Gras, optimizing your existing vacation rental, or exploring rental arbitrage opportunities, understanding the Gras Airbnb data is crucial. Understanding the local regulations is key to maximizing your short term rental income potential. Let's dive into the specifics.
Key Gras Airbnb Performance Metrics Overview
Monthly Airbnb Revenue Variations & Income Potential in Gras (2025)
Understanding the monthly revenue variations for Airbnb listings in Gras is key to maximizing your short term rental income potential. Seasonality significantly impacts earnings. Our analysis, based on data from the past 12 months, shows that the peak revenue month for STRs in Gras is typically August, while November often presents the lowest earnings, highlighting opportunities for strategic pricing adjustments during shoulder and low seasons. Explore the typical Airbnb income in Gras across different performance tiers:
- Best-in-class properties (Top 10%) achieve $4,408+ monthly, often utilizing dynamic pricing and superior guest experiences.
- Strong performing properties (Top 25%) earn $3,172 or more, indicating effective management and desirable locations/amenities.
- Typical properties (Median) generate around $1,350 per month, representing the average market performance.
- Entry-level properties (Bottom 25%) see earnings around $735, often with potential for optimization.
Average Monthly Airbnb Earnings Trend in Gras
Gras Airbnb Occupancy Rate Trends (2025)
Maximize your bookings by understanding the Gras STR occupancy trends. Seasonal demand shifts significantly influence how often properties are booked. Typically, Augustsees the highest demand (peak season occupancy), while October experiences the lowest (low season). Effective strategies, like adjusting minimum stays or offering promotions, can boost occupancy during slower periods. Here's how different property tiers perform in Gras:
- Best-in-class properties (Top 10%) achieve 58%+ occupancy, indicating high desirability and potentially optimized availability.
- Strong performing properties (Top 25%) maintain 42% or higher occupancy, suggesting good market fit and guest satisfaction.
- Typical properties (Median) have an occupancy rate around 31%.
- Entry-level properties (Bottom 25%) average 15% occupancy, potentially facing higher vacancy.
Average Monthly Occupancy Rate Trend in Gras
Average Daily Rate (ADR) Airbnb Trends in Gras (2025)
Effective short term rental pricing strategy in Gras involves understanding monthly ADR fluctuations. The Average Daily Rate (ADR) for Airbnb in Gras typically peaks in February and dips lowest during April. Leveraging Airbnb dynamic pricing tools or strategies based on this seasonality can significantly boost revenue. Here's a look at the typical nightly rates achieved:
- Best-in-class properties (Top 10%) command rates of $359+ per night, often due to premium features or locations.
- Strong performing properties (Top 25%) achieve nightly rates of $239 or more.
- Typical properties (Median) charge around $139 per night.
- Entry-level properties (Bottom 25%) earn around $94 per night.
Average Daily Rate (ADR) Trend by Month in Gras
Get Live Gras Market Intelligence 👇

Explore Real-time Analytics
Airbnb Seasonality Analysis & Trends in Gras (2025)
Peak Season (August, July, April)
- Revenue averages $3,709 per month
- Occupancy rates average 55.0%
- Daily rates average $185
Shoulder Season
- Revenue averages $1,846 per month
- Occupancy maintains around 28.1%
- Daily rates hold near $189
Low Season (January, October, November)
- Revenue drops to average $876 per month
- Occupancy decreases to average 17.9%
- Daily rates adjust to average $187
Seasonality Insights for Gras
- The Airbnb seasonality in Gras shows highly seasonal trends requiring careful strategy. While the sections above show seasonal averages, it's also insightful to look at the extremes:
- During the high season, the absolute peak month showcases Gras's highest earning potential, with monthly revenues capable of climbing to $4,524, occupancy reaching a high of 71.4%, and ADRs peaking at $201.
- Conversely, the slowest single month of the year, typically falling within the low season, marks the market's lowest point. In this month, revenue might dip to $661, occupancy could drop to 16.1%, and ADRs may adjust down to $178.
- Understanding both the seasonal averages and these monthly peaks and troughs in revenue, occupancy, and ADR is crucial for maximizing your Airbnb profit potential in Gras.
Seasonal Strategies for Maximizing Profit
- Peak Season: Maximize revenue through premium pricing and potentially longer minimum stays. Ensure high availability.
- Low Season: Offer competitive pricing, special promotions (e.g., extended stay discounts), and flexible cancellation policies. Target off-season travelers like remote workers or budget-conscious guests.
- Shoulder Seasons: Implement dynamic pricing that balances peak and low rates. Target weekend travelers or specific events. Offer slightly more flexible terms than peak season.
- Regularly analyze your own performance against these Gras seasonality benchmarks and adjust your pricing and availability strategy accordingly.
Best Areas for Airbnb Investment in Gras (2025)
Exploring the top neighborhoods for short-term rentals in Gras? This section highlights key areas, outlining why they are attractive for hosts and guests, along with notable local attractions. Consider these locations based on your target guest profile and investment strategy.
| Neighborhood / Area | Why Host Here? (Target Guests & Appeal) | Key Attractions & Landmarks |
|---|---|---|
| Vichiomonte | A serene village that's a perfect getaway spot for nature lovers and hikers. The calm atmosphere and scenic views draw tourists looking to escape the city. | Château de Vichy, Lac des Sapins, Parc Thermal, Les Célestins Spa, Montagne Bourbonnaise |
| Clermont-Ferrand | The capital of the Auvergne region known for its rich history and culture. A vibrant city that offers a blend of urban life with beautiful natural surroundings. | Puy de Dôme, Clermont-Ferrand Cathedral, Place de Jaude, Aventure Michelin, Basilique Notre-Dame-du-Port |
| Châtel-Guyon | A spa town renowned for its thermal springs, attracting visitors for relaxation and wellness retreats. Ideal for health-conscious tourists seeking rejuvenation. | Thermes de Châtel-Guyon, Parc thermal, Casino de Châtel-Guyon, Les Monts Dore |
| Issoire | A charming town with historical significance, famous for its Romanesque church and beautiful landscape. Great for tourists interested in history and culture. | Église Saint-Paul d'Issoire, Château d'Issoire, Gorges de la Sioule, Vélorail des Gorges de la Sioule |
| Le Mont-Dore | A stunning location known for skiing in winter and hiking in summer, popular with adventure seekers and outdoor enthusiasts. | Puy de Sancy, Mont-Dore ski resort, Lac de Guéry, Station de ski du Mont-Dore |
| Saint-Flour | A historical town perched on a volcanic plateau, offering medieval architecture and stunning views. Attracts history buffs and nature lovers alike. | Cathedrale Saint-Pierre, Château de Saint-Flour, Viaduc de Garabit, Parc Naturel Régional de l'Aubrac |
| Aurillac | The capital of Cantal department known for its festivals and cultural events. Ideal for tourists looking to experience local culture and gastronomy. | Place du Square, Château Saint-Étienne, Musee des Volcans, Vallee de la Jordanne |
| Salers | A picturesque medieval village known for its cheese and stunning architecture, attracting tourists seeking authentic French rural experiences. | Salers cheese, Place de l'Eglise, Château de Salers, La Maison de la Salers |
Understanding Airbnb License Requirements & STR Laws in Gras (2025)
With 11% of listings showing registration in 2025, understanding potential Airbnb license requirements is crucial in Gras. Always verify the latest short term rental regulations and Airbnb license requirements directly with local government authorities for Gras to ensure full compliance before hosting.
(Source: AirROI data, 2025, based on 11% licensed listings)
Top Performing Airbnb Properties in Gras (2025)
Benchmark your potential! Explore examples of top-performing Airbnb properties in Grasbased on Trailing Twelve Month (TTM) revenue. Analyze their characteristics, revenue, occupancy rate, and ADR to understand what drives success in this market.
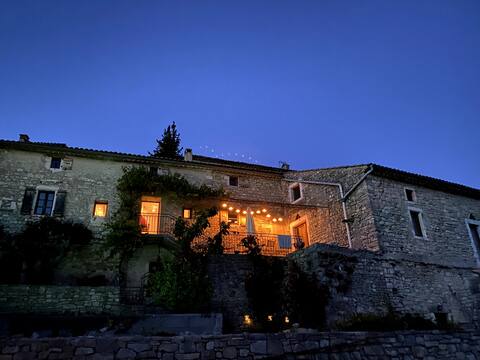
Large traditional Ardèche farmhouse with swimming pool
Entire Place • 3 bedrooms
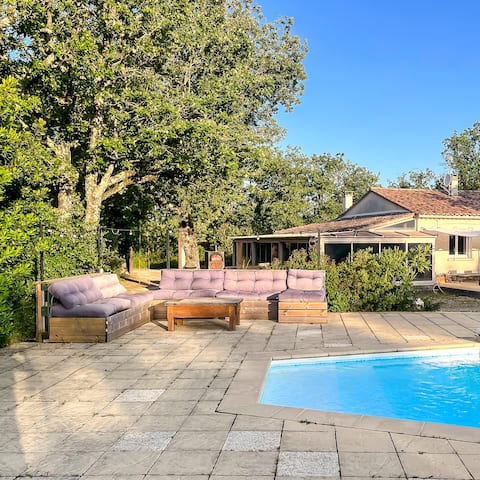
A pretty slice of heaven
Entire Place • 6 bedrooms
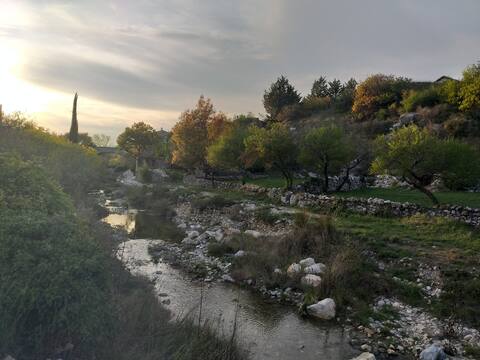
Mas du Gua "la Grande Maison de Vacances"
Entire Place • 4 bedrooms
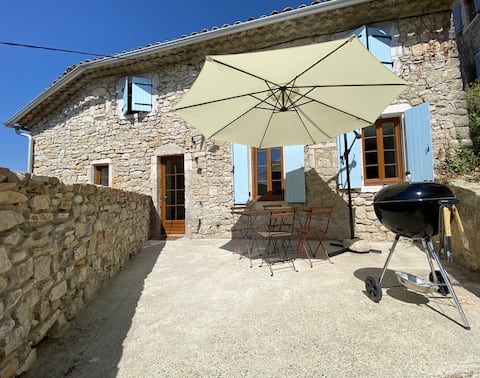
Stone farmhouse with pool and terraces, Callune
Entire Place • 2 bedrooms

Laulagner - Cocon in nature with pool
Entire Place • 1 bedroom

Mas du Gua "La Maison de Vacances"
Entire Place • 3 bedrooms
Note: Performance varies based on location, size, amenities, seasonality, and management quality. Data reflects the past 12 months.
Top Performing Airbnb Hosts in Gras (2025)
Learn from the best! This table showcases top-performing Airbnb hosts in Gras based on the number of properties managed and estimated total revenue over the past year. Analyze their scale and performance metrics.
| Host Name | Properties | Grossing Revenue | Stay Reviews | Avg Rating |
|---|---|---|---|---|
| Eric | 3 | $89,181 | 24 | 3.19/5.0 |
| Eve | 3 | $64,655 | 194 | 4.85/5.0 |
| Antoine | 3 | $50,235 | 48 | 4.93/5.0 |
| Magali | 1 | $49,968 | 18 | 4.72/5.0 |
| Catherine | 3 | $21,438 | 46 | 4.90/5.0 |
| Host #60864265 | 1 | $19,314 | 0 | 0.00/5.0 |
| Cathy | 1 | $13,993 | 96 | 4.98/5.0 |
| Claude | 1 | $13,577 | 4 | 4.75/5.0 |
| Marie Béatrice Bérangère | 1 | $4,674 | 32 | 4.84/5.0 |
| Martine | 1 | $3,083 | 81 | 4.93/5.0 |
Analyzing the strategies of top hosts, such as their property selection, pricing, and guest communication, can offer valuable lessons for optimizing your own Airbnb operations in Gras.
Dive Deeper: Advanced Gras STR Market Data (2025)
Ready to unlock more insights? AirROI provides access to advanced metrics and comprehensive Airbnb data for Gras. Explore detailed analytics beyond this report to refine your investment strategy, optimize pricing, and maximize your vacation rental profits.
Explore Advanced MetricsGras Short-Term Rental Market Composition (2025): Property & Room Types
Room Type Distribution
Property Type Distribution
Market Composition Insights for Gras
- The Gras Airbnb market composition is heavily skewed towards Entire Home/Apt listings, which make up 88.9% of the 18 active rentals. This indicates strong guest preference for privacy and space.
- Looking at the property type distribution in Gras, House properties are the most common (72.2%), reflecting the local real estate landscape.
- Houses represent a significant 72.2% portion, catering likely to families or larger groups.
- The presence of 11.1% Hotel/Boutique listings indicates integration with traditional hospitality.
Gras Airbnb Room Capacity Analysis (2025): Bedroom Distribution
Distribution of Listings by Number of Bedrooms
Room Capacity Insights for Gras
- The dominant room capacity in Gras is 1 bedroom listings, making up 22.2% of the market. This suggests a strong demand for properties suitable for couples or solo travelers.
- Together, 1 bedroom and 2 bedrooms properties represent 44.4% of the active Airbnb listings in Gras, indicating a high concentration in these sizes.
- A significant 44.5% of listings offer 3+ bedrooms, catering to larger groups and families seeking more space in Gras.
Gras Vacation Rental Guest Capacity Trends (2025)
Distribution of Listings by Guest Capacity
Guest Capacity Insights for Gras
- The most common guest capacity trend in Gras vacation rentals is listings accommodating 8+ guests (44.4%). This suggests the primary traveler segment is likely larger groups.
- Properties designed for 8+ guests and 2 guests dominate the Gras STR market, accounting for 55.5% of listings.
- 55.5% of properties accommodate 6+ guests, serving the market segment for larger families or group travel in Gras.
- On average, properties in Gras are equipped to host 5.4 guests.
Gras Airbnb Booking Patterns (2025): Available vs. Booked Days
Available Days Distribution
Booked Days Distribution
Booking Pattern Insights for Gras
- The most common availability pattern in Gras falls within the 271-366 days range, representing 50% of listings. This suggests many properties have significant open periods on their calendars.
- Approximately 83.3% of listings show high availability (181+ days open annually), indicating potential for increased bookings or specific owner usage patterns.
- For booked days, the 31-90 days range is most frequent in Gras (33.3%), reflecting common guest stay durations or potential owner blocking patterns.
- A notable 16.7% of properties secure long booking periods (181+ days booked per year), highlighting successful long-term rental strategies or significant owner usage.
Gras Airbnb Minimum Stay Requirements Analysis
Distribution of Listings by Minimum Night Requirement
1 Night
4 listings
22.2% of total
2 Nights
6 listings
33.3% of total
3 Nights
4 listings
22.2% of total
4-6 Nights
1 listings
5.6% of total
7-29 Nights
1 listings
5.6% of total
30+ Nights
2 listings
11.1% of total
Key Insights
- The most prevalent minimum stay requirement in Gras is 2 Nights, adopted by 33.3% of listings. This highlights the market's preference for shorter, flexible bookings.
- A significant segment (11.1%) caters to monthly stays (30+ nights) in Gras, pointing to opportunities in the extended-stay market.
Recommendations
- Align with the market by considering a 2 Nights minimum stay, as 33.3% of Gras hosts use this setting.
- If feasible, allowing 1-night stays, especially midweek or during low season, could capture last-minute bookings, as only 22.2% currently do.
- Explore offering discounts for stays of 30+ nights to attract the 11.1% of the market seeking extended stays.
- Adjust minimum nights based on seasonality – potentially shorter during low season and longer during peak demand periods in Gras.
Gras Airbnb Cancellation Policy Trends Analysis (2025)
Flexible
4 listings
25% of total
Moderate
3 listings
18.8% of total
Firm
3 listings
18.8% of total
Strict
6 listings
37.5% of total
Cancellation Policy Insights for Gras
- The prevailing Airbnb cancellation policy trend in Gras is Strict, used by 37.5% of listings.
- A majority (56.3%) of hosts in Gras utilize Firm or Strict policies, indicating a market where hosts prioritize booking security.
Recommendations for Hosts
- Consider adopting a Strict policy to align with the 37.5% market standard in Gras.
- With 37.5% using Strict terms, this is a viable option in Gras, particularly for high-value properties or during peak demand periods.
- Regularly review your cancellation policy against competitors and market demand shifts in Gras.
Gras STR Booking Lead Time Analysis (2025)
Average Booking Lead Time by Month
Booking Lead Time Insights for Gras
- The overall average booking lead time for vacation rentals in Gras is 77 days.
- Guests book furthest in advance for stays during June (average 140 days), likely coinciding with peak travel demand or local events.
- The shortest booking windows occur for stays in October (average 36 days), indicating more last-minute travel plans during this time.
- Seasonally, Summer (139 days avg.) sees the longest lead times, while Winter (52 days avg.) has the shortest, reflecting typical travel planning cycles.
Recommendations for Hosts
- Use the overall average lead time (77 days) as a baseline for your pricing and availability strategy in Gras.
- For June stays, consider implementing length-of-stay discounts or slightly higher rates for bookings made less than 140 days out to capitalize on advance planning.
- Target marketing efforts for the Summer season well in advance (at least 139 days) to capture early planners.
- Monitor your own booking lead times against these Gras averages to identify opportunities for dynamic pricing adjustments.
Popular & Essential Airbnb Amenities in Gras (2025)
Amenity Prevalence
Amenity Insights for Gras
- Essential amenities in Gras that guests expect include: Heating, Wifi. Lacking these (any) could significantly impact bookings.
- Popular amenities like Outdoor furniture, Hot water, Washer are common but not universal. Offering these can provide a competitive edge.
Recommendations for Hosts
- Ensure your listing includes all essential amenities for Gras: Heating, Wifi.
- Consider adding popular differentiators like Outdoor furniture or Hot water to increase appeal.
- Highlight unique or less common amenities you offer (e.g., hot tub, dedicated workspace, EV charger) in your listing description and photos.
- Regularly check competitor amenities in Gras to stay competitive.
Gras Airbnb Guest Demographics & Profile Analysis (2025)
Guest Profile Summary for Gras
- The typical guest profile for Airbnb in Gras consists of primarily domestic travelers (81%), often arriving from nearby Lyon, typically belonging to the Post-2000s (Gen Z/Alpha) group (50%), primarily speaking French or English.
- Domestic travelers account for 81.3% of guests.
- Key international markets include France (81.3%) and Germany (6.3%).
- Top languages spoken are French (40%) followed by English (37.1%).
- A significant demographic segment is the Post-2000s (Gen Z/Alpha) group, representing 50% of guests.
Recommendations for Hosts
- Target domestic marketing efforts towards travelers from Lyon and Leuven.
- Tailor amenities and listing descriptions to appeal to the dominant Post-2000s (Gen Z/Alpha) demographic (e.g., highlight fast WiFi, smart home features, local guides).
- Highlight unique local experiences or amenities relevant to the primary guest profile.
- Consider seasonal promotions aligned with peak travel times for key origin markets.
Nearby Short-Term Rental Market Comparison
How does the Gras Airbnb market stack up against its neighbors? Compare key performance metrics like average monthly revenue, ADR, and occupancy rates in surrounding areas to understand the broader regional STR landscape.
| Market | Active Properties | Monthly Revenue | Daily Rate | Avg. Occupancy |
|---|---|---|---|---|
| Villeneuvette | 13 | $4,150 | $337.56 | 44% |
| Divajeu | 19 | $3,941 | $410.65 | 42% |
| Saint-Germain-au-Mont-d'Or | 10 | $3,928 | $316.02 | 40% |
| Dommartin | 11 | $3,905 | $327.00 | 36% |
| Courzieu | 11 | $3,267 | $287.83 | 52% |
| Vanosc | 13 | $3,072 | $224.52 | 44% |
| Chantepérier | 20 | $3,057 | $281.60 | 37% |
| Gordes | 225 | $2,913 | $366.32 | 43% |
| Redessan | 19 | $2,834 | $334.82 | 34% |
| Fontarèches | 11 | $2,802 | $525.31 | 34% |