Dardilly Airbnb Market Analysis 2025: Short Term Rental Data & Vacation Rental Statistics in Auvergne-Rhône-Alpes, France
Is Airbnb profitable in Dardilly in 2025? Explore comprehensive Airbnb analytics for Dardilly, Auvergne-Rhône-Alpes, France to uncover income potential. This 2025 STR market report for Dardilly, based on AirROI data from April 2024 to March 2025, reveals key trends in the niche market of 46 active listings.
Whether you're considering an Airbnb investment in Dardilly, optimizing your existing vacation rental, or exploring rental arbitrage opportunities, understanding the Dardilly Airbnb data is crucial. Leveraging the low regulation environment is key to maximizing your short term rental income potential. Let's dive into the specifics.
Key Dardilly Airbnb Performance Metrics Overview
Monthly Airbnb Revenue Variations & Income Potential in Dardilly (2025)
Understanding the monthly revenue variations for Airbnb listings in Dardilly is key to maximizing your short term rental income potential. Seasonality significantly impacts earnings. Our analysis, based on data from the past 12 months, shows that the peak revenue month for STRs in Dardilly is typically July, while February often presents the lowest earnings, highlighting opportunities for strategic pricing adjustments during shoulder and low seasons. Explore the typical Airbnb income in Dardilly across different performance tiers:
- Best-in-class properties (Top 10%) achieve $3,415+ monthly, often utilizing dynamic pricing and superior guest experiences.
- Strong performing properties (Top 25%) earn $1,718 or more, indicating effective management and desirable locations/amenities.
- Typical properties (Median) generate around $937 per month, representing the average market performance.
- Entry-level properties (Bottom 25%) see earnings around $326, often with potential for optimization.
Average Monthly Airbnb Earnings Trend in Dardilly
Dardilly Airbnb Occupancy Rate Trends (2025)
Maximize your bookings by understanding the Dardilly STR occupancy trends. Seasonal demand shifts significantly influence how often properties are booked. Typically, Julysees the highest demand (peak season occupancy), while January experiences the lowest (low season). Effective strategies, like adjusting minimum stays or offering promotions, can boost occupancy during slower periods. Here's how different property tiers perform in Dardilly:
- Best-in-class properties (Top 10%) achieve 78%+ occupancy, indicating high desirability and potentially optimized availability.
- Strong performing properties (Top 25%) maintain 56% or higher occupancy, suggesting good market fit and guest satisfaction.
- Typical properties (Median) have an occupancy rate around 31%.
- Entry-level properties (Bottom 25%) average 11% occupancy, potentially facing higher vacancy.
Average Monthly Occupancy Rate Trend in Dardilly
Average Daily Rate (ADR) Airbnb Trends in Dardilly (2025)
Effective short term rental pricing strategy in Dardilly involves understanding monthly ADR fluctuations. The Average Daily Rate (ADR) for Airbnb in Dardilly typically peaks in April and dips lowest during February. Leveraging Airbnb dynamic pricing tools or strategies based on this seasonality can significantly boost revenue. Here's a look at the typical nightly rates achieved:
- Best-in-class properties (Top 10%) command rates of $270+ per night, often due to premium features or locations.
- Strong performing properties (Top 25%) achieve nightly rates of $123 or more.
- Typical properties (Median) charge around $78 per night.
- Entry-level properties (Bottom 25%) earn around $58 per night.
Average Daily Rate (ADR) Trend by Month in Dardilly
Get Live Dardilly Market Intelligence 👇

Explore Real-time Analytics
Airbnb Seasonality Analysis & Trends in Dardilly (2025)
Peak Season (July, May, June)
- Revenue averages $2,173 per month
- Occupancy rates average 40.7%
- Daily rates average $145
Shoulder Season
- Revenue averages $1,363 per month
- Occupancy maintains around 36.0%
- Daily rates hold near $139
Low Season (January, February, November)
- Revenue drops to average $799 per month
- Occupancy decreases to average 32.8%
- Daily rates adjust to average $128
Seasonality Insights for Dardilly
- The Airbnb seasonality in Dardilly shows highly seasonal trends requiring careful strategy. While the sections above show seasonal averages, it's also insightful to look at the extremes:
- During the high season, the absolute peak month showcases Dardilly's highest earning potential, with monthly revenues capable of climbing to $2,434, occupancy reaching a high of 46.2%, and ADRs peaking at $147.
- Conversely, the slowest single month of the year, typically falling within the low season, marks the market's lowest point. In this month, revenue might dip to $737, occupancy could drop to 30.0%, and ADRs may adjust down to $126.
- Understanding both the seasonal averages and these monthly peaks and troughs in revenue, occupancy, and ADR is crucial for maximizing your Airbnb profit potential in Dardilly.
Seasonal Strategies for Maximizing Profit
- Peak Season: Maximize revenue through premium pricing and potentially longer minimum stays. Ensure high availability.
- Low Season: Offer competitive pricing, special promotions (e.g., extended stay discounts), and flexible cancellation policies. Target off-season travelers like remote workers or budget-conscious guests.
- Shoulder Seasons: Implement dynamic pricing that balances peak and low rates. Target weekend travelers or specific events. Offer slightly more flexible terms than peak season.
- Regularly analyze your own performance against these Dardilly seasonality benchmarks and adjust your pricing and availability strategy accordingly.
Best Areas for Airbnb Investment in Dardilly (2025)
Exploring the top neighborhoods for short-term rentals in Dardilly? This section highlights key areas, outlining why they are attractive for hosts and guests, along with notable local attractions. Consider these locations based on your target guest profile and investment strategy.
| Neighborhood / Area | Why Host Here? (Target Guests & Appeal) | Key Attractions & Landmarks |
|---|---|---|
| Centre de Dardilly | The heart of Dardilly, offering easy access to local shops, restaurants, and parks. Ideal for families and business travelers. | Eglise de Dardilly, Parks and Green Spaces, Local Markets |
| La Tour de Salvagny | A picturesque suburb with a village-like atmosphere, attracting visitors looking for a quieter stay while still close to Lyon. | Golf de la Tour de Salvagny, Château de La Tour, Local Vineyards |
| Technosud | A business hub with proximity to many technology companies, attracting business travelers and professionals. | Nearby tech companies, Conference centers, Restaurants |
| Monts d'Or | Beautiful natural surroundings and hiking trails, perfect for outdoor enthusiasts looking to escape the city. | Monts d'Or Regional Park, Scenic Views, Hiking Trails |
| Tassin-la-Demi-Lune | A lively area with great transport links to Lyon, popular among families and tourists. | Tassin Town Hall, Mogio Park, Shopping Areas |
| Lyon City Centre | While technically not in Dardilly, it's very close and offers vibrant city life, culture, and dining, ideal for visitors. | Place Bellecour, Vieux Lyon, Lyon Cathedral, Museums |
| Château de Chassagny | Historic castle in a scenic setting, attracting tourists interested in history and culture. | Château de Chassagny, Surrounding gardens, Historical Tours |
| Historical Centre of Dardilly | Rich in history and local charm, often sought after by visitors wanting to experience local culture. | Old Mills, Local Festivals, Historical Buildings |
Understanding Airbnb License Requirements & STR Laws in Dardilly (2025)
While Dardilly, Auvergne-Rhône-Alpes, France currently shows low STR regulations, specific Airbnb license requirements might still exist or change. Always verify the latest short term rental regulations and Airbnb license requirements directly with local government authorities for Dardilly to ensure full compliance before hosting.
(Source: AirROI data, 2025, based on 4% licensed listings)
Top Performing Airbnb Properties in Dardilly (2025)
Benchmark your potential! Explore examples of top-performing Airbnb properties in Dardillybased on Trailing Twelve Month (TTM) revenue. Analyze their characteristics, revenue, occupancy rate, and ADR to understand what drives success in this market.
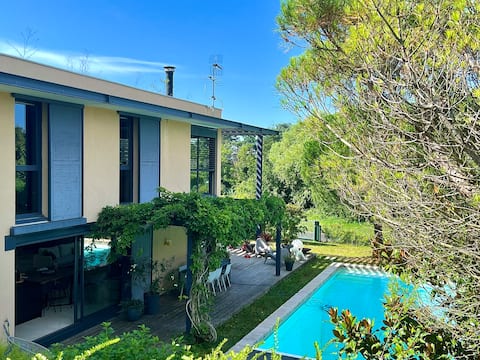
Beautiful contemporary villa
Entire Place • 3 bedrooms
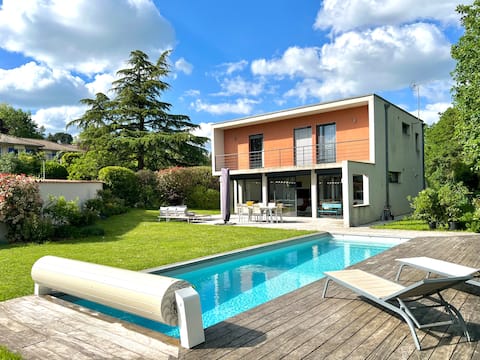
Villa La Praline
Entire Place • 3 bedrooms
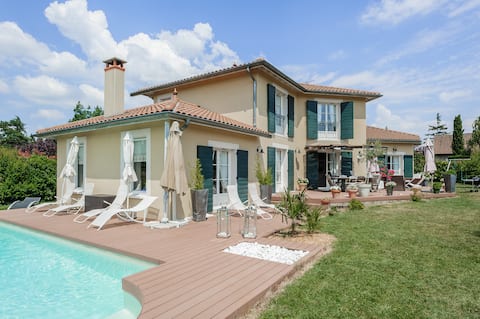
2150sq.ft Family House & Swmg Pool
Entire Place • 6 bedrooms
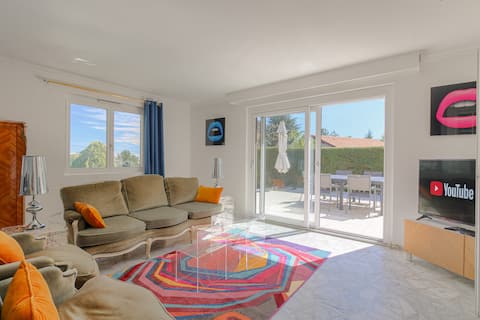
Spacious house with terrace and large garden
Entire Place • 3 bedrooms

56m2 apartment with quiet terrace & terminal
Entire Place • 1 bedroom
Exceptional house for rent in Dardilly
Entire Place • 4 bedrooms
Note: Performance varies based on location, size, amenities, seasonality, and management quality. Data reflects the past 12 months.
Top Performing Airbnb Hosts in Dardilly (2025)
Learn from the best! This table showcases top-performing Airbnb hosts in Dardilly based on the number of properties managed and estimated total revenue over the past year. Analyze their scale and performance metrics.
| Host Name | Properties | Grossing Revenue | Stay Reviews | Avg Rating |
|---|---|---|---|---|
| Jean-Philippe | 1 | $46,048 | 10 | 4.90/5.0 |
| Franck | 1 | $42,320 | 5 | 4.80/5.0 |
| Marjorie | 2 | $38,749 | 44 | 4.82/5.0 |
| CityKamp | 3 | $35,820 | 76 | 3.91/5.0 |
| Sabine | 2 | $34,038 | 286 | 4.95/5.0 |
| Mauricio | 1 | $27,329 | 15 | 4.40/5.0 |
| Anais Et Son Papa | 3 | $24,686 | 15 | 3.22/5.0 |
| Frédéric | 1 | $22,491 | 62 | 5.00/5.0 |
| Host #206354100 | 2 | $17,544 | 247 | 4.17/5.0 |
| Christelle | 1 | $17,431 | 18 | 4.78/5.0 |
Analyzing the strategies of top hosts, such as their property selection, pricing, and guest communication, can offer valuable lessons for optimizing your own Airbnb operations in Dardilly.
Dive Deeper: Advanced Dardilly STR Market Data (2025)
Ready to unlock more insights? AirROI provides access to advanced metrics and comprehensive Airbnb data for Dardilly. Explore detailed analytics beyond this report to refine your investment strategy, optimize pricing, and maximize your vacation rental profits.
Explore Advanced MetricsDardilly Short-Term Rental Market Composition (2025): Property & Room Types
Room Type Distribution
Property Type Distribution
Market Composition Insights for Dardilly
- The Dardilly Airbnb market composition is heavily skewed towards Entire Home/Apt listings, which make up 78.3% of the 46 active rentals. This indicates strong guest preference for privacy and space.
- Looking at the property type distribution in Dardilly, Apartment/Condo properties are the most common (56.5%), reflecting the local real estate landscape.
- Houses represent a significant 39.1% portion, catering likely to families or larger groups.
- Smaller segments like hotel/boutique (combined 4.3%) offer potential for unique stay experiences.
Dardilly Airbnb Room Capacity Analysis (2025): Bedroom Distribution
Distribution of Listings by Number of Bedrooms
Room Capacity Insights for Dardilly
- The dominant room capacity in Dardilly is 1 bedroom listings, making up 47.8% of the market. This suggests a strong demand for properties suitable for couples or solo travelers.
- Together, 1 bedroom and 2 bedrooms properties represent 58.7% of the active Airbnb listings in Dardilly, indicating a high concentration in these sizes.
Dardilly Vacation Rental Guest Capacity Trends (2025)
Distribution of Listings by Guest Capacity
Guest Capacity Insights for Dardilly
- The most common guest capacity trend in Dardilly vacation rentals is listings accommodating 2 guests (45.7%). This suggests the primary traveler segment is likely couples or solo travelers.
- Properties designed for 2 guests and 5 guests dominate the Dardilly STR market, accounting for 60.9% of listings.
- A significant 45.7% of listings cater specifically to 1-2 guests, highlighting strong demand from couples and solo travelers in Dardilly.
- 13.0% of properties accommodate 6+ guests, serving the market segment for larger families or group travel in Dardilly.
- On average, properties in Dardilly are equipped to host 3.0 guests.
Dardilly Airbnb Booking Patterns (2025): Available vs. Booked Days
Available Days Distribution
Booked Days Distribution
Booking Pattern Insights for Dardilly
- The most common availability pattern in Dardilly falls within the 271-366 days range, representing 58.7% of listings. This suggests many properties have significant open periods on their calendars.
- Approximately 89.1% of listings show high availability (181+ days open annually), indicating potential for increased bookings or specific owner usage patterns.
- For booked days, the 31-90 days range is most frequent in Dardilly (41.3%), reflecting common guest stay durations or potential owner blocking patterns.
- A notable 10.8% of properties secure long booking periods (181+ days booked per year), highlighting successful long-term rental strategies or significant owner usage.
Dardilly Airbnb Minimum Stay Requirements Analysis
Distribution of Listings by Minimum Night Requirement
1 Night
13 listings
31.7% of total
2 Nights
14 listings
34.1% of total
3 Nights
5 listings
12.2% of total
4-6 Nights
7 listings
17.1% of total
30+ Nights
2 listings
4.9% of total
Key Insights
- The most prevalent minimum stay requirement in Dardilly is 2 Nights, adopted by 34.1% of listings. This highlights the market's preference for shorter, flexible bookings.
- A strong majority (65.8%) of the Dardilly Airbnb data shows acceptance of very short stays (1-2 nights), indicating a dynamic, high-turnover market.
Recommendations
- Align with the market by considering a 2 Nights minimum stay, as 34.1% of Dardilly hosts use this setting.
- Adjust minimum nights based on seasonality – potentially shorter during low season and longer during peak demand periods in Dardilly.
Dardilly Airbnb Cancellation Policy Trends Analysis (2025)
Super Strict 60 Days
3 listings
7.5% of total
Flexible
11 listings
27.5% of total
Moderate
12 listings
30% of total
Firm
5 listings
12.5% of total
Strict
9 listings
22.5% of total
Cancellation Policy Insights for Dardilly
- The prevailing Airbnb cancellation policy trend in Dardilly is Moderate, used by 30% of listings.
- There's a relatively balanced mix between guest-friendly (57.5%) and stricter (35.0%) policies, offering choices for different guest needs.
Recommendations for Hosts
- Consider adopting a Moderate policy to align with the 30% market standard in Dardilly.
- Regularly review your cancellation policy against competitors and market demand shifts in Dardilly.
Dardilly STR Booking Lead Time Analysis (2025)
Average Booking Lead Time by Month
Booking Lead Time Insights for Dardilly
- The overall average booking lead time for vacation rentals in Dardilly is 41 days.
- Guests book furthest in advance for stays during May (average 73 days), likely coinciding with peak travel demand or local events.
- The shortest booking windows occur for stays in December (average 37 days), indicating more last-minute travel plans during this time.
- Seasonally, Spring (51 days avg.) sees the longest lead times, while Winter (45 days avg.) has the shortest, reflecting typical travel planning cycles.
Recommendations for Hosts
- Use the overall average lead time (41 days) as a baseline for your pricing and availability strategy in Dardilly.
- For May stays, consider implementing length-of-stay discounts or slightly higher rates for bookings made less than 73 days out to capitalize on advance planning.
- Target marketing efforts for the Spring season well in advance (at least 51 days) to capture early planners.
- Monitor your own booking lead times against these Dardilly averages to identify opportunities for dynamic pricing adjustments.
Popular & Essential Airbnb Amenities in Dardilly (2025)
Amenity Prevalence
Amenity Insights for Dardilly
- Essential amenities in Dardilly that guests expect include: Wifi. Lacking these (this) could significantly impact bookings.
- Popular amenities like Kitchen, Heating, Hot water are common but not universal. Offering these can provide a competitive edge.
Recommendations for Hosts
- Ensure your listing includes all essential amenities for Dardilly: Wifi.
- Consider adding popular differentiators like Kitchen or Heating to increase appeal.
- Highlight unique or less common amenities you offer (e.g., hot tub, dedicated workspace, EV charger) in your listing description and photos.
- Regularly check competitor amenities in Dardilly to stay competitive.
Dardilly Airbnb Guest Demographics & Profile Analysis (2025)
Guest Profile Summary for Dardilly
- The typical guest profile for Airbnb in Dardilly consists of primarily domestic travelers (87%), often arriving from nearby Lyon, typically belonging to the Post-2000s (Gen Z/Alpha) group (50%), primarily speaking French or English.
- Domestic travelers account for 87.1% of guests.
- Key international markets include France (87.1%) and Netherlands (3.2%).
- Top languages spoken are French (45.6%) followed by English (28.8%).
- A significant demographic segment is the Post-2000s (Gen Z/Alpha) group, representing 50% of guests.
Recommendations for Hosts
- Target domestic marketing efforts towards travelers from Lyon and Paris.
- Tailor amenities and listing descriptions to appeal to the dominant Post-2000s (Gen Z/Alpha) demographic (e.g., highlight fast WiFi, smart home features, local guides).
- Highlight unique local experiences or amenities relevant to the primary guest profile.
- Consider seasonal promotions aligned with peak travel times for key origin markets.
Nearby Short-Term Rental Market Comparison
How does the Dardilly Airbnb market stack up against its neighbors? Compare key performance metrics like average monthly revenue, ADR, and occupancy rates in surrounding areas to understand the broader regional STR landscape.
| Market | Active Properties | Monthly Revenue | Daily Rate | Avg. Occupancy |
|---|---|---|---|---|
| Épinac | 14 | $5,147 | $333.01 | 37% |
| Divajeu | 19 | $3,941 | $410.65 | 42% |
| Saint-Germain-au-Mont-d'Or | 10 | $3,928 | $316.02 | 40% |
| Puligny-Montrachet | 11 | $3,908 | $398.00 | 44% |
| Dommartin | 11 | $3,905 | $327.00 | 36% |
| Juliénas | 11 | $3,378 | $292.32 | 46% |
| Courzieu | 11 | $3,267 | $287.83 | 52% |
| Vanosc | 13 | $3,072 | $224.52 | 44% |
| Chantepérier | 20 | $3,057 | $281.60 | 37% |
| Bligny-lès-Beaune | 24 | $2,930 | $233.89 | 44% |