Cognin Airbnb Market Analysis 2025: Short Term Rental Data & Vacation Rental Statistics in Auvergne-Rhône-Alpes, France
Is Airbnb profitable in Cognin in 2025? Explore comprehensive Airbnb analytics for Cognin, Auvergne-Rhône-Alpes, France to uncover income potential. This 2025 STR market report for Cognin, based on AirROI data from April 2024 to March 2025, reveals key trends in the niche market of 20 active listings.
Whether you're considering an Airbnb investment in Cognin, optimizing your existing vacation rental, or exploring rental arbitrage opportunities, understanding the Cognin Airbnb data is crucial. Understanding the local regulations is key to maximizing your short term rental income potential. Let's dive into the specifics.
Key Cognin Airbnb Performance Metrics Overview
Monthly Airbnb Revenue Variations & Income Potential in Cognin (2025)
Understanding the monthly revenue variations for Airbnb listings in Cognin is key to maximizing your short term rental income potential. Seasonality significantly impacts earnings. Our analysis, based on data from the past 12 months, shows that the peak revenue month for STRs in Cognin is typically December, while March often presents the lowest earnings, highlighting opportunities for strategic pricing adjustments during shoulder and low seasons. Explore the typical Airbnb income in Cognin across different performance tiers:
- Best-in-class properties (Top 10%) achieve $2,410+ monthly, often utilizing dynamic pricing and superior guest experiences.
- Strong performing properties (Top 25%) earn $1,544 or more, indicating effective management and desirable locations/amenities.
- Typical properties (Median) generate around $864 per month, representing the average market performance.
- Entry-level properties (Bottom 25%) see earnings around $480, often with potential for optimization.
Average Monthly Airbnb Earnings Trend in Cognin
Cognin Airbnb Occupancy Rate Trends (2025)
Maximize your bookings by understanding the Cognin STR occupancy trends. Seasonal demand shifts significantly influence how often properties are booked. Typically, Decembersees the highest demand (peak season occupancy), while March experiences the lowest (low season). Effective strategies, like adjusting minimum stays or offering promotions, can boost occupancy during slower periods. Here's how different property tiers perform in Cognin:
- Best-in-class properties (Top 10%) achieve 82%+ occupancy, indicating high desirability and potentially optimized availability.
- Strong performing properties (Top 25%) maintain 67% or higher occupancy, suggesting good market fit and guest satisfaction.
- Typical properties (Median) have an occupancy rate around 48%.
- Entry-level properties (Bottom 25%) average 21% occupancy, potentially facing higher vacancy.
Average Monthly Occupancy Rate Trend in Cognin
Average Daily Rate (ADR) Airbnb Trends in Cognin (2025)
Effective short term rental pricing strategy in Cognin involves understanding monthly ADR fluctuations. The Average Daily Rate (ADR) for Airbnb in Cognin typically peaks in January and dips lowest during May. Leveraging Airbnb dynamic pricing tools or strategies based on this seasonality can significantly boost revenue. Here's a look at the typical nightly rates achieved:
- Best-in-class properties (Top 10%) command rates of $202+ per night, often due to premium features or locations.
- Strong performing properties (Top 25%) achieve nightly rates of $111 or more.
- Typical properties (Median) charge around $76 per night.
- Entry-level properties (Bottom 25%) earn around $44 per night.
Average Daily Rate (ADR) Trend by Month in Cognin
Get Live Cognin Market Intelligence 👇

Explore Real-time Analytics
Airbnb Seasonality Analysis & Trends in Cognin (2025)
Peak Season (December, August, July)
- Revenue averages $1,603 per month
- Occupancy rates average 56.1%
- Daily rates average $95
Shoulder Season
- Revenue averages $1,229 per month
- Occupancy maintains around 44.5%
- Daily rates hold near $95
Low Season (February, March, October)
- Revenue drops to average $701 per month
- Occupancy decreases to average 39.1%
- Daily rates adjust to average $98
Seasonality Insights for Cognin
- The Airbnb seasonality in Cognin shows highly seasonal trends requiring careful strategy. While the sections above show seasonal averages, it's also insightful to look at the extremes:
- During the high season, the absolute peak month showcases Cognin's highest earning potential, with monthly revenues capable of climbing to $1,682, occupancy reaching a high of 57.8%, and ADRs peaking at $102.
- Conversely, the slowest single month of the year, typically falling within the low season, marks the market's lowest point. In this month, revenue might dip to $505, occupancy could drop to 29.0%, and ADRs may adjust down to $91.
- Understanding both the seasonal averages and these monthly peaks and troughs in revenue, occupancy, and ADR is crucial for maximizing your Airbnb profit potential in Cognin.
Seasonal Strategies for Maximizing Profit
- Peak Season: Maximize revenue through premium pricing and potentially longer minimum stays. Ensure high availability.
- Low Season: Offer competitive pricing, special promotions (e.g., extended stay discounts), and flexible cancellation policies. Target off-season travelers like remote workers or budget-conscious guests.
- Shoulder Seasons: Implement dynamic pricing that balances peak and low rates. Target weekend travelers or specific events. Offer slightly more flexible terms than peak season.
- Regularly analyze your own performance against these Cognin seasonality benchmarks and adjust your pricing and availability strategy accordingly.
Best Areas for Airbnb Investment in Cognin (2025)
Exploring the top neighborhoods for short-term rentals in Cognin? This section highlights key areas, outlining why they are attractive for hosts and guests, along with notable local attractions. Consider these locations based on your target guest profile and investment strategy.
| Neighborhood / Area | Why Host Here? (Target Guests & Appeal) | Key Attractions & Landmarks |
|---|---|---|
| Cognin Centre | The heart of Cognin offers convenient access to local shops, restaurants, and public transportation, making it ideal for visitors looking for a central stay. | Cognin Town Hall, local cafes and restaurants, Parks and green spaces, Market square |
| Chalet des Cimes | A picturesque area known for its beautiful chalets and access to outdoor activities, perfect for travelers seeking a mountain getaway. | Hiking trails, Skiing in winter, Local markets, Scenic views |
| Bourget Lake | Nearby Bourget Lake is popular for water activities and nature excursions, appealing to families and outdoor enthusiasts. | Lake Bourget beaches, Water sports, Picnic areas, Cycling paths |
| Chambéry Historic Center | Just a short distance away, the historic center of Chambéry is rich in culture and history, attracting tourists interested in sightseeing. | Château de Chambéry, Musée des Beaux-Arts, local festivals, Shops and cafes |
| Parc des Expositions | This area hosts various events and exhibitions, making it attractive for business travelers and event-goers. | Conferences and trade shows, Nearby restaurants and hotels, Transport links |
| Mont Granier | A popular area for hiking and enjoying nature, appealing to tourists looking for outdoor adventures and stunning views. | Hiking paths, Panoramic views, Natural parks |
| Saint-Baldoph | A quaint village close to Cognin, offering a peaceful stay with easy access to the bustling nearby city life. | Village charm, Local vineyards, Hiking trails |
| Aix-les-Bains | A major spa town near Cognin that attracts tourists seeking wellness and relaxation, with ample activities and amenities. | Thermal spas, Casino, Waterfront promenade, Cultural events |
Understanding Airbnb License Requirements & STR Laws in Cognin (2025)
With 10% of listings showing registration in 2025, understanding potential Airbnb license requirements is crucial in Cognin. Always verify the latest short term rental regulations and Airbnb license requirements directly with local government authorities for Cognin to ensure full compliance before hosting.
(Source: AirROI data, 2025, based on 10% licensed listings)
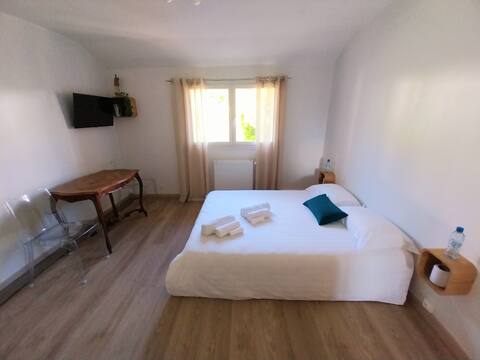
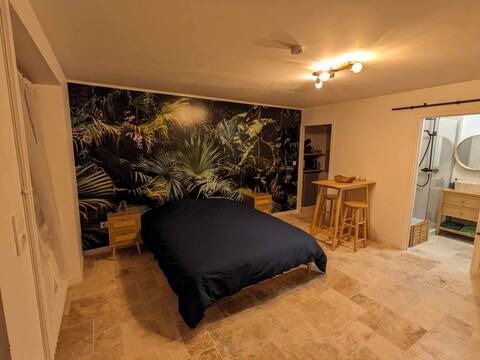
Top Performing Airbnb Properties in Cognin (2025)
Benchmark your potential! Explore examples of top-performing Airbnb properties in Cogninbased on Trailing Twelve Month (TTM) revenue. Analyze their characteristics, revenue, occupancy rate, and ADR to understand what drives success in this market.
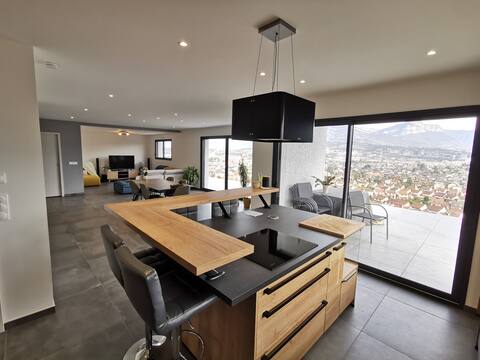
Hanging house near Chambéry and Lakes
Entire Place • 3 bedrooms
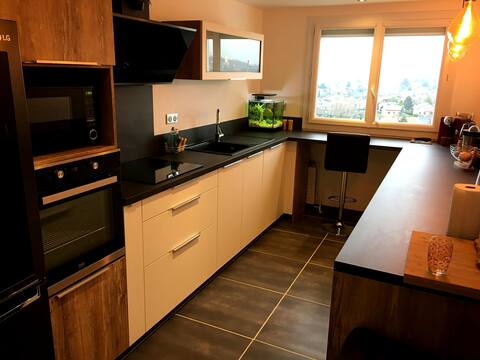
Large 90m2 apartment with amazing views
Entire Place • 2 bedrooms
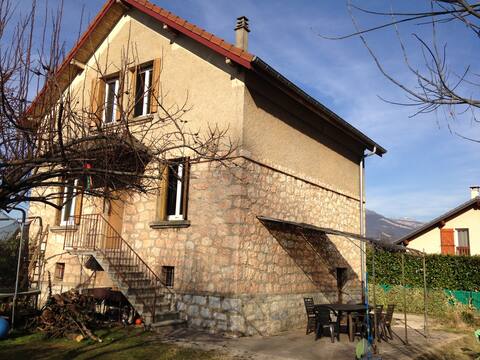
Family house 130m², Chambéry, 8 pers
Entire Place • 4 bedrooms
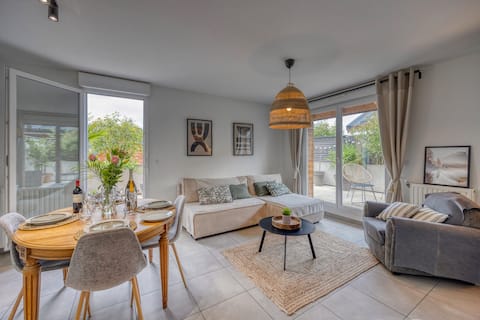
Super duplex niché à Cognin
Entire Place • 2 bedrooms
Flo's Studio
Entire Place • 1 bedroom
Studio Hauts de Chambéry
Entire Place • 1 bedroom
Note: Performance varies based on location, size, amenities, seasonality, and management quality. Data reflects the past 12 months.
Top Performing Airbnb Hosts in Cognin (2025)
Learn from the best! This table showcases top-performing Airbnb hosts in Cognin based on the number of properties managed and estimated total revenue over the past year. Analyze their scale and performance metrics.
| Host Name | Properties | Grossing Revenue | Stay Reviews | Avg Rating |
|---|---|---|---|---|
| Laurent | 1 | $31,949 | 3 | 5.00/5.0 |
| Jean Francois | 1 | $22,289 | 89 | 4.93/5.0 |
| Guillaume | 1 | $15,877 | 19 | 4.79/5.0 |
| Host #291036980 | 1 | $15,296 | 15 | 4.87/5.0 |
| Pascal | 1 | $12,963 | 71 | 4.99/5.0 |
| Aurélie | 1 | $11,792 | 15 | 5.00/5.0 |
| Yannick | 1 | $11,286 | 35 | 4.89/5.0 |
| Nadège Et Emeryc | 1 | $10,645 | 41 | 4.78/5.0 |
| Bernadette | 1 | $9,858 | 10 | 4.30/5.0 |
| Anna | 1 | $8,043 | 45 | 4.89/5.0 |
Analyzing the strategies of top hosts, such as their property selection, pricing, and guest communication, can offer valuable lessons for optimizing your own Airbnb operations in Cognin.
Dive Deeper: Advanced Cognin STR Market Data (2025)
Ready to unlock more insights? AirROI provides access to advanced metrics and comprehensive Airbnb data for Cognin. Explore detailed analytics beyond this report to refine your investment strategy, optimize pricing, and maximize your vacation rental profits.
Explore Advanced MetricsCognin Short-Term Rental Market Composition (2025): Property & Room Types
Room Type Distribution
Property Type Distribution
Market Composition Insights for Cognin
- The Cognin Airbnb market composition is heavily skewed towards Entire Home/Apt listings, which make up 75% of the 20 active rentals. This indicates strong guest preference for privacy and space.
- Looking at the property type distribution in Cognin, Apartment/Condo properties are the most common (60%), reflecting the local real estate landscape.
- Houses represent a significant 30% portion, catering likely to families or larger groups.
- The presence of 10% Hotel/Boutique listings indicates integration with traditional hospitality.
Cognin Airbnb Room Capacity Analysis (2025): Bedroom Distribution
Distribution of Listings by Number of Bedrooms
Room Capacity Insights for Cognin
- The dominant room capacity in Cognin is 2 bedrooms listings, making up 25% of the market. This suggests a strong demand for properties suitable for couples or solo travelers.
- Together, 2 bedrooms and 3 bedrooms properties represent 45.0% of the active Airbnb listings in Cognin, indicating a high concentration in these sizes.
- A significant 30.0% of listings offer 3+ bedrooms, catering to larger groups and families seeking more space in Cognin.
Cognin Vacation Rental Guest Capacity Trends (2025)
Distribution of Listings by Guest Capacity
Guest Capacity Insights for Cognin
- The most common guest capacity trend in Cognin vacation rentals is listings accommodating 4 guests (15%). This suggests the primary traveler segment is likely small families or groups.
- Properties designed for 4 guests and 2 guests dominate the Cognin STR market, accounting for 30.0% of listings.
- 30.0% of properties accommodate 6+ guests, serving the market segment for larger families or group travel in Cognin.
- On average, properties in Cognin are equipped to host 3.6 guests.
Cognin Airbnb Booking Patterns (2025): Available vs. Booked Days
Available Days Distribution
Booked Days Distribution
Booking Pattern Insights for Cognin
- The most common availability pattern in Cognin falls within the 271-366 days range, representing 45% of listings. This suggests many properties have significant open periods on their calendars.
- Approximately 60.0% of listings show high availability (181+ days open annually), indicating potential for increased bookings or specific owner usage patterns.
- For booked days, the 181-270 days range is most frequent in Cognin (40%), reflecting common guest stay durations or potential owner blocking patterns.
- A notable 40.0% of properties secure long booking periods (181+ days booked per year), highlighting successful long-term rental strategies or significant owner usage.
Cognin Airbnb Minimum Stay Requirements Analysis
Distribution of Listings by Minimum Night Requirement
1 Night
5 listings
27.8% of total
2 Nights
3 listings
16.7% of total
3 Nights
3 listings
16.7% of total
4-6 Nights
3 listings
16.7% of total
30+ Nights
4 listings
22.2% of total
Key Insights
- The most prevalent minimum stay requirement in Cognin is 1 Night, adopted by 27.8% of listings. This highlights the market's preference for shorter, flexible bookings.
- A significant segment (22.2%) caters to monthly stays (30+ nights) in Cognin, pointing to opportunities in the extended-stay market.
Recommendations
- Align with the market by considering a 1 Night minimum stay, as 27.8% of Cognin hosts use this setting.
- If feasible, allowing 1-night stays, especially midweek or during low season, could capture last-minute bookings, as only 27.8% currently do.
- Explore offering discounts for stays of 30+ nights to attract the 22.2% of the market seeking extended stays.
- Adjust minimum nights based on seasonality – potentially shorter during low season and longer during peak demand periods in Cognin.
Cognin Airbnb Cancellation Policy Trends Analysis (2025)
Flexible
8 listings
47.1% of total
Moderate
2 listings
11.8% of total
Firm
5 listings
29.4% of total
Strict
2 listings
11.8% of total
Cancellation Policy Insights for Cognin
- The prevailing Airbnb cancellation policy trend in Cognin is Flexible, used by 47.1% of listings.
- There's a relatively balanced mix between guest-friendly (58.9%) and stricter (41.2%) policies, offering choices for different guest needs.
Recommendations for Hosts
- Consider adopting a Flexible policy to align with the 47.1% market standard in Cognin.
- Using a Strict policy might deter some guests, as only 11.8% of listings use it. Evaluate if potential revenue protection outweighs possible lower booking rates.
- Regularly review your cancellation policy against competitors and market demand shifts in Cognin.
Cognin STR Booking Lead Time Analysis (2025)
Average Booking Lead Time by Month
Booking Lead Time Insights for Cognin
- The overall average booking lead time for vacation rentals in Cognin is 58 days.
- Guests book furthest in advance for stays during January (average 77 days), likely coinciding with peak travel demand or local events.
- The shortest booking windows occur for stays in April (average 20 days), indicating more last-minute travel plans during this time.
- Seasonally, Summer (65 days avg.) sees the longest lead times, while Spring (37 days avg.) has the shortest, reflecting typical travel planning cycles.
Recommendations for Hosts
- Use the overall average lead time (58 days) as a baseline for your pricing and availability strategy in Cognin.
- For January stays, consider implementing length-of-stay discounts or slightly higher rates for bookings made less than 77 days out to capitalize on advance planning.
- Target marketing efforts for the Summer season well in advance (at least 65 days) to capture early planners.
- Monitor your own booking lead times against these Cognin averages to identify opportunities for dynamic pricing adjustments.
Popular & Essential Airbnb Amenities in Cognin (2025)
Amenity Prevalence
Amenity Insights for Cognin
- Essential amenities in Cognin that guests expect include: Heating, Free parking on premises, Hot water, TV, Wifi. Lacking these (any) could significantly impact bookings.
- Popular amenities like Smoke alarm, Essentials, Kitchen are common but not universal. Offering these can provide a competitive edge.
Recommendations for Hosts
- Ensure your listing includes all essential amenities for Cognin: Heating, Free parking on premises, Hot water, TV, Wifi.
- Prioritize adding missing essentials: Free parking on premises, Hot water, TV, Wifi.
- Consider adding popular differentiators like Smoke alarm or Essentials to increase appeal.
- Highlight unique or less common amenities you offer (e.g., hot tub, dedicated workspace, EV charger) in your listing description and photos.
- Regularly check competitor amenities in Cognin to stay competitive.
Cognin Airbnb Guest Demographics & Profile Analysis (2025)
Guest Profile Summary for Cognin
- The typical guest profile for Airbnb in Cognin consists of primarily domestic travelers (88%), often arriving from nearby Paris, typically belonging to the Post-2000s (Gen Z/Alpha) group (50%), primarily speaking French or English.
- Domestic travelers account for 87.7% of guests.
- Key international markets include France (87.7%) and Italy (2.7%).
- Top languages spoken are French (48.2%) followed by English (32.4%).
- A significant demographic segment is the Post-2000s (Gen Z/Alpha) group, representing 50% of guests.
Recommendations for Hosts
- Target domestic marketing efforts towards travelers from Paris and Chambéry.
- Tailor amenities and listing descriptions to appeal to the dominant Post-2000s (Gen Z/Alpha) demographic (e.g., highlight fast WiFi, smart home features, local guides).
- Highlight unique local experiences or amenities relevant to the primary guest profile.
- Consider seasonal promotions aligned with peak travel times for key origin markets.
Nearby Short-Term Rental Market Comparison
How does the Cognin Airbnb market stack up against its neighbors? Compare key performance metrics like average monthly revenue, ADR, and occupancy rates in surrounding areas to understand the broader regional STR landscape.
| Market | Active Properties | Monthly Revenue | Daily Rate | Avg. Occupancy |
|---|---|---|---|---|
| La Rivière-Enverse | 17 | $5,972 | $624.02 | 41% |
| Les Clefs | 30 | $5,741 | $323.11 | 44% |
| Épinac | 14 | $5,147 | $333.01 | 37% |
| Manigod | 194 | $4,127 | $427.80 | 40% |
| Divajeu | 19 | $3,941 | $410.65 | 42% |
| Saint-Germain-au-Mont-d'Or | 10 | $3,928 | $316.02 | 40% |
| Puligny-Montrachet | 11 | $3,908 | $398.00 | 44% |
| Dommartin | 11 | $3,905 | $327.00 | 36% |
| Saint-Nicolas-la-Chapelle | 27 | $3,381 | $375.70 | 43% |
| Juliénas | 11 | $3,378 | $292.32 | 46% |