Challes-les-Eaux Airbnb Market Analysis 2025: Short Term Rental Data & Vacation Rental Statistics in Auvergne-Rhône-Alpes, France
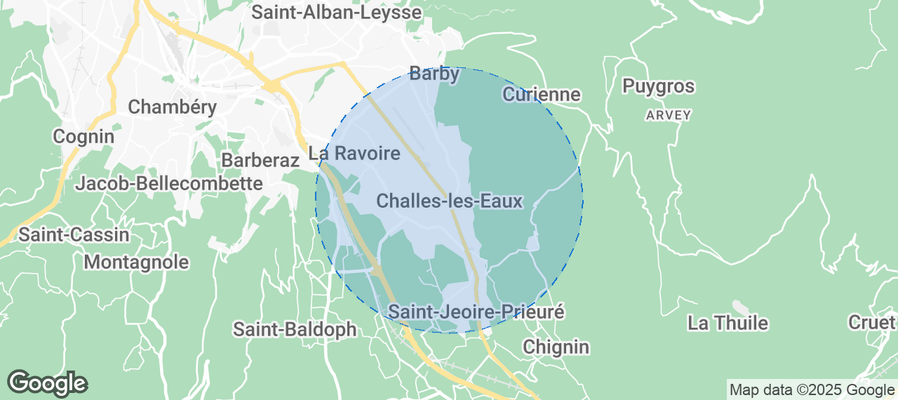
Is Airbnb profitable in Challes-les-Eaux in 2025? Explore comprehensive Airbnb analytics for Challes-les-Eaux, Auvergne-Rhône-Alpes, France to uncover income potential. This 2025 STR market report for Challes-les-Eaux, based on AirROI data from April 2024 to March 2025, reveals key trends in the niche market of 28 active listings.
Whether you're considering an Airbnb investment in Challes-les-Eaux, optimizing your existing vacation rental, or exploring rental arbitrage opportunities, understanding the Challes-les-Eaux Airbnb data is crucial. Leveraging the low regulation environment is key to maximizing your short term rental income potential. Let's dive into the specifics.
Key Challes-les-Eaux Airbnb Performance Metrics Overview
Monthly Airbnb Revenue Variations & Income Potential in Challes-les-Eaux (2025)
Understanding the monthly revenue variations for Airbnb listings in Challes-les-Eaux is key to maximizing your short term rental income potential. Seasonality significantly impacts earnings. Our analysis, based on data from the past 12 months, shows that the peak revenue month for STRs in Challes-les-Eaux is typically August, while March often presents the lowest earnings, highlighting opportunities for strategic pricing adjustments during shoulder and low seasons. Explore the typical Airbnb income in Challes-les-Eaux across different performance tiers:
- Best-in-class properties (Top 10%) achieve $1,984+ monthly, often utilizing dynamic pricing and superior guest experiences.
- Strong performing properties (Top 25%) earn $1,339 or more, indicating effective management and desirable locations/amenities.
- Typical properties (Median) generate around $932 per month, representing the average market performance.
- Entry-level properties (Bottom 25%) see earnings around $571, often with potential for optimization.
Average Monthly Airbnb Earnings Trend in Challes-les-Eaux
Challes-les-Eaux Airbnb Occupancy Rate Trends (2025)
Maximize your bookings by understanding the Challes-les-Eaux STR occupancy trends. Seasonal demand shifts significantly influence how often properties are booked. Typically, Augustsees the highest demand (peak season occupancy), while March experiences the lowest (low season). Effective strategies, like adjusting minimum stays or offering promotions, can boost occupancy during slower periods. Here's how different property tiers perform in Challes-les-Eaux:
- Best-in-class properties (Top 10%) achieve 90%+ occupancy, indicating high desirability and potentially optimized availability.
- Strong performing properties (Top 25%) maintain 73% or higher occupancy, suggesting good market fit and guest satisfaction.
- Typical properties (Median) have an occupancy rate around 55%.
- Entry-level properties (Bottom 25%) average 29% occupancy, potentially facing higher vacancy.
Average Monthly Occupancy Rate Trend in Challes-les-Eaux
Average Daily Rate (ADR) Airbnb Trends in Challes-les-Eaux (2025)
Effective short term rental pricing strategy in Challes-les-Eaux involves understanding monthly ADR fluctuations. The Average Daily Rate (ADR) for Airbnb in Challes-les-Eaux typically peaks in December and dips lowest during April. Leveraging Airbnb dynamic pricing tools or strategies based on this seasonality can significantly boost revenue. Here's a look at the typical nightly rates achieved:
- Best-in-class properties (Top 10%) command rates of $82+ per night, often due to premium features or locations.
- Strong performing properties (Top 25%) achieve nightly rates of $72 or more.
- Typical properties (Median) charge around $55 per night.
- Entry-level properties (Bottom 25%) earn around $46 per night.
Average Daily Rate (ADR) Trend by Month in Challes-les-Eaux
Get Live Challes-les-Eaux Market Intelligence 👇
Explore Real-time Analytics
Airbnb Seasonality Analysis & Trends in Challes-les-Eaux (2025)
Peak Season (August, July, May)
- Revenue averages $1,286 per month
- Occupancy rates average 65.0%
- Daily rates average $60
Shoulder Season
- Revenue averages $1,046 per month
- Occupancy maintains around 51.2%
- Daily rates hold near $61
Low Season (January, February, March)
- Revenue drops to average $852 per month
- Occupancy decreases to average 46.2%
- Daily rates adjust to average $63
Seasonality Insights for Challes-les-Eaux
- The Airbnb seasonality in Challes-les-Eaux shows moderate seasonality with distinct peak and low periods. While the sections above show seasonal averages, it's also insightful to look at the extremes:
- During the high season, the absolute peak month showcases Challes-les-Eaux's highest earning potential, with monthly revenues capable of climbing to $1,325, occupancy reaching a high of 66.6%, and ADRs peaking at $65.
- Conversely, the slowest single month of the year, typically falling within the low season, marks the market's lowest point. In this month, revenue might dip to $827, occupancy could drop to 43.1%, and ADRs may adjust down to $59.
- Understanding both the seasonal averages and these monthly peaks and troughs in revenue, occupancy, and ADR is crucial for maximizing your Airbnb profit potential in Challes-les-Eaux.
Seasonal Strategies for Maximizing Profit
- Peak Season: Maximize revenue through premium pricing and potentially longer minimum stays. Ensure high availability.
- Low Season: Offer competitive pricing, special promotions (e.g., extended stay discounts), and flexible cancellation policies. Target off-season travelers like remote workers or budget-conscious guests.
- Shoulder Seasons: Implement dynamic pricing that balances peak and low rates. Target weekend travelers or specific events. Offer slightly more flexible terms than peak season.
- Regularly analyze your own performance against these Challes-les-Eaux seasonality benchmarks and adjust your pricing and availability strategy accordingly.
Best Areas for Airbnb Investment in Challes-les-Eaux (2025)
Exploring the top neighborhoods for short-term rentals in Challes-les-Eaux? This section highlights key areas, outlining why they are attractive for hosts and guests, along with notable local attractions. Consider these locations based on your target guest profile and investment strategy.
| Neighborhood / Area | Why Host Here? (Target Guests & Appeal) | Key Attractions & Landmarks |
|---|---|---|
| Thermal Park | Challes-les-Eaux is known for its health and wellness tourism, primarily due to its thermal baths. This area attracts visitors seeking relaxation and rejuvenation in a serene environment. | Challes-les-Eaux Thermal Baths, Spa and Wellness Center, Hiking trails, Scenic parks, Local restaurants offering gourmet health food |
| Vineyards | The surrounding region is famous for its vineyards and wine production. Tourists are drawn to wine tasting experiences and the picturesque countryside. | Local vineyards, Wine tasting tours, Scenic views of the vineyards, Historical wine cellars, Annual wine festivals |
| Aquatic Centre | The aquatic center is a family-friendly destination popular during the summer months. Ideal for families looking for fun activities. | Aquatic Centre, Swimming pools, Water sports activities, Play areas for children, Picnic areas |
| Château de la Roche du Roi | This historical castle offers tours and has beautiful gardens, attracting tourists interested in culture and history. | Château de la Roche du Roi, Guided tours, Historical exhibitions, Beautiful gardens, Photography opportunities |
| La montagne de la Charvaz | A nearby mountain offering hiking and outdoor activities, which attracts nature lovers and adventure seekers. | Hiking trails, Panoramic views, Nature photography, Picnic spots, Seasonal wildlife sightings |
| Local Markets | Challes-les-Eaux features charming local markets that draw visitors looking for fresh produce and local delicacies. | Weekly farmers' market, Crafts and handmade goods, Local specialties, Culinary experiences, Cultural interactions with locals |
| Cultural events | The town hosts various cultural events throughout the year such as concerts and festivals, attracting locals and tourists alike. | Music festivals, Art fairs, Food festivals, Theater performances, Local artisan showcases |
| Proximity to Chambery | Challes-les-Eaux is located close to Chambery, making it a great base for visitors who want to explore the city while enjoying a quieter stay. | Chambery city center, Historical architecture, Shopping streets, Museums, Cultural sites |
Understanding Airbnb License Requirements & STR Laws in Challes-les-Eaux (2025)
While Challes-les-Eaux, Auvergne-Rhône-Alpes, France currently shows low STR regulations, specific Airbnb license requirements might still exist or change. Always verify the latest short term rental regulations and Airbnb license requirements directly with local government authorities for Challes-les-Eaux to ensure full compliance before hosting.
(Source: AirROI data, 2025, based on 4% licensed listings)
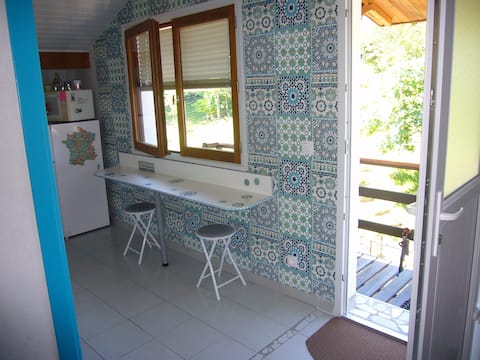
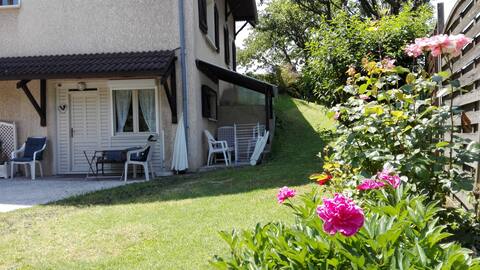
Top Performing Airbnb Properties in Challes-les-Eaux (2025)
Benchmark your potential! Explore examples of top-performing Airbnb properties in Challes-les-Eauxbased on Trailing Twelve Month (TTM) revenue. Analyze their characteristics, revenue, occupancy rate, and ADR to understand what drives success in this market.
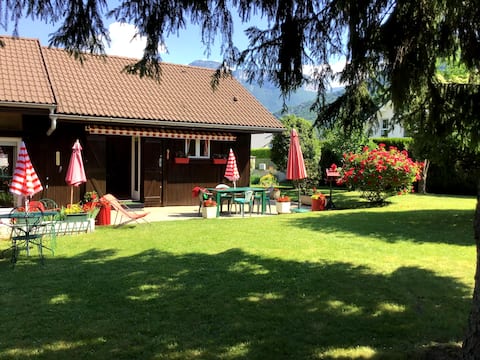
Loue chalet loft all comfort with garden,
Entire Place • 2 bedrooms
French Alps! Vacation with dt-frz.Family
Entire Place • 2 bedrooms

Lovely place with a Jacuzzi
Entire Place • 1 bedroom

L'Escale Zen - Quiet | WiFi Fiber | Parking
Entire Place • 1 bedroom
Challes les Eaux, nice studio in the greenery
Entire Place • N/A
Cozy quiet studio, independent entrance.
Entire Place • 1 bedroom
Note: Performance varies based on location, size, amenities, seasonality, and management quality. Data reflects the past 12 months.
Top Performing Airbnb Hosts in Challes-les-Eaux (2025)
Learn from the best! This table showcases top-performing Airbnb hosts in Challes-les-Eaux based on the number of properties managed and estimated total revenue over the past year. Analyze their scale and performance metrics.
| Host Name | Properties | Grossing Revenue | Stay Reviews | Avg Rating |
|---|---|---|---|---|
| Marie | 1 | $26,654 | 14 | 4.93/5.0 |
| Annette | 2 | $21,948 | 186 | 4.75/5.0 |
| Hervé Et Sylvie | 1 | $16,706 | 46 | 4.98/5.0 |
| Olivier | 2 | $15,678 | 215 | 4.86/5.0 |
| Damien | 1 | $15,320 | 106 | 4.91/5.0 |
| Catherine | 1 | $14,069 | 65 | 4.89/5.0 |
| Antoine | 1 | $13,091 | 116 | 4.97/5.0 |
| Lenaick | 1 | $12,980 | 13 | 4.62/5.0 |
| Vincent | 2 | $11,671 | 49 | 4.79/5.0 |
| Sophie | 1 | $11,646 | 201 | 4.93/5.0 |
Analyzing the strategies of top hosts, such as their property selection, pricing, and guest communication, can offer valuable lessons for optimizing your own Airbnb operations in Challes-les-Eaux.
Dive Deeper: Advanced Challes-les-Eaux STR Market Data (2025)
Ready to unlock more insights? AirROI provides access to advanced metrics and comprehensive Airbnb data for Challes-les-Eaux. Explore detailed analytics beyond this report to refine your investment strategy, optimize pricing, and maximize your vacation rental profits.
Explore Advanced MetricsChalles-les-Eaux Short-Term Rental Market Composition (2025): Property & Room Types
Room Type Distribution
Property Type Distribution
Market Composition Insights for Challes-les-Eaux
- The Challes-les-Eaux Airbnb market composition is heavily skewed towards Entire Home/Apt listings, which make up 92.9% of the 28 active rentals. This indicates strong guest preference for privacy and space.
- Looking at the property type distribution in Challes-les-Eaux, Apartment/Condo properties are the most common (75%), reflecting the local real estate landscape.
- Houses represent a significant 21.4% portion, catering likely to families or larger groups.
- Smaller segments like others (combined 3.6%) offer potential for unique stay experiences.
Challes-les-Eaux Airbnb Room Capacity Analysis (2025): Bedroom Distribution
Distribution of Listings by Number of Bedrooms
Room Capacity Insights for Challes-les-Eaux
- The dominant room capacity in Challes-les-Eaux is 1 bedroom listings, making up 50% of the market. This suggests a strong demand for properties suitable for couples or solo travelers.
- Together, 1 bedroom and 2 bedrooms properties represent 71.4% of the active Airbnb listings in Challes-les-Eaux, indicating a high concentration in these sizes.
Challes-les-Eaux Vacation Rental Guest Capacity Trends (2025)
Distribution of Listings by Guest Capacity
Guest Capacity Insights for Challes-les-Eaux
- The most common guest capacity trend in Challes-les-Eaux vacation rentals is listings accommodating 2 guests (39.3%). This suggests the primary traveler segment is likely couples or solo travelers.
- Properties designed for 2 guests and 4 guests dominate the Challes-les-Eaux STR market, accounting for 64.3% of listings.
- A significant 42.9% of listings cater specifically to 1-2 guests, highlighting strong demand from couples and solo travelers in Challes-les-Eaux.
- On average, properties in Challes-les-Eaux are equipped to host 2.9 guests.
Challes-les-Eaux Airbnb Booking Patterns (2025): Available vs. Booked Days
Available Days Distribution
Booked Days Distribution
Booking Pattern Insights for Challes-les-Eaux
- The most common availability pattern in Challes-les-Eaux falls within the 91-180 days range, representing 35.7% of listings. This suggests many properties have significant open periods on their calendars.
- Approximately 50.0% of listings show high availability (181+ days open annually), indicating potential for increased bookings or specific owner usage patterns.
- For booked days, the 181-270 days range is most frequent in Challes-les-Eaux (32.1%), reflecting common guest stay durations or potential owner blocking patterns.
- A notable 50.0% of properties secure long booking periods (181+ days booked per year), highlighting successful long-term rental strategies or significant owner usage.
Challes-les-Eaux Airbnb Minimum Stay Requirements Analysis
Distribution of Listings by Minimum Night Requirement
1 Night
4 listings
14.8% of total
2 Nights
8 listings
29.6% of total
3 Nights
4 listings
14.8% of total
4-6 Nights
3 listings
11.1% of total
7-29 Nights
5 listings
18.5% of total
30+ Nights
3 listings
11.1% of total
Key Insights
- The most prevalent minimum stay requirement in Challes-les-Eaux is 2 Nights, adopted by 29.6% of listings. This highlights the market's preference for shorter, flexible bookings.
- A significant segment (11.1%) caters to monthly stays (30+ nights) in Challes-les-Eaux, pointing to opportunities in the extended-stay market.
Recommendations
- Align with the market by considering a 2 Nights minimum stay, as 29.6% of Challes-les-Eaux hosts use this setting.
- If feasible, allowing 1-night stays, especially midweek or during low season, could capture last-minute bookings, as only 14.8% currently do.
- Explore offering discounts for stays of 30+ nights to attract the 11.1% of the market seeking extended stays.
- Adjust minimum nights based on seasonality – potentially shorter during low season and longer during peak demand periods in Challes-les-Eaux.
Challes-les-Eaux Airbnb Cancellation Policy Trends Analysis (2025)
Flexible
8 listings
30.8% of total
Moderate
9 listings
34.6% of total
Firm
6 listings
23.1% of total
Strict
3 listings
11.5% of total
Cancellation Policy Insights for Challes-les-Eaux
- The prevailing Airbnb cancellation policy trend in Challes-les-Eaux is Moderate, used by 34.6% of listings.
- There's a relatively balanced mix between guest-friendly (65.4%) and stricter (34.6%) policies, offering choices for different guest needs.
Recommendations for Hosts
- Consider adopting a Moderate policy to align with the 34.6% market standard in Challes-les-Eaux.
- Using a Strict policy might deter some guests, as only 11.5% of listings use it. Evaluate if potential revenue protection outweighs possible lower booking rates.
- Regularly review your cancellation policy against competitors and market demand shifts in Challes-les-Eaux.
Challes-les-Eaux STR Booking Lead Time Analysis (2025)
Average Booking Lead Time by Month
Booking Lead Time Insights for Challes-les-Eaux
- The overall average booking lead time for vacation rentals in Challes-les-Eaux is 43 days.
- Guests book furthest in advance for stays during August (average 67 days), likely coinciding with peak travel demand or local events.
- The shortest booking windows occur for stays in March (average 27 days), indicating more last-minute travel plans during this time.
- Seasonally, Summer (55 days avg.) sees the longest lead times, while Winter (36 days avg.) has the shortest, reflecting typical travel planning cycles.
Recommendations for Hosts
- Use the overall average lead time (43 days) as a baseline for your pricing and availability strategy in Challes-les-Eaux.
- For August stays, consider implementing length-of-stay discounts or slightly higher rates for bookings made less than 67 days out to capitalize on advance planning.
- Target marketing efforts for the Summer season well in advance (at least 55 days) to capture early planners.
- Monitor your own booking lead times against these Challes-les-Eaux averages to identify opportunities for dynamic pricing adjustments.
Popular & Essential Airbnb Amenities in Challes-les-Eaux (2025)
Amenity Prevalence
Amenity Insights for Challes-les-Eaux
- Essential amenities in Challes-les-Eaux that guests expect include: Free parking on premises, Kitchen, Smoke alarm. Lacking these (any) could significantly impact bookings.
- Popular amenities like Heating, Wifi, TV are common but not universal. Offering these can provide a competitive edge.
- Warning: Wifi is not universally provided but is considered essential globally. Ensure reliable Wifi is offered.
Recommendations for Hosts
- Ensure your listing includes all essential amenities for Challes-les-Eaux: Free parking on premises, Kitchen, Smoke alarm.
- Prioritize adding missing essentials: Free parking on premises, Kitchen, Smoke alarm.
- Consider adding popular differentiators like Heating or Wifi to increase appeal.
- Highlight unique or less common amenities you offer (e.g., hot tub, dedicated workspace, EV charger) in your listing description and photos.
- Regularly check competitor amenities in Challes-les-Eaux to stay competitive.
Challes-les-Eaux Airbnb Guest Demographics & Profile Analysis (2025)
Guest Profile Summary for Challes-les-Eaux
- The typical guest profile for Airbnb in Challes-les-Eaux consists of primarily domestic travelers (94%), often arriving from nearby Lyon, typically belonging to the Post-2000s (Gen Z/Alpha) group (50%), primarily speaking French or English.
- Domestic travelers account for 94.2% of guests.
- Key international markets include France (94.2%) and United Kingdom (0.9%).
- Top languages spoken are French (45.7%) followed by English (31.3%).
- A significant demographic segment is the Post-2000s (Gen Z/Alpha) group, representing 50% of guests.
Recommendations for Hosts
- Target domestic marketing efforts towards travelers from Lyon and Paris.
- Tailor amenities and listing descriptions to appeal to the dominant Post-2000s (Gen Z/Alpha) demographic (e.g., highlight fast WiFi, smart home features, local guides).
- Highlight unique local experiences or amenities relevant to the primary guest profile.
- Consider seasonal promotions aligned with peak travel times for key origin markets.
Nearby Short-Term Rental Market Comparison
How does the Challes-les-Eaux Airbnb market stack up against its neighbors? Compare key performance metrics like average monthly revenue, ADR, and occupancy rates in surrounding areas to understand the broader regional STR landscape.
| Market | Active Properties | Monthly Revenue | Daily Rate | Avg. Occupancy |
|---|---|---|---|---|
| La Rivière-Enverse | 17 | $5,972 | $624.02 | 41% |
| Les Clefs | 30 | $5,741 | $323.11 | 44% |
| Épinac | 14 | $5,147 | $333.01 | 37% |
| Manigod | 194 | $4,127 | $427.80 | 40% |
| Divajeu | 19 | $3,941 | $410.65 | 42% |
| Saint-Germain-au-Mont-d'Or | 10 | $3,928 | $316.02 | 40% |
| Puligny-Montrachet | 11 | $3,908 | $398.00 | 44% |
| Dommartin | 11 | $3,905 | $327.00 | 36% |
| Saint-Nicolas-la-Chapelle | 27 | $3,381 | $375.70 | 43% |
| Juliénas | 11 | $3,378 | $292.32 | 46% |