Ceyrat Airbnb Market Analysis 2025: Short Term Rental Data & Vacation Rental Statistics in Auvergne-Rhône-Alpes, France
Is Airbnb profitable in Ceyrat in 2025? Explore comprehensive Airbnb analytics for Ceyrat, Auvergne-Rhône-Alpes, France to uncover income potential. This 2025 STR market report for Ceyrat, based on AirROI data from April 2024 to March 2025, reveals key trends in the niche market of 32 active listings.
Whether you're considering an Airbnb investment in Ceyrat, optimizing your existing vacation rental, or exploring rental arbitrage opportunities, understanding the Ceyrat Airbnb data is crucial. Understanding the local regulations is key to maximizing your short term rental income potential. Let's dive into the specifics.
Key Ceyrat Airbnb Performance Metrics Overview
Monthly Airbnb Revenue Variations & Income Potential in Ceyrat (2025)
Understanding the monthly revenue variations for Airbnb listings in Ceyrat is key to maximizing your short term rental income potential. Seasonality significantly impacts earnings. Our analysis, based on data from the past 12 months, shows that the peak revenue month for STRs in Ceyrat is typically August, while March often presents the lowest earnings, highlighting opportunities for strategic pricing adjustments during shoulder and low seasons. Explore the typical Airbnb income in Ceyrat across different performance tiers:
- Best-in-class properties (Top 10%) achieve $2,805+ monthly, often utilizing dynamic pricing and superior guest experiences.
- Strong performing properties (Top 25%) earn $1,571 or more, indicating effective management and desirable locations/amenities.
- Typical properties (Median) generate around $1,041 per month, representing the average market performance.
- Entry-level properties (Bottom 25%) see earnings around $551, often with potential for optimization.
Average Monthly Airbnb Earnings Trend in Ceyrat
Ceyrat Airbnb Occupancy Rate Trends (2025)
Maximize your bookings by understanding the Ceyrat STR occupancy trends. Seasonal demand shifts significantly influence how often properties are booked. Typically, Augustsees the highest demand (peak season occupancy), while January experiences the lowest (low season). Effective strategies, like adjusting minimum stays or offering promotions, can boost occupancy during slower periods. Here's how different property tiers perform in Ceyrat:
- Best-in-class properties (Top 10%) achieve 79%+ occupancy, indicating high desirability and potentially optimized availability.
- Strong performing properties (Top 25%) maintain 67% or higher occupancy, suggesting good market fit and guest satisfaction.
- Typical properties (Median) have an occupancy rate around 48%.
- Entry-level properties (Bottom 25%) average 25% occupancy, potentially facing higher vacancy.
Average Monthly Occupancy Rate Trend in Ceyrat
Average Daily Rate (ADR) Airbnb Trends in Ceyrat (2025)
Effective short term rental pricing strategy in Ceyrat involves understanding monthly ADR fluctuations. The Average Daily Rate (ADR) for Airbnb in Ceyrat typically peaks in December and dips lowest during October. Leveraging Airbnb dynamic pricing tools or strategies based on this seasonality can significantly boost revenue. Here's a look at the typical nightly rates achieved:
- Best-in-class properties (Top 10%) command rates of $222+ per night, often due to premium features or locations.
- Strong performing properties (Top 25%) achieve nightly rates of $103 or more.
- Typical properties (Median) charge around $66 per night.
- Entry-level properties (Bottom 25%) earn around $50 per night.
Average Daily Rate (ADR) Trend by Month in Ceyrat
Get Live Ceyrat Market Intelligence 👇

Explore Real-time Analytics
Airbnb Seasonality Analysis & Trends in Ceyrat (2025)
Peak Season (August, July, May)
- Revenue averages $1,935 per month
- Occupancy rates average 65.6%
- Daily rates average $100
Shoulder Season
- Revenue averages $1,292 per month
- Occupancy maintains around 41.4%
- Daily rates hold near $100
Low Season (March, October, November)
- Revenue drops to average $870 per month
- Occupancy decreases to average 38.1%
- Daily rates adjust to average $98
Seasonality Insights for Ceyrat
- The Airbnb seasonality in Ceyrat shows highly seasonal trends requiring careful strategy. While the sections above show seasonal averages, it's also insightful to look at the extremes:
- During the high season, the absolute peak month showcases Ceyrat's highest earning potential, with monthly revenues capable of climbing to $2,099, occupancy reaching a high of 68.7%, and ADRs peaking at $105.
- Conversely, the slowest single month of the year, typically falling within the low season, marks the market's lowest point. In this month, revenue might dip to $736, occupancy could drop to 31.1%, and ADRs may adjust down to $98.
- Understanding both the seasonal averages and these monthly peaks and troughs in revenue, occupancy, and ADR is crucial for maximizing your Airbnb profit potential in Ceyrat.
Seasonal Strategies for Maximizing Profit
- Peak Season: Maximize revenue through premium pricing and potentially longer minimum stays. Ensure high availability.
- Low Season: Offer competitive pricing, special promotions (e.g., extended stay discounts), and flexible cancellation policies. Target off-season travelers like remote workers or budget-conscious guests.
- Shoulder Seasons: Implement dynamic pricing that balances peak and low rates. Target weekend travelers or specific events. Offer slightly more flexible terms than peak season.
- Regularly analyze your own performance against these Ceyrat seasonality benchmarks and adjust your pricing and availability strategy accordingly.
Best Areas for Airbnb Investment in Ceyrat (2025)
Exploring the top neighborhoods for short-term rentals in Ceyrat? This section highlights key areas, outlining why they are attractive for hosts and guests, along with notable local attractions. Consider these locations based on your target guest profile and investment strategy.
| Neighborhood / Area | Why Host Here? (Target Guests & Appeal) | Key Attractions & Landmarks |
|---|---|---|
| Ceyrat Village Center | Charming village atmosphere with access to local shops, cafes, and restaurants. Ideal for guests looking for a tranquil retreat close to nature. | Basilique Notre-Dame d'Orcival, Puy de Dôme, Parc Naturel Régional des Volcans d'Auvergne, Château de Tournoël, Lac de Ceyrat |
| Mont-Dore | Popular destination for outdoor enthusiasts with skiing in winter and hiking in summer. Ideal for nature lovers and adventure seekers. | Puy de Sancy, Mont-Dore ski resort, Lac de Guéry, Spa resorts, Thermal baths |
| Clermont-Ferrand | The largest city in the Auvergne region, offering a mix of urban and cultural attractions, making it a prime location for tourists and business travelers. | Place de Jaude, Clermont-Ferrand Cathedral, Vulcania, Musee Roger Quilliot, Puy de Dôme |
| Puy-de-Dôme | Famous for its volcanic landscapes and outdoor activities. Great for guests looking for hiking, cycling, and scenic views. | Puy de Dôme Volcano, Ferroviaire Vulcania, Chaine des Puys, Lac Chambon, Château de Murol |
| Saint-Nectaire | Known for its beautiful landscapes and cheese production, this area attracts gastronomes and nature lovers alike. | Saint-Nectaire cheese farms, Château de Murol, Lac de Saint-Nectaire, Thermal baths, Vulcania |
| Châtel-Guyon | A spa town renowned for its thermal springs, popular amongst those looking for relaxation and wellness retreats. | Thermal spa, Casino de Châtel-Guyon, Château de la Roche, Parc Thermal, Local markets |
| Issoire | Historic town with rich heritage, located on the way to many natural attractions, perfect for those seeking culture and nature. | Abbey of Saint-Austremoine, Issoire municipality, Monts Dore, Château de Villeneuve, Vineyards |
| La Bourboule | Charming family-friendly resort known for its spa facilities and access to outdoor activities, great for families and wellness travelers. | Thermal baths, La Bourboule ski resort, Parc Fenestre, Lac de La Bourboule, Scenic mountain trails |
Understanding Airbnb License Requirements & STR Laws in Ceyrat (2025)
With 16% of listings showing registration in 2025, understanding potential Airbnb license requirements is crucial in Ceyrat. Always verify the latest short term rental regulations and Airbnb license requirements directly with local government authorities for Ceyrat to ensure full compliance before hosting.
(Source: AirROI data, 2025, based on 16% licensed listings)
Top Performing Airbnb Properties in Ceyrat (2025)
Benchmark your potential! Explore examples of top-performing Airbnb properties in Ceyratbased on Trailing Twelve Month (TTM) revenue. Analyze their characteristics, revenue, occupancy rate, and ADR to understand what drives success in this market.
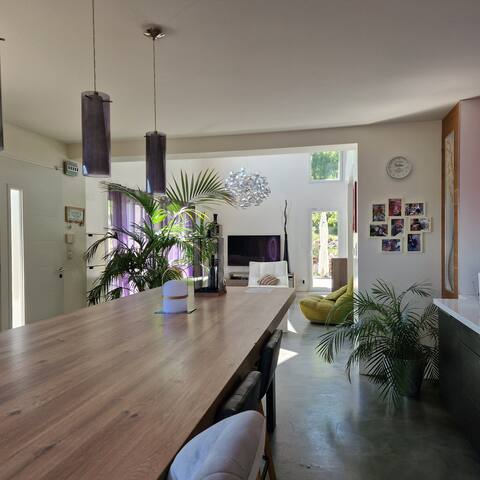
Welcoming family home
Entire Place • 4 bedrooms
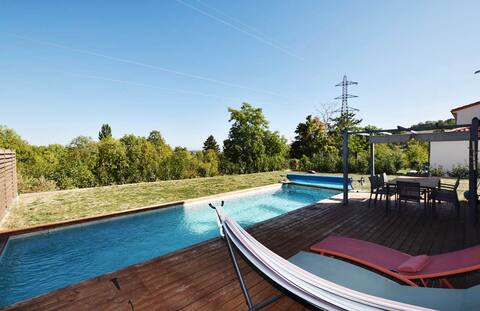
10min downtown & hiking / skiing (45min) / culture
Entire Place • 4 bedrooms

*Sky View* Cinema & Spa & Piscine
Entire Place • 4 bedrooms
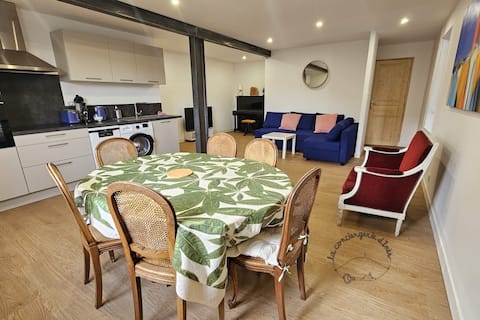
Le Noyer 1 #Parking#Quiet#Terrace
Entire Place • 2 bedrooms
The 135, spacious accommodation between town and volcanoes
Entire Place • 2 bedrooms
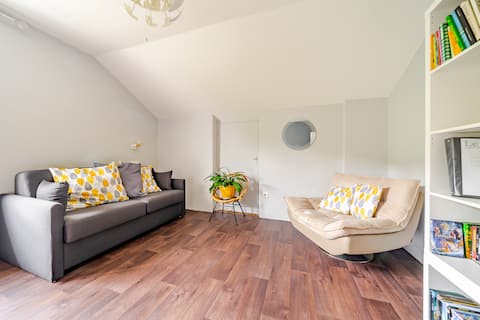
Loft 55m2, garden, view, parking, self check-in
Entire Place • 1 bedroom
Note: Performance varies based on location, size, amenities, seasonality, and management quality. Data reflects the past 12 months.
Top Performing Airbnb Hosts in Ceyrat (2025)
Learn from the best! This table showcases top-performing Airbnb hosts in Ceyrat based on the number of properties managed and estimated total revenue over the past year. Analyze their scale and performance metrics.
| Host Name | Properties | Grossing Revenue | Stay Reviews | Avg Rating |
|---|---|---|---|---|
| Sandra | 1 | $44,708 | 7 | 4.86/5.0 |
| Bienvenue Chez Nous | 1 | $44,508 | 26 | 4.81/5.0 |
| Isabelle | 4 | $36,577 | 291 | 4.86/5.0 |
| La Conciergerie D'Inès | 2 | $30,194 | 46 | 4.71/5.0 |
| Ginny | 2 | $24,960 | 18 | 4.85/5.0 |
| Frederic | 1 | $20,580 | 5 | 5.00/5.0 |
| Anne | 4 | $20,554 | 55 | 2.47/5.0 |
| Aurelie | 1 | $18,072 | 57 | 4.96/5.0 |
| Stéphanie | 1 | $16,873 | 26 | 4.96/5.0 |
| Lorène | 2 | $15,011 | 28 | 4.72/5.0 |
Analyzing the strategies of top hosts, such as their property selection, pricing, and guest communication, can offer valuable lessons for optimizing your own Airbnb operations in Ceyrat.
Dive Deeper: Advanced Ceyrat STR Market Data (2025)
Ready to unlock more insights? AirROI provides access to advanced metrics and comprehensive Airbnb data for Ceyrat. Explore detailed analytics beyond this report to refine your investment strategy, optimize pricing, and maximize your vacation rental profits.
Explore Advanced MetricsCeyrat Short-Term Rental Market Composition (2025): Property & Room Types
Room Type Distribution
Property Type Distribution
Market Composition Insights for Ceyrat
- The Ceyrat Airbnb market composition is heavily skewed towards Entire Home/Apt listings, which make up 68.8% of the 32 active rentals. This indicates strong guest preference for privacy and space.
- However, a notable 31.3% share for Private Rooms suggests opportunities for budget-conscious travelers or hosts renting out spare rooms.
- Looking at the property type distribution in Ceyrat, House properties are the most common (43.8%), reflecting the local real estate landscape.
- Houses represent a significant 43.8% portion, catering likely to families or larger groups.
- The presence of 18.8% Hotel/Boutique listings indicates integration with traditional hospitality.
- Smaller segments like others (combined 3.1%) offer potential for unique stay experiences.
Ceyrat Airbnb Room Capacity Analysis (2025): Bedroom Distribution
Distribution of Listings by Number of Bedrooms
Room Capacity Insights for Ceyrat
- The dominant room capacity in Ceyrat is 2 bedrooms listings, making up 37.5% of the market. This suggests a strong demand for properties suitable for couples or solo travelers.
- Together, 2 bedrooms and 1 bedroom properties represent 59.4% of the active Airbnb listings in Ceyrat, indicating a high concentration in these sizes.
- A significant 21.9% of listings offer 3+ bedrooms, catering to larger groups and families seeking more space in Ceyrat.
Ceyrat Vacation Rental Guest Capacity Trends (2025)
Distribution of Listings by Guest Capacity
Guest Capacity Insights for Ceyrat
- The most common guest capacity trend in Ceyrat vacation rentals is listings accommodating 4 guests (25%). This suggests the primary traveler segment is likely small families or groups.
- Properties designed for 4 guests and 2 guests dominate the Ceyrat STR market, accounting for 40.6% of listings.
- 28.1% of properties accommodate 6+ guests, serving the market segment for larger families or group travel in Ceyrat.
- On average, properties in Ceyrat are equipped to host 3.6 guests.
Ceyrat Airbnb Booking Patterns (2025): Available vs. Booked Days
Available Days Distribution
Booked Days Distribution
Booking Pattern Insights for Ceyrat
- The most common availability pattern in Ceyrat falls within the 271-366 days range, representing 34.4% of listings. This suggests many properties have significant open periods on their calendars.
- Approximately 68.8% of listings show high availability (181+ days open annually), indicating potential for increased bookings or specific owner usage patterns.
- For booked days, the 91-180 days range is most frequent in Ceyrat (34.4%), reflecting common guest stay durations or potential owner blocking patterns.
- A notable 31.2% of properties secure long booking periods (181+ days booked per year), highlighting successful long-term rental strategies or significant owner usage.
Ceyrat Airbnb Minimum Stay Requirements Analysis
Distribution of Listings by Minimum Night Requirement
1 Night
14 listings
43.8% of total
2 Nights
10 listings
31.3% of total
3 Nights
3 listings
9.4% of total
4-6 Nights
3 listings
9.4% of total
7-29 Nights
2 listings
6.3% of total
Key Insights
- The most prevalent minimum stay requirement in Ceyrat is 1 Night, adopted by 43.8% of listings. This highlights the market's preference for shorter, flexible bookings.
- A strong majority (75.1%) of the Ceyrat Airbnb data shows acceptance of very short stays (1-2 nights), indicating a dynamic, high-turnover market.
Recommendations
- Align with the market by considering a 1 Night minimum stay, as 43.8% of Ceyrat hosts use this setting.
- Adjust minimum nights based on seasonality – potentially shorter during low season and longer during peak demand periods in Ceyrat.
Ceyrat Airbnb Cancellation Policy Trends Analysis (2025)
Flexible
12 listings
40% of total
Moderate
10 listings
33.3% of total
Firm
4 listings
13.3% of total
Strict
4 listings
13.3% of total
Cancellation Policy Insights for Ceyrat
- The prevailing Airbnb cancellation policy trend in Ceyrat is Flexible, used by 40% of listings.
- The market strongly favors guest-friendly terms, with 73.3% of listings offering Flexible or Moderate policies. This suggests guests in Ceyrat may expect booking flexibility.
Recommendations for Hosts
- Consider adopting a Flexible policy to align with the 40% market standard in Ceyrat.
- Using a Strict policy might deter some guests, as only 13.3% of listings use it. Evaluate if potential revenue protection outweighs possible lower booking rates.
- Regularly review your cancellation policy against competitors and market demand shifts in Ceyrat.
Ceyrat STR Booking Lead Time Analysis (2025)
Average Booking Lead Time by Month
Booking Lead Time Insights for Ceyrat
- The overall average booking lead time for vacation rentals in Ceyrat is 50 days.
- Guests book furthest in advance for stays during July (average 90 days), likely coinciding with peak travel demand or local events.
- The shortest booking windows occur for stays in February (average 18 days), indicating more last-minute travel plans during this time.
- Seasonally, Summer (74 days avg.) sees the longest lead times, while Winter (23 days avg.) has the shortest, reflecting typical travel planning cycles.
Recommendations for Hosts
- Use the overall average lead time (50 days) as a baseline for your pricing and availability strategy in Ceyrat.
- For July stays, consider implementing length-of-stay discounts or slightly higher rates for bookings made less than 90 days out to capitalize on advance planning.
- Target marketing efforts for the Summer season well in advance (at least 74 days) to capture early planners.
- Monitor your own booking lead times against these Ceyrat averages to identify opportunities for dynamic pricing adjustments.
Popular & Essential Airbnb Amenities in Ceyrat (2025)
Amenity Prevalence
Amenity Insights for Ceyrat
- Essential amenities in Ceyrat that guests expect include: Wifi, Heating. Lacking these (any) could significantly impact bookings.
- Popular amenities like Kitchen, Hot water, Free parking on premises are common but not universal. Offering these can provide a competitive edge.
Recommendations for Hosts
- Ensure your listing includes all essential amenities for Ceyrat: Wifi, Heating.
- Prioritize adding missing essentials: Wifi, Heating.
- Consider adding popular differentiators like Kitchen or Hot water to increase appeal.
- Highlight unique or less common amenities you offer (e.g., hot tub, dedicated workspace, EV charger) in your listing description and photos.
- Regularly check competitor amenities in Ceyrat to stay competitive.
Ceyrat Airbnb Guest Demographics & Profile Analysis (2025)
Guest Profile Summary for Ceyrat
- The typical guest profile for Airbnb in Ceyrat consists of primarily domestic travelers (93%), often arriving from nearby Lyon, typically belonging to the Post-2000s (Gen Z/Alpha) group (50%), primarily speaking French or English.
- Domestic travelers account for 92.8% of guests.
- Key international markets include France (92.8%) and United Kingdom (1.7%).
- Top languages spoken are French (54.2%) followed by English (31.3%).
- A significant demographic segment is the Post-2000s (Gen Z/Alpha) group, representing 50% of guests.
Recommendations for Hosts
- Target domestic marketing efforts towards travelers from Lyon and Paris.
- Tailor amenities and listing descriptions to appeal to the dominant Post-2000s (Gen Z/Alpha) demographic (e.g., highlight fast WiFi, smart home features, local guides).
- Highlight unique local experiences or amenities relevant to the primary guest profile.
- Consider seasonal promotions aligned with peak travel times for key origin markets.
Nearby Short-Term Rental Market Comparison
How does the Ceyrat Airbnb market stack up against its neighbors? Compare key performance metrics like average monthly revenue, ADR, and occupancy rates in surrounding areas to understand the broader regional STR landscape.
| Market | Active Properties | Monthly Revenue | Daily Rate | Avg. Occupancy |
|---|---|---|---|---|
| Épinac | 14 | $5,147 | $333.01 | 37% |
| Divajeu | 19 | $3,941 | $410.65 | 42% |
| Saint-Germain-au-Mont-d'Or | 10 | $3,928 | $316.02 | 40% |
| Puligny-Montrachet | 11 | $3,908 | $398.00 | 44% |
| Dommartin | 11 | $3,905 | $327.00 | 36% |
| Juliénas | 11 | $3,378 | $292.32 | 46% |
| Courzieu | 11 | $3,267 | $287.83 | 52% |
| Vanosc | 13 | $3,072 | $224.52 | 44% |
| Bligny-lès-Beaune | 24 | $2,930 | $233.89 | 44% |
| Romanèche-Thorins | 13 | $2,817 | $239.98 | 43% |