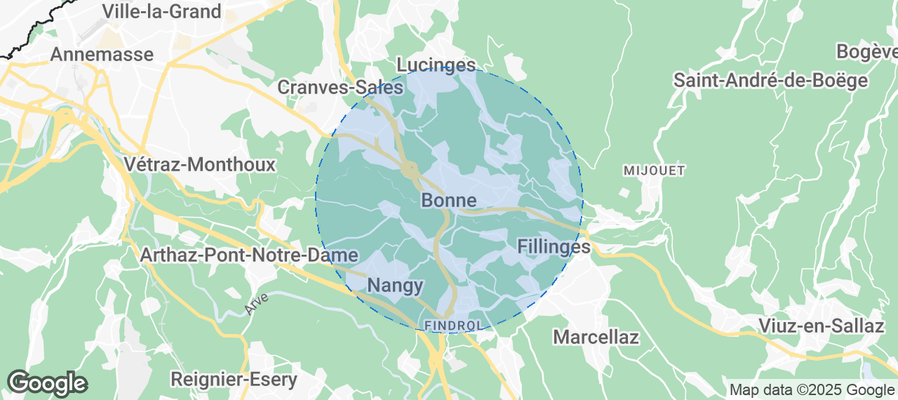
Bonne Airbnb Market Analysis 2025: Short Term Rental Data & Vacation Rental Statistics in Auvergne-Rhône-Alpes, France
Is Airbnb profitable in Bonne in 2025? Explore comprehensive Airbnb analytics for Bonne, Auvergne-Rhône-Alpes, France to uncover income potential. This 2025 STR market report for Bonne, based on AirROI data from April 2024 to March 2025, reveals key trends in the niche market of 22 active listings.
Whether you're considering an Airbnb investment in Bonne, optimizing your existing vacation rental, or exploring rental arbitrage opportunities, understanding the Bonne Airbnb data is crucial. Leveraging the low regulation environment is key to maximizing your short term rental income potential. Let's dive into the specifics.
Key Bonne Airbnb Performance Metrics Overview
Monthly Airbnb Revenue Variations & Income Potential in Bonne (2025)
Understanding the monthly revenue variations for Airbnb listings in Bonne is key to maximizing your short term rental income potential. Seasonality significantly impacts earnings. Our analysis, based on data from the past 12 months, shows that the peak revenue month for STRs in Bonne is typically August, while November often presents the lowest earnings, highlighting opportunities for strategic pricing adjustments during shoulder and low seasons. Explore the typical Airbnb income in Bonne across different performance tiers:
- Best-in-class properties (Top 10%) achieve $6,242+ monthly, often utilizing dynamic pricing and superior guest experiences.
- Strong performing properties (Top 25%) earn $3,060 or more, indicating effective management and desirable locations/amenities.
- Typical properties (Median) generate around $1,750 per month, representing the average market performance.
- Entry-level properties (Bottom 25%) see earnings around $1,021, often with potential for optimization.
Average Monthly Airbnb Earnings Trend in Bonne
Bonne Airbnb Occupancy Rate Trends (2025)
Maximize your bookings by understanding the Bonne STR occupancy trends. Seasonal demand shifts significantly influence how often properties are booked. Typically, Augustsees the highest demand (peak season occupancy), while November experiences the lowest (low season). Effective strategies, like adjusting minimum stays or offering promotions, can boost occupancy during slower periods. Here's how different property tiers perform in Bonne:
- Best-in-class properties (Top 10%) achieve 89%+ occupancy, indicating high desirability and potentially optimized availability.
- Strong performing properties (Top 25%) maintain 77% or higher occupancy, suggesting good market fit and guest satisfaction.
- Typical properties (Median) have an occupancy rate around 54%.
- Entry-level properties (Bottom 25%) average 35% occupancy, potentially facing higher vacancy.
Average Monthly Occupancy Rate Trend in Bonne
Average Daily Rate (ADR) Airbnb Trends in Bonne (2025)
Effective short term rental pricing strategy in Bonne involves understanding monthly ADR fluctuations. The Average Daily Rate (ADR) for Airbnb in Bonne typically peaks in February and dips lowest during October. Leveraging Airbnb dynamic pricing tools or strategies based on this seasonality can significantly boost revenue. Here's a look at the typical nightly rates achieved:
- Best-in-class properties (Top 10%) command rates of $251+ per night, often due to premium features or locations.
- Strong performing properties (Top 25%) achieve nightly rates of $178 or more.
- Typical properties (Median) charge around $85 per night.
- Entry-level properties (Bottom 25%) earn around $62 per night.
Average Daily Rate (ADR) Trend by Month in Bonne
Get Live Bonne Market Intelligence 👇
Explore Real-time Analytics
Airbnb Seasonality Analysis & Trends in Bonne (2025)
Peak Season (August, May, April)
- Revenue averages $3,618 per month
- Occupancy rates average 70.0%
- Daily rates average $120
Shoulder Season
- Revenue averages $2,523 per month
- Occupancy maintains around 52.5%
- Daily rates hold near $128
Low Season (January, October, November)
- Revenue drops to average $1,975 per month
- Occupancy decreases to average 44.2%
- Daily rates adjust to average $128
Seasonality Insights for Bonne
- The Airbnb seasonality in Bonne shows highly seasonal trends requiring careful strategy. While the sections above show seasonal averages, it's also insightful to look at the extremes:
- During the high season, the absolute peak month showcases Bonne's highest earning potential, with monthly revenues capable of climbing to $3,830, occupancy reaching a high of 74.0%, and ADRs peaking at $136.
- Conversely, the slowest single month of the year, typically falling within the low season, marks the market's lowest point. In this month, revenue might dip to $1,956, occupancy could drop to 41.3%, and ADRs may adjust down to $117.
- Understanding both the seasonal averages and these monthly peaks and troughs in revenue, occupancy, and ADR is crucial for maximizing your Airbnb profit potential in Bonne.
Seasonal Strategies for Maximizing Profit
- Peak Season: Maximize revenue through premium pricing and potentially longer minimum stays. Ensure high availability.
- Low Season: Offer competitive pricing, special promotions (e.g., extended stay discounts), and flexible cancellation policies. Target off-season travelers like remote workers or budget-conscious guests.
- Shoulder Seasons: Implement dynamic pricing that balances peak and low rates. Target weekend travelers or specific events. Offer slightly more flexible terms than peak season.
- Regularly analyze your own performance against these Bonne seasonality benchmarks and adjust your pricing and availability strategy accordingly.
Best Areas for Airbnb Investment in Bonne (2025)
Exploring the top neighborhoods for short-term rentals in Bonne? This section highlights key areas, outlining why they are attractive for hosts and guests, along with notable local attractions. Consider these locations based on your target guest profile and investment strategy.
| Neighborhood / Area | Why Host Here? (Target Guests & Appeal) | Key Attractions & Landmarks |
|---|---|---|
| Le Puy-en-Velay | The capital of the Haute-Loire department, renowned for its historical architecture and vibrant cultural scene. It's a popular stop for hikers on the Camino de Santiago and attracts tourists interested in history and nature. | Saint-Michel d'Aiguilhe, Puy-en-Velay Cathedral, Château de Rocher, Le Temple de Saint-Joseph, Musee Crozatier |
| Saint-Étienne | A hub for design and innovation, Saint-Étienne offers a unique mix of industrial heritage and vibrant art scene. It's attractive for visitors interested in contemporary culture and innovation. | Cité du Design, Museum of Modern Art, Saint-Étienne Cathedral, Parc de l'Europe, Les Halles de Saint-Étienne |
| Vienne | Rich in Roman history and known for its ancient monuments, Vienne attracts tourists interested in archaeology and history. The town's charming streets and cultural events offer a picturesque stay. | The Roman Theatre of Vienne, Temple of Augustus and Livia, Vienne Cathedral, The archaeological museum, Vienne Jazz Festival |
| Annonay | Birthplace of the Montgolfier brothers and known for its beautiful natural surroundings. Annonay appeals to eco-tourists and those looking for a more laid-back experience in nature. | Caves of La Savournon, Parc de la Déôme, Museum of the Balloon, Les Gorges de la Daronne, Montgolfière festival |
| Aubenas | Located in the Ardèche department, Aubenas is known for its charming medieval center and beautiful landscapes. It's a popular spot for visitors seeking outdoor adventures. | Château d'Aubenas, Aven d'Orgnac, Gorges de l'Ardeche, Mont Gerbier de Jonc, Canoeing and kayaking experiences |
| Bourg-en-Bresse | Known for its gastronomy and beautiful buildings, Bourg-en-Bresse attracts food lovers and those interested in local culture and traditions. | Royal Monastery of Brou, Bourg-en-Bresse Cathedral, Bresse Poultry Museum, Parc de la Tête d'Or, local markets |
| Tournon-sur-Rhône | A picturesque town on the banks of the Rhône River, known for its vineyards and stunning landscapes. Great for wine lovers and those who enjoy scenic views. | Tournon Castle, Cité du Chocolat, Vineyard tours, Rhône River cruises, Historic town center |
| Thiers | Known as the capital of cutlery, Thiers offers a unique glimpse into France's craftsmanship. The town attracts visitors interested in local production and history. | The Cutlery Museum, Château de Villeroy, medieval streets, Colline des Moulins, Local artisan shops |
Understanding Airbnb License Requirements & STR Laws in Bonne (2025)
While Bonne, Auvergne-Rhône-Alpes, France currently shows low STR regulations, specific Airbnb license requirements might still exist or change. Always verify the latest short term rental regulations and Airbnb license requirements directly with local government authorities for Bonne to ensure full compliance before hosting.
(Source: AirROI data, 2025, based on 5% licensed listings)
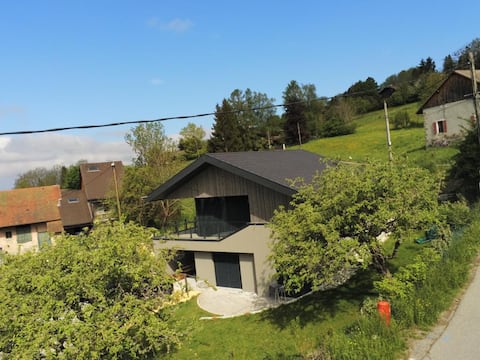
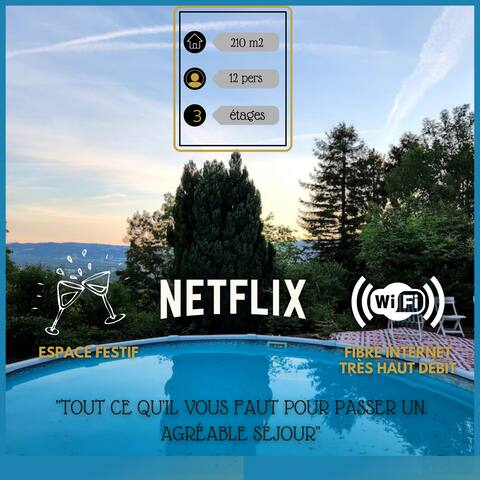
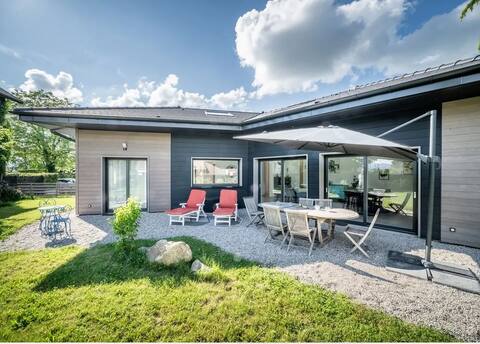
Top Performing Airbnb Properties in Bonne (2025)
Benchmark your potential! Explore examples of top-performing Airbnb properties in Bonnebased on Trailing Twelve Month (TTM) revenue. Analyze their characteristics, revenue, occupancy rate, and ADR to understand what drives success in this market.
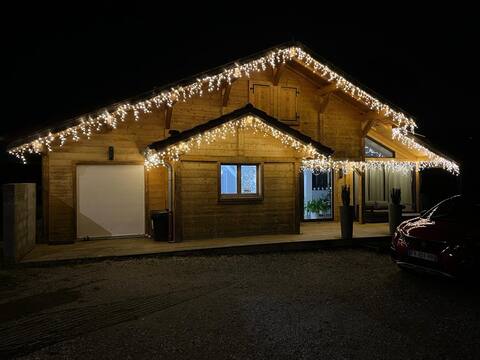
Hot tub & sauna chalet - Between lakes & mountains
Entire Place • 4 bedrooms
L 'Écrin Savoyard
Entire Place • 5 bedrooms
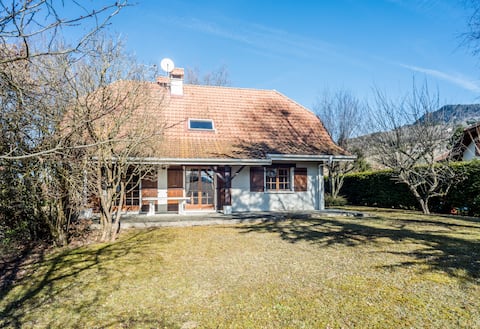
Maison L'Esprit du Cèdre 8 people
Entire Place • 3 bedrooms
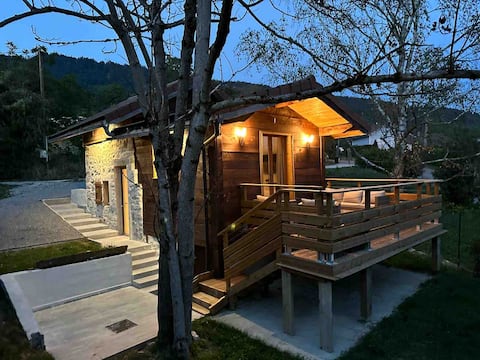
Beautiful chalet between lakes and mountains
Entire Place • 3 bedrooms
Charming 4 BR home sleeps 7...just outside Geneva
Entire Place • 4 bedrooms
The little cottage
Entire Place • 1 bedroom
Note: Performance varies based on location, size, amenities, seasonality, and management quality. Data reflects the past 12 months.
Top Performing Airbnb Hosts in Bonne (2025)
Learn from the best! This table showcases top-performing Airbnb hosts in Bonne based on the number of properties managed and estimated total revenue over the past year. Analyze their scale and performance metrics.
| Host Name | Properties | Grossing Revenue | Stay Reviews | Avg Rating |
|---|---|---|---|---|
| Olivia & Aurelien | 1 | $122,892 | 68 | 5.00/5.0 |
| Adrien | 3 | $49,012 | 138 | 4.82/5.0 |
| Valerie | 1 | $48,732 | 10 | 5.00/5.0 |
| Emilie | 1 | $43,480 | 26 | 4.96/5.0 |
| Delphine | 1 | $41,951 | 28 | 4.89/5.0 |
| Fouad | 1 | $33,347 | 51 | 4.80/5.0 |
| Youssef | 1 | $32,619 | 146 | 4.90/5.0 |
| Host #68566025 | 1 | $23,064 | 6 | 4.83/5.0 |
| Emma | 1 | $16,973 | 87 | 4.93/5.0 |
| Christiane | 1 | $14,339 | 30 | 4.70/5.0 |
Analyzing the strategies of top hosts, such as their property selection, pricing, and guest communication, can offer valuable lessons for optimizing your own Airbnb operations in Bonne.
Dive Deeper: Advanced Bonne STR Market Data (2025)
Ready to unlock more insights? AirROI provides access to advanced metrics and comprehensive Airbnb data for Bonne. Explore detailed analytics beyond this report to refine your investment strategy, optimize pricing, and maximize your vacation rental profits.
Explore Advanced MetricsBonne Short-Term Rental Market Composition (2025): Property & Room Types
Room Type Distribution
Property Type Distribution
Market Composition Insights for Bonne
- The Bonne Airbnb market composition is heavily skewed towards Entire Home/Apt listings, which make up 86.4% of the 22 active rentals. This indicates strong guest preference for privacy and space.
- Looking at the property type distribution in Bonne, Apartment/Condo properties are the most common (45.5%), reflecting the local real estate landscape.
- Houses represent a significant 45.5% portion, catering likely to families or larger groups.
- Smaller segments like outdoor/unique, others (combined 9.0%) offer potential for unique stay experiences.
Bonne Airbnb Room Capacity Analysis (2025): Bedroom Distribution
Distribution of Listings by Number of Bedrooms
Room Capacity Insights for Bonne
- The dominant room capacity in Bonne is 1 bedroom listings, making up 40.9% of the market. This suggests a strong demand for properties suitable for couples or solo travelers.
- Together, 1 bedroom and 4 bedrooms properties represent 59.1% of the active Airbnb listings in Bonne, indicating a high concentration in these sizes.
- A significant 40.9% of listings offer 3+ bedrooms, catering to larger groups and families seeking more space in Bonne.
Bonne Vacation Rental Guest Capacity Trends (2025)
Distribution of Listings by Guest Capacity
Guest Capacity Insights for Bonne
- The most common guest capacity trend in Bonne vacation rentals is listings accommodating 2 guests (36.4%). This suggests the primary traveler segment is likely couples or solo travelers.
- Properties designed for 2 guests and 8+ guests dominate the Bonne STR market, accounting for 54.6% of listings.
- 40.9% of properties accommodate 6+ guests, serving the market segment for larger families or group travel in Bonne.
- On average, properties in Bonne are equipped to host 4.4 guests.
Bonne Airbnb Booking Patterns (2025): Available vs. Booked Days
Available Days Distribution
Booked Days Distribution
Booking Pattern Insights for Bonne
- The most common availability pattern in Bonne falls within the 271-366 days range, representing 40.9% of listings. This suggests many properties have significant open periods on their calendars.
- Approximately 68.2% of listings show high availability (181+ days open annually), indicating potential for increased bookings or specific owner usage patterns.
- For booked days, the 31-90 days range is most frequent in Bonne (36.4%), reflecting common guest stay durations or potential owner blocking patterns.
- A notable 31.8% of properties secure long booking periods (181+ days booked per year), highlighting successful long-term rental strategies or significant owner usage.
Bonne Airbnb Minimum Stay Requirements Analysis
Distribution of Listings by Minimum Night Requirement
1 Night
2 listings
10% of total
2 Nights
6 listings
30% of total
3 Nights
3 listings
15% of total
4-6 Nights
4 listings
20% of total
7-29 Nights
2 listings
10% of total
30+ Nights
3 listings
15% of total
Key Insights
- The most prevalent minimum stay requirement in Bonne is 2 Nights, adopted by 30% of listings. This highlights the market's preference for shorter, flexible bookings.
- A significant segment (15%) caters to monthly stays (30+ nights) in Bonne, pointing to opportunities in the extended-stay market.
Recommendations
- Align with the market by considering a 2 Nights minimum stay, as 30% of Bonne hosts use this setting.
- If feasible, allowing 1-night stays, especially midweek or during low season, could capture last-minute bookings, as only 10% currently do.
- Explore offering discounts for stays of 30+ nights to attract the 15% of the market seeking extended stays.
- Adjust minimum nights based on seasonality – potentially shorter during low season and longer during peak demand periods in Bonne.
Bonne Airbnb Cancellation Policy Trends Analysis (2025)
Flexible
4 listings
25% of total
Moderate
7 listings
43.8% of total
Firm
1 listings
6.3% of total
Strict
4 listings
25% of total
Cancellation Policy Insights for Bonne
- The prevailing Airbnb cancellation policy trend in Bonne is Moderate, used by 43.8% of listings.
- There's a relatively balanced mix between guest-friendly (68.8%) and stricter (31.3%) policies, offering choices for different guest needs.
Recommendations for Hosts
- Consider adopting a Moderate policy to align with the 43.8% market standard in Bonne.
- Regularly review your cancellation policy against competitors and market demand shifts in Bonne.
Bonne STR Booking Lead Time Analysis (2025)
Average Booking Lead Time by Month
Booking Lead Time Insights for Bonne
- The overall average booking lead time for vacation rentals in Bonne is 32 days.
- Guests book furthest in advance for stays during July (average 69 days), likely coinciding with peak travel demand or local events.
- The shortest booking windows occur for stays in October (average 25 days), indicating more last-minute travel plans during this time.
- Seasonally, Summer (55 days avg.) sees the longest lead times, while Fall (31 days avg.) has the shortest, reflecting typical travel planning cycles.
Recommendations for Hosts
- Use the overall average lead time (32 days) as a baseline for your pricing and availability strategy in Bonne.
- For July stays, consider implementing length-of-stay discounts or slightly higher rates for bookings made less than 69 days out to capitalize on advance planning.
- Target marketing efforts for the Summer season well in advance (at least 55 days) to capture early planners.
- Monitor your own booking lead times against these Bonne averages to identify opportunities for dynamic pricing adjustments.
Popular & Essential Airbnb Amenities in Bonne (2025)
Amenity Prevalence
Amenity Insights for Bonne
- Essential amenities in Bonne that guests expect include: Hot water, Wifi, Free parking on premises, Heating, Kitchen, Smoke alarm. Lacking these (any) could significantly impact bookings.
- Popular amenities like TV, Hair dryer, Essentials are common but not universal. Offering these can provide a competitive edge.
Recommendations for Hosts
- Ensure your listing includes all essential amenities for Bonne: Hot water, Wifi, Free parking on premises, Heating, Kitchen, Smoke alarm.
- Prioritize adding missing essentials: Heating, Kitchen, Smoke alarm.
- Consider adding popular differentiators like TV or Hair dryer to increase appeal.
- Highlight unique or less common amenities you offer (e.g., hot tub, dedicated workspace, EV charger) in your listing description and photos.
- Regularly check competitor amenities in Bonne to stay competitive.
Bonne Airbnb Guest Demographics & Profile Analysis (2025)
Guest Profile Summary for Bonne
- The typical guest profile for Airbnb in Bonne consists of primarily domestic travelers (69%), often arriving from nearby Paris, typically belonging to the Post-2000s (Gen Z/Alpha) group (50%), primarily speaking French or English.
- Domestic travelers account for 69.1% of guests.
- Key international markets include France (69.1%) and Germany (7.4%).
- Top languages spoken are French (33.5%) followed by English (32.6%).
- A significant demographic segment is the Post-2000s (Gen Z/Alpha) group, representing 50% of guests.
Recommendations for Hosts
- Target domestic marketing efforts towards travelers from Paris and Lyon.
- Tailor amenities and listing descriptions to appeal to the dominant Post-2000s (Gen Z/Alpha) demographic (e.g., highlight fast WiFi, smart home features, local guides).
- Highlight unique local experiences or amenities relevant to the primary guest profile.
- Consider seasonal promotions aligned with peak travel times for key origin markets.
Nearby Short-Term Rental Market Comparison
How does the Bonne Airbnb market stack up against its neighbors? Compare key performance metrics like average monthly revenue, ADR, and occupancy rates in surrounding areas to understand the broader regional STR landscape.
| Market | Active Properties | Monthly Revenue | Daily Rate | Avg. Occupancy |
|---|---|---|---|---|
| Lauterbrunnen | 525 | $7,079 | $546.45 | 54% |
| La Rivière-Enverse | 17 | $5,972 | $624.02 | 41% |
| Les Clefs | 30 | $5,741 | $323.11 | 44% |
| Matten bei Interlaken | 52 | $5,674 | $316.63 | 63% |
| Iseltwald | 14 | $5,491 | $331.95 | 58% |
| Habkern | 13 | $5,382 | $344.74 | 50% |
| Interlaken | 288 | $4,987 | $310.52 | 56% |
| Zermatt | 734 | $4,604 | $463.00 | 46% |
| Oberhofen am Thunersee | 24 | $4,572 | $265.94 | 55% |
| Sigriswil | 99 | $4,371 | $271.90 | 58% |