Allinges Airbnb Market Analysis 2025: Short Term Rental Data & Vacation Rental Statistics in Auvergne-Rhône-Alpes, France
Is Airbnb profitable in Allinges in 2025? Explore comprehensive Airbnb analytics for Allinges, Auvergne-Rhône-Alpes, France to uncover income potential. This 2025 STR market report for Allinges, based on AirROI data from April 2024 to March 2025, reveals key trends in the niche market of 29 active listings.
Whether you're considering an Airbnb investment in Allinges, optimizing your existing vacation rental, or exploring rental arbitrage opportunities, understanding the Allinges Airbnb data is crucial. Understanding the local regulations is key to maximizing your short term rental income potential. Let's dive into the specifics.
Key Allinges Airbnb Performance Metrics Overview
Monthly Airbnb Revenue Variations & Income Potential in Allinges (2025)
Understanding the monthly revenue variations for Airbnb listings in Allinges is key to maximizing your short term rental income potential. Seasonality significantly impacts earnings. Our analysis, based on data from the past 12 months, shows that the peak revenue month for STRs in Allinges is typically August, while March often presents the lowest earnings, highlighting opportunities for strategic pricing adjustments during shoulder and low seasons. Explore the typical Airbnb income in Allinges across different performance tiers:
- Best-in-class properties (Top 10%) achieve $3,129+ monthly, often utilizing dynamic pricing and superior guest experiences.
- Strong performing properties (Top 25%) earn $2,192 or more, indicating effective management and desirable locations/amenities.
- Typical properties (Median) generate around $1,320 per month, representing the average market performance.
- Entry-level properties (Bottom 25%) see earnings around $793, often with potential for optimization.
Average Monthly Airbnb Earnings Trend in Allinges
Allinges Airbnb Occupancy Rate Trends (2025)
Maximize your bookings by understanding the Allinges STR occupancy trends. Seasonal demand shifts significantly influence how often properties are booked. Typically, Augustsees the highest demand (peak season occupancy), while November experiences the lowest (low season). Effective strategies, like adjusting minimum stays or offering promotions, can boost occupancy during slower periods. Here's how different property tiers perform in Allinges:
- Best-in-class properties (Top 10%) achieve 80%+ occupancy, indicating high desirability and potentially optimized availability.
- Strong performing properties (Top 25%) maintain 65% or higher occupancy, suggesting good market fit and guest satisfaction.
- Typical properties (Median) have an occupancy rate around 47%.
- Entry-level properties (Bottom 25%) average 29% occupancy, potentially facing higher vacancy.
Average Monthly Occupancy Rate Trend in Allinges
Average Daily Rate (ADR) Airbnb Trends in Allinges (2025)
Effective short term rental pricing strategy in Allinges involves understanding monthly ADR fluctuations. The Average Daily Rate (ADR) for Airbnb in Allinges typically peaks in August and dips lowest during March. Leveraging Airbnb dynamic pricing tools or strategies based on this seasonality can significantly boost revenue. Here's a look at the typical nightly rates achieved:
- Best-in-class properties (Top 10%) command rates of $155+ per night, often due to premium features or locations.
- Strong performing properties (Top 25%) achieve nightly rates of $126 or more.
- Typical properties (Median) charge around $86 per night.
- Entry-level properties (Bottom 25%) earn around $64 per night.
Average Daily Rate (ADR) Trend by Month in Allinges
Get Live Allinges Market Intelligence 👇

Explore Real-time Analytics
Airbnb Seasonality Analysis & Trends in Allinges (2025)
Peak Season (August, July, June)
- Revenue averages $2,329 per month
- Occupancy rates average 61.3%
- Daily rates average $116
Shoulder Season
- Revenue averages $1,575 per month
- Occupancy maintains around 45.8%
- Daily rates hold near $106
Low Season (March, October, November)
- Revenue drops to average $1,145 per month
- Occupancy decreases to average 36.2%
- Daily rates adjust to average $103
Seasonality Insights for Allinges
- The Airbnb seasonality in Allinges shows highly seasonal trends requiring careful strategy. While the sections above show seasonal averages, it's also insightful to look at the extremes:
- During the high season, the absolute peak month showcases Allinges's highest earning potential, with monthly revenues capable of climbing to $2,570, occupancy reaching a high of 68.7%, and ADRs peaking at $116.
- Conversely, the slowest single month of the year, typically falling within the low season, marks the market's lowest point. In this month, revenue might dip to $1,018, occupancy could drop to 32.9%, and ADRs may adjust down to $97.
- Understanding both the seasonal averages and these monthly peaks and troughs in revenue, occupancy, and ADR is crucial for maximizing your Airbnb profit potential in Allinges.
Seasonal Strategies for Maximizing Profit
- Peak Season: Maximize revenue through premium pricing and potentially longer minimum stays. Ensure high availability.
- Low Season: Offer competitive pricing, special promotions (e.g., extended stay discounts), and flexible cancellation policies. Target off-season travelers like remote workers or budget-conscious guests.
- Shoulder Seasons: Implement dynamic pricing that balances peak and low rates. Target weekend travelers or specific events. Offer slightly more flexible terms than peak season.
- Regularly analyze your own performance against these Allinges seasonality benchmarks and adjust your pricing and availability strategy accordingly.
Best Areas for Airbnb Investment in Allinges (2025)
Exploring the top neighborhoods for short-term rentals in Allinges? This section highlights key areas, outlining why they are attractive for hosts and guests, along with notable local attractions. Consider these locations based on your target guest profile and investment strategy.
| Neighborhood / Area | Why Host Here? (Target Guests & Appeal) | Key Attractions & Landmarks |
|---|---|---|
| Les Sources de Lavey | A serene location known for its natural hot springs and wellness retreats, ideal for tourists looking to relax and rejuvenate in a tranquil setting. | Lavey-les-Bains, Thermal baths, Nature walks, Spa facilities, Mountain scenery |
| Château d'Allinges | Known for its historic ruins and stunning views, this area attracts visitors interested in history and beautiful landscapes. | Château d'Allinges ruins, Panoramic views of Lake Geneva, Hiking trails, Nearby vineyards |
| Thonon-les-Bains | A popular lakeside town offering a mix of cultural experiences, beautiful waterfront, and outdoor activities. | Lake Geneva promenade, Thonon-les-Bains Market, Château de Ripaille, Parc des Jardins de l'Eau, Aquarium de la Ville |
| Evian-les-Bains | Famous for its mineral water and luxurious spa experiences, it attracts health-conscious visitors and those seeking relaxation. | Evian Water Sources, Spa of Evian, Lakeside beaches, Evian Casino, Golf courses |
| Ampus | A charming Provençal village known for its local markets and stunning countryside, perfect for visitors seeking an authentic experience. | Local markets, Provencal cuisine, Nature hikes, Vineyards, Cultural festivals |
| Les Gets | A picturesque ski resort that attracts winter sports enthusiasts and offers year-round outdoor activities, perfect for adventure seekers. | Ski slopes, Mountain biking trails, Hiking paths, Les Gets mountain gondola, Local restaurants |
| Yvoire | A medieval village on the shores of Lake Geneva, famed for its floral decorations and stunning scenery, attracting history and nature lovers alike. | Yvoire Village, Garden of Five Senses, Lake Geneva views, Historic buildings, Art galleries |
| Val d'Illiez | A beautiful valley in the Pre-Alps known for its thermal baths and outdoor activities, appealing to both adventure and relaxation seekers. | Thermal baths, Hiking and biking trails, Skiing in winter, Gourmet restaurants, Nature spots |
Understanding Airbnb License Requirements & STR Laws in Allinges (2025)
With 14% of listings showing registration in 2025, understanding potential Airbnb license requirements is crucial in Allinges. Always verify the latest short term rental regulations and Airbnb license requirements directly with local government authorities for Allinges to ensure full compliance before hosting.
(Source: AirROI data, 2025, based on 14% licensed listings)
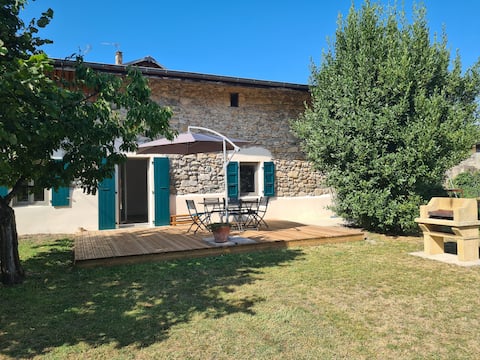
Top Performing Airbnb Properties in Allinges (2025)
Benchmark your potential! Explore examples of top-performing Airbnb properties in Allingesbased on Trailing Twelve Month (TTM) revenue. Analyze their characteristics, revenue, occupancy rate, and ADR to understand what drives success in this market.

Peaceful flat halfway Geneva lake and ski fields
Entire Place • 2 bedrooms
In the heart of the village of Mésinges
Entire Place • 2 bedrooms
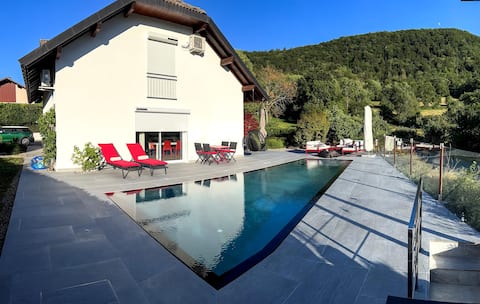
Cozy house with nice view
Entire Place • 3 bedrooms
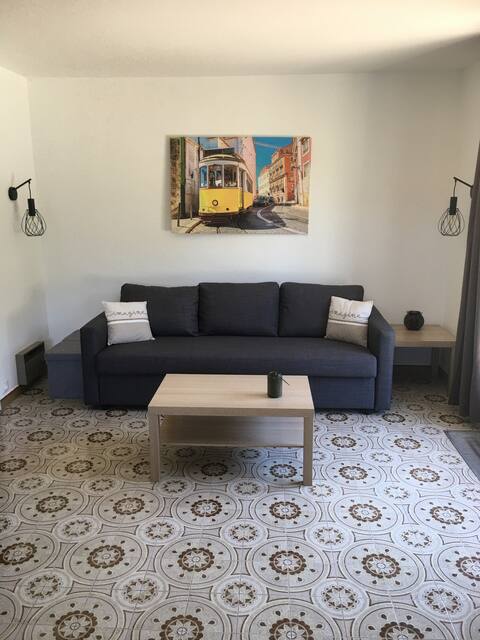
Quiet villa apartment
Entire Place • 3 bedrooms

At the foot of Château des Allinges
Entire Place • 1 bedroom

Maisonnette independent Le Gîte des Chateaux
Entire Place • 1 bedroom
Note: Performance varies based on location, size, amenities, seasonality, and management quality. Data reflects the past 12 months.
Top Performing Airbnb Hosts in Allinges (2025)
Learn from the best! This table showcases top-performing Airbnb hosts in Allinges based on the number of properties managed and estimated total revenue over the past year. Analyze their scale and performance metrics.
| Host Name | Properties | Grossing Revenue | Stay Reviews | Avg Rating |
|---|---|---|---|---|
| Luc | 1 | $38,155 | 106 | 4.90/5.0 |
| Aurora | 1 | $36,280 | 26 | 4.92/5.0 |
| Louis | 1 | $29,746 | 4 | 5.00/5.0 |
| Christian | 1 | $28,846 | 20 | 4.90/5.0 |
| Marlene | 1 | $25,262 | 24 | 4.67/5.0 |
| Florence | 1 | $25,144 | 122 | 4.97/5.0 |
| Anouk | 2 | $24,963 | 30 | 4.96/5.0 |
| Bernaz | 2 | $24,815 | 84 | 4.96/5.0 |
| Cannelle | 1 | $19,784 | 7 | 4.43/5.0 |
| Conciergerie Checkinleman | 1 | $19,485 | 18 | 4.94/5.0 |
Analyzing the strategies of top hosts, such as their property selection, pricing, and guest communication, can offer valuable lessons for optimizing your own Airbnb operations in Allinges.
Dive Deeper: Advanced Allinges STR Market Data (2025)
Ready to unlock more insights? AirROI provides access to advanced metrics and comprehensive Airbnb data for Allinges. Explore detailed analytics beyond this report to refine your investment strategy, optimize pricing, and maximize your vacation rental profits.
Explore Advanced MetricsAllinges Short-Term Rental Market Composition (2025): Property & Room Types
Room Type Distribution
Property Type Distribution
Market Composition Insights for Allinges
- The Allinges Airbnb market composition is heavily skewed towards Entire Home/Apt listings, which make up 89.7% of the 29 active rentals. This indicates strong guest preference for privacy and space.
- Looking at the property type distribution in Allinges, Apartment/Condo properties are the most common (51.7%), reflecting the local real estate landscape.
- Houses represent a significant 37.9% portion, catering likely to families or larger groups.
- The presence of 10.3% Hotel/Boutique listings indicates integration with traditional hospitality.
Allinges Airbnb Room Capacity Analysis (2025): Bedroom Distribution
Distribution of Listings by Number of Bedrooms
Room Capacity Insights for Allinges
- The dominant room capacity in Allinges is 1 bedroom listings, making up 44.8% of the market. This suggests a strong demand for properties suitable for couples or solo travelers.
- Together, 1 bedroom and 2 bedrooms properties represent 79.3% of the active Airbnb listings in Allinges, indicating a high concentration in these sizes.
- Listings with 3+ bedrooms (6.9%) represent a smaller niche, potentially indicating an underserved market for larger group accommodations in Allinges.
Allinges Vacation Rental Guest Capacity Trends (2025)
Distribution of Listings by Guest Capacity
Guest Capacity Insights for Allinges
- The most common guest capacity trend in Allinges vacation rentals is listings accommodating 2 guests (34.5%). This suggests the primary traveler segment is likely couples or solo travelers.
- Properties designed for 2 guests and 4 guests dominate the Allinges STR market, accounting for 62.1% of listings.
- 27.5% of properties accommodate 6+ guests, serving the market segment for larger families or group travel in Allinges.
- On average, properties in Allinges are equipped to host 3.7 guests.
Allinges Airbnb Booking Patterns (2025): Available vs. Booked Days
Available Days Distribution
Booked Days Distribution
Booking Pattern Insights for Allinges
- The most common availability pattern in Allinges falls within the 181-270 days range, representing 37.9% of listings. This suggests many properties have significant open periods on their calendars.
- Approximately 65.5% of listings show high availability (181+ days open annually), indicating potential for increased bookings or specific owner usage patterns.
- For booked days, the 91-180 days range is most frequent in Allinges (41.4%), reflecting common guest stay durations or potential owner blocking patterns.
- A notable 34.4% of properties secure long booking periods (181+ days booked per year), highlighting successful long-term rental strategies or significant owner usage.
Allinges Airbnb Minimum Stay Requirements Analysis
Distribution of Listings by Minimum Night Requirement
1 Night
7 listings
25% of total
2 Nights
8 listings
28.6% of total
3 Nights
4 listings
14.3% of total
4-6 Nights
5 listings
17.9% of total
7-29 Nights
2 listings
7.1% of total
30+ Nights
2 listings
7.1% of total
Key Insights
- The most prevalent minimum stay requirement in Allinges is 2 Nights, adopted by 28.6% of listings. This highlights the market's preference for shorter, flexible bookings.
Recommendations
- Align with the market by considering a 2 Nights minimum stay, as 28.6% of Allinges hosts use this setting.
- If feasible, allowing 1-night stays, especially midweek or during low season, could capture last-minute bookings, as only 25% currently do.
- Explore offering discounts for stays of 30+ nights to attract the 7.1% of the market seeking extended stays.
- Adjust minimum nights based on seasonality – potentially shorter during low season and longer during peak demand periods in Allinges.
Allinges Airbnb Cancellation Policy Trends Analysis (2025)
Flexible
9 listings
33.3% of total
Moderate
4 listings
14.8% of total
Firm
7 listings
25.9% of total
Strict
7 listings
25.9% of total
Cancellation Policy Insights for Allinges
- The prevailing Airbnb cancellation policy trend in Allinges is Flexible, used by 33.3% of listings.
- A majority (51.8%) of hosts in Allinges utilize Firm or Strict policies, indicating a market where hosts prioritize booking security.
Recommendations for Hosts
- Consider adopting a Flexible policy to align with the 33.3% market standard in Allinges.
- Regularly review your cancellation policy against competitors and market demand shifts in Allinges.
Allinges STR Booking Lead Time Analysis (2025)
Average Booking Lead Time by Month
Booking Lead Time Insights for Allinges
- The overall average booking lead time for vacation rentals in Allinges is 42 days.
- Guests book furthest in advance for stays during September (average 92 days), likely coinciding with peak travel demand or local events.
- The shortest booking windows occur for stays in November (average 12 days), indicating more last-minute travel plans during this time.
- Seasonally, Summer (73 days avg.) sees the longest lead times, while Winter (26 days avg.) has the shortest, reflecting typical travel planning cycles.
Recommendations for Hosts
- Use the overall average lead time (42 days) as a baseline for your pricing and availability strategy in Allinges.
- For September stays, consider implementing length-of-stay discounts or slightly higher rates for bookings made less than 92 days out to capitalize on advance planning.
- During November, focus on last-minute booking availability and promotions, as guests book with very short notice (12 days avg.).
- Target marketing efforts for the Summer season well in advance (at least 73 days) to capture early planners.
- Monitor your own booking lead times against these Allinges averages to identify opportunities for dynamic pricing adjustments.
Popular & Essential Airbnb Amenities in Allinges (2025)
Amenity Prevalence
Amenity Insights for Allinges
- Essential amenities in Allinges that guests expect include: Kitchen, Heating, TV, Dishes and silverware, Free parking on premises. Lacking these (any) could significantly impact bookings.
- Popular amenities like Refrigerator, Hot water, Smoke alarm are common but not universal. Offering these can provide a competitive edge.
- Warning: Wifi is not universally provided but is considered essential globally. Ensure reliable Wifi is offered.
Recommendations for Hosts
- Ensure your listing includes all essential amenities for Allinges: Kitchen, Heating, TV, Dishes and silverware, Free parking on premises.
- Prioritize adding missing essentials: Kitchen, Heating, TV, Dishes and silverware, Free parking on premises.
- Consider adding popular differentiators like Refrigerator or Hot water to increase appeal.
- Highlight unique or less common amenities you offer (e.g., hot tub, dedicated workspace, EV charger) in your listing description and photos.
- Regularly check competitor amenities in Allinges to stay competitive.
Allinges Airbnb Guest Demographics & Profile Analysis (2025)
Guest Profile Summary for Allinges
- The typical guest profile for Airbnb in Allinges consists of primarily domestic travelers (84%), often arriving from nearby Lyon, typically belonging to the Post-2000s (Gen Z/Alpha) group (50%), primarily speaking French or English.
- Domestic travelers account for 83.9% of guests.
- Key international markets include France (83.9%) and Germany (4.2%).
- Top languages spoken are French (45.8%) followed by English (29.6%).
- A significant demographic segment is the Post-2000s (Gen Z/Alpha) group, representing 50% of guests.
Recommendations for Hosts
- Target domestic marketing efforts towards travelers from Lyon and Grenoble.
- Tailor amenities and listing descriptions to appeal to the dominant Post-2000s (Gen Z/Alpha) demographic (e.g., highlight fast WiFi, smart home features, local guides).
- Highlight unique local experiences or amenities relevant to the primary guest profile.
- Consider seasonal promotions aligned with peak travel times for key origin markets.
Nearby Short-Term Rental Market Comparison
How does the Allinges Airbnb market stack up against its neighbors? Compare key performance metrics like average monthly revenue, ADR, and occupancy rates in surrounding areas to understand the broader regional STR landscape.
| Market | Active Properties | Monthly Revenue | Daily Rate | Avg. Occupancy |
|---|---|---|---|---|
| Lauterbrunnen | 525 | $7,079 | $546.45 | 54% |
| La Rivière-Enverse | 17 | $5,972 | $624.02 | 41% |
| Les Clefs | 30 | $5,741 | $323.11 | 44% |
| Matten bei Interlaken | 52 | $5,674 | $316.63 | 63% |
| Iseltwald | 14 | $5,491 | $331.95 | 58% |
| Habkern | 13 | $5,382 | $344.74 | 50% |
| Interlaken | 288 | $4,987 | $310.52 | 56% |
| Zermatt | 734 | $4,604 | $463.00 | 46% |
| Oberhofen am Thunersee | 24 | $4,572 | $265.94 | 55% |
| Sigriswil | 99 | $4,371 | $271.90 | 58% |