Alixan Airbnb Market Analysis 2025: Short Term Rental Data & Vacation Rental Statistics in Auvergne-Rhône-Alpes, France
Is Airbnb profitable in Alixan in 2025? Explore comprehensive Airbnb analytics for Alixan, Auvergne-Rhône-Alpes, France to uncover income potential. This 2025 STR market report for Alixan, based on AirROI data from April 2024 to March 2025, reveals key trends in the niche market of 20 active listings.
Whether you're considering an Airbnb investment in Alixan, optimizing your existing vacation rental, or exploring rental arbitrage opportunities, understanding the Alixan Airbnb data is crucial. Leveraging the low regulation environment is key to maximizing your short term rental income potential. Let's dive into the specifics.
Key Alixan Airbnb Performance Metrics Overview
Monthly Airbnb Revenue Variations & Income Potential in Alixan (2025)
Understanding the monthly revenue variations for Airbnb listings in Alixan is key to maximizing your short term rental income potential. Seasonality significantly impacts earnings. Our analysis, based on data from the past 12 months, shows that the peak revenue month for STRs in Alixan is typically May, while March often presents the lowest earnings, highlighting opportunities for strategic pricing adjustments during shoulder and low seasons. Explore the typical Airbnb income in Alixan across different performance tiers:
- Best-in-class properties (Top 10%) achieve $3,560+ monthly, often utilizing dynamic pricing and superior guest experiences.
- Strong performing properties (Top 25%) earn $2,045 or more, indicating effective management and desirable locations/amenities.
- Typical properties (Median) generate around $1,037 per month, representing the average market performance.
- Entry-level properties (Bottom 25%) see earnings around $540, often with potential for optimization.
Average Monthly Airbnb Earnings Trend in Alixan
Alixan Airbnb Occupancy Rate Trends (2025)
Maximize your bookings by understanding the Alixan STR occupancy trends. Seasonal demand shifts significantly influence how often properties are booked. Typically, Augustsees the highest demand (peak season occupancy), while March experiences the lowest (low season). Effective strategies, like adjusting minimum stays or offering promotions, can boost occupancy during slower periods. Here's how different property tiers perform in Alixan:
- Best-in-class properties (Top 10%) achieve 79%+ occupancy, indicating high desirability and potentially optimized availability.
- Strong performing properties (Top 25%) maintain 64% or higher occupancy, suggesting good market fit and guest satisfaction.
- Typical properties (Median) have an occupancy rate around 37%.
- Entry-level properties (Bottom 25%) average 22% occupancy, potentially facing higher vacancy.
Average Monthly Occupancy Rate Trend in Alixan
Average Daily Rate (ADR) Airbnb Trends in Alixan (2025)
Effective short term rental pricing strategy in Alixan involves understanding monthly ADR fluctuations. The Average Daily Rate (ADR) for Airbnb in Alixan typically peaks in December and dips lowest during May. Leveraging Airbnb dynamic pricing tools or strategies based on this seasonality can significantly boost revenue. Here's a look at the typical nightly rates achieved:
- Best-in-class properties (Top 10%) command rates of $287+ per night, often due to premium features or locations.
- Strong performing properties (Top 25%) achieve nightly rates of $137 or more.
- Typical properties (Median) charge around $80 per night.
- Entry-level properties (Bottom 25%) earn around $56 per night.
Average Daily Rate (ADR) Trend by Month in Alixan
Get Live Alixan Market Intelligence 👇

Explore Real-time Analytics
Airbnb Seasonality Analysis & Trends in Alixan (2025)
Peak Season (May, August, July)
- Revenue averages $2,654 per month
- Occupancy rates average 57.2%
- Daily rates average $127
Shoulder Season
- Revenue averages $1,662 per month
- Occupancy maintains around 37.7%
- Daily rates hold near $127
Low Season (February, March, November)
- Revenue drops to average $757 per month
- Occupancy decreases to average 37.0%
- Daily rates adjust to average $126
Seasonality Insights for Alixan
- The Airbnb seasonality in Alixan shows highly seasonal trends requiring careful strategy. While the sections above show seasonal averages, it's also insightful to look at the extremes:
- During the high season, the absolute peak month showcases Alixan's highest earning potential, with monthly revenues capable of climbing to $2,746, occupancy reaching a high of 64.1%, and ADRs peaking at $129.
- Conversely, the slowest single month of the year, typically falling within the low season, marks the market's lowest point. In this month, revenue might dip to $492, occupancy could drop to 27.0%, and ADRs may adjust down to $124.
- Understanding both the seasonal averages and these monthly peaks and troughs in revenue, occupancy, and ADR is crucial for maximizing your Airbnb profit potential in Alixan.
Seasonal Strategies for Maximizing Profit
- Peak Season: Maximize revenue through premium pricing and potentially longer minimum stays. Ensure high availability.
- Low Season: Offer competitive pricing, special promotions (e.g., extended stay discounts), and flexible cancellation policies. Target off-season travelers like remote workers or budget-conscious guests.
- Shoulder Seasons: Implement dynamic pricing that balances peak and low rates. Target weekend travelers or specific events. Offer slightly more flexible terms than peak season.
- Regularly analyze your own performance against these Alixan seasonality benchmarks and adjust your pricing and availability strategy accordingly.
Best Areas for Airbnb Investment in Alixan (2025)
Exploring the top neighborhoods for short-term rentals in Alixan? This section highlights key areas, outlining why they are attractive for hosts and guests, along with notable local attractions. Consider these locations based on your target guest profile and investment strategy.
| Neighborhood / Area | Why Host Here? (Target Guests & Appeal) | Key Attractions & Landmarks |
|---|---|---|
| Alixan Village | Charming village atmosphere with proximity to Valence and easy access to regional attractions. Ideal for travelers looking for a peaceful stay with a touch of local culture. | Château de Crussol, Valence Museum, Parc Jouvet, Eglise Saint-Pierre, Les Jardins des Sens |
| Valence City Center | Lively urban center rich in history and culture. Offers a variety of dining options, shopping, and historical sites, making it a hotspot for tourists. | Saint Apollinaire Cathedral, Valence Museum, Place des Clercs, Quartier de la vieille ville, Café de Paris |
| Montélimar | Famous for its nougat, Montélimar attracts visitors with its gastronomy and historic sites. Great for those interested in food tourism and local markets. | Château de Montélimar, Nougat factories, Les Jardins de la Ville, Montélimar's Old Town, Maison des Têtes |
| Romans-sur-Isère | Known for its historic architecture and fabric industry, this city offers a mix of cultural attractions and local charm, appealing to diverse travelers. | Musée international de la chaussure, Romans Cathedral, Place Jules Nadi, Tuilerie de Châteauneuf, Parc des Lilas |
| Tain-l'Hermitage | Located on the banks of the Rhône, this area is famous for its vineyards and beautiful landscapes, perfect for wine enthusiasts and nature lovers. | Hermitage vineyards, Valrhona Chocolate Factory, Cité du Chocolat, Rocher de Glun, Rhône River walks |
| Saint-Donat-sur-l'Herbasse | A tranquil rural area ideal for relaxing retreats. Attracts guests looking to escape to nature while still being close to urban amenities. | Local hiking trails, Lac de la Chèvre, Chapel of Saint-Donat, The Herbasse River, Countryside picnic spots |
| Chabeuil | A quiet town with a rich agricultural background, offering a peaceful stay with local markets and traditional French countryside living. | Château de Chabeuil, Local farms, Le Marché de Chabeuil, Les gorges de la Herbasse, Nature trails |
| Loriol-sur-Drôme | This riverside town offers picturesque views and access to various outdoor activities, appealing to guests who enjoy water sports and hiking. | Drôme River, Outdoor sports activities, Historic town center, Picnic areas, Cycling paths |
Understanding Airbnb License Requirements & STR Laws in Alixan (2025)
While Alixan, Auvergne-Rhône-Alpes, France currently shows low STR regulations, specific Airbnb license requirements might still exist or change. Always verify the latest short term rental regulations and Airbnb license requirements directly with local government authorities for Alixan to ensure full compliance before hosting.
(Source: AirROI data, 2025, finding no licensed listings among those analyzed)
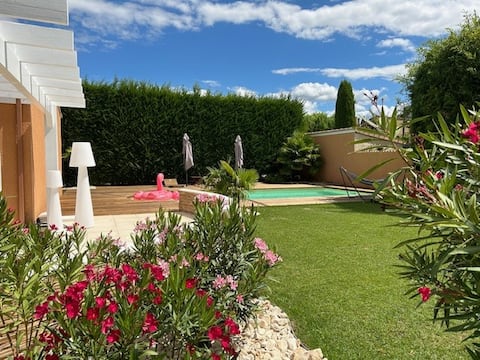
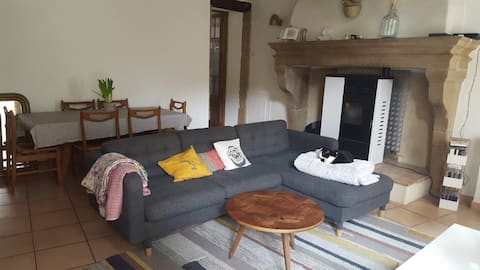
Top Performing Airbnb Properties in Alixan (2025)
Benchmark your potential! Explore examples of top-performing Airbnb properties in Alixanbased on Trailing Twelve Month (TTM) revenue. Analyze their characteristics, revenue, occupancy rate, and ADR to understand what drives success in this market.

Clos des Chouettes
Entire Place • 5 bedrooms

Large renovated pool farmhouse
Entire Place • 6 bedrooms
Maison familiale
Entire Place • 4 bedrooms
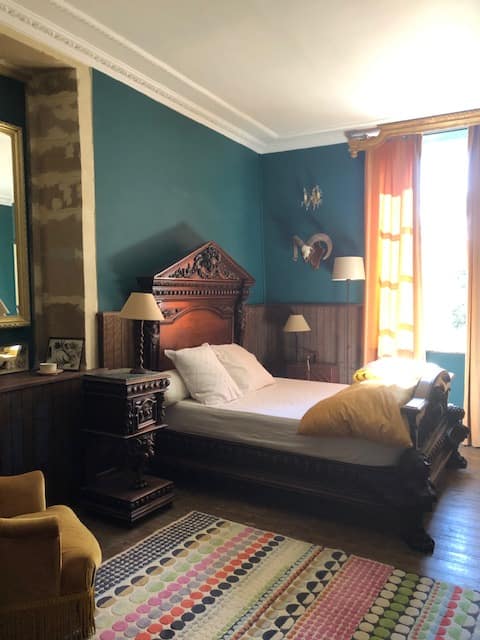
Suite at Château de Vaugelas
Private Room • N/A
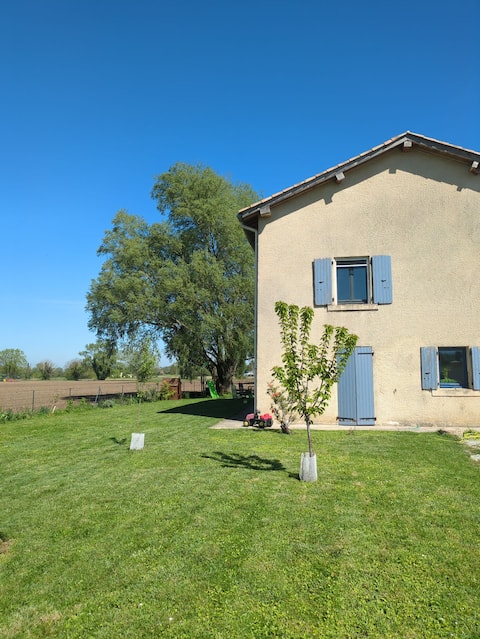
The house in the fields.
Entire Place • 4 bedrooms
Maison historique dans le centre bourg
Entire Place • 3 bedrooms
Note: Performance varies based on location, size, amenities, seasonality, and management quality. Data reflects the past 12 months.
Top Performing Airbnb Hosts in Alixan (2025)
Learn from the best! This table showcases top-performing Airbnb hosts in Alixan based on the number of properties managed and estimated total revenue over the past year. Analyze their scale and performance metrics.
| Host Name | Properties | Grossing Revenue | Stay Reviews | Avg Rating |
|---|---|---|---|---|
| Petra | 1 | $35,709 | 55 | 4.67/5.0 |
| Samuel | 2 | $34,592 | 13 | 4.74/5.0 |
| Aurelie | 2 | $16,798 | 28 | 5.00/5.0 |
| Host #208443621 | 1 | $16,533 | 0 | 0.00/5.0 |
| Sofiane | 2 | $16,423 | 6 | 2.42/5.0 |
| Violette | 1 | $15,631 | 11 | 4.55/5.0 |
| Bertrand | 1 | $13,457 | 30 | 4.80/5.0 |
| Nicole | 1 | $9,832 | 155 | 4.96/5.0 |
| Loïc | 1 | $9,415 | 21 | 5.00/5.0 |
| Regine | 1 | $7,954 | 71 | 4.97/5.0 |
Analyzing the strategies of top hosts, such as their property selection, pricing, and guest communication, can offer valuable lessons for optimizing your own Airbnb operations in Alixan.
Dive Deeper: Advanced Alixan STR Market Data (2025)
Ready to unlock more insights? AirROI provides access to advanced metrics and comprehensive Airbnb data for Alixan. Explore detailed analytics beyond this report to refine your investment strategy, optimize pricing, and maximize your vacation rental profits.
Explore Advanced MetricsAlixan Short-Term Rental Market Composition (2025): Property & Room Types
Room Type Distribution
Property Type Distribution
Market Composition Insights for Alixan
- The Alixan Airbnb market composition is heavily skewed towards Entire Home/Apt listings, which make up 75% of the 20 active rentals. This indicates strong guest preference for privacy and space.
- Looking at the property type distribution in Alixan, House properties are the most common (65%), reflecting the local real estate landscape.
- Houses represent a significant 65% portion, catering likely to families or larger groups.
- The presence of 10% Hotel/Boutique listings indicates integration with traditional hospitality.
Alixan Airbnb Room Capacity Analysis (2025): Bedroom Distribution
Distribution of Listings by Number of Bedrooms
Room Capacity Insights for Alixan
- The dominant room capacity in Alixan is 1 bedroom listings, making up 20% of the market. This suggests a strong demand for properties suitable for couples or solo travelers.
- Together, 1 bedroom and 2 bedrooms properties represent 35.0% of the active Airbnb listings in Alixan, indicating a high concentration in these sizes.
- A significant 40.0% of listings offer 3+ bedrooms, catering to larger groups and families seeking more space in Alixan.
Alixan Vacation Rental Guest Capacity Trends (2025)
Distribution of Listings by Guest Capacity
Guest Capacity Insights for Alixan
- The most common guest capacity trend in Alixan vacation rentals is listings accommodating 8+ guests (30%). This suggests the primary traveler segment is likely larger groups.
- Properties designed for 8+ guests and 4 guests dominate the Alixan STR market, accounting for 55.0% of listings.
- 30.0% of properties accommodate 6+ guests, serving the market segment for larger families or group travel in Alixan.
- On average, properties in Alixan are equipped to host 4.1 guests.
Alixan Airbnb Booking Patterns (2025): Available vs. Booked Days
Available Days Distribution
Booked Days Distribution
Booking Pattern Insights for Alixan
- The most common availability pattern in Alixan falls within the 181-270 days range, representing 45% of listings. This suggests many properties have significant open periods on their calendars.
- Approximately 85.0% of listings show high availability (181+ days open annually), indicating potential for increased bookings or specific owner usage patterns.
- For booked days, the 91-180 days range is most frequent in Alixan (45%), reflecting common guest stay durations or potential owner blocking patterns.
- A notable 15.0% of properties secure long booking periods (181+ days booked per year), highlighting successful long-term rental strategies or significant owner usage.
Alixan Airbnb Minimum Stay Requirements Analysis
Distribution of Listings by Minimum Night Requirement
1 Night
9 listings
45% of total
2 Nights
7 listings
35% of total
3 Nights
3 listings
15% of total
7-29 Nights
1 listings
5% of total
Key Insights
- The most prevalent minimum stay requirement in Alixan is 1 Night, adopted by 45% of listings. This highlights the market's preference for shorter, flexible bookings.
- A strong majority (80.0%) of the Alixan Airbnb data shows acceptance of very short stays (1-2 nights), indicating a dynamic, high-turnover market.
Recommendations
- Align with the market by considering a 1 Night minimum stay, as 45% of Alixan hosts use this setting.
- Adjust minimum nights based on seasonality – potentially shorter during low season and longer during peak demand periods in Alixan.
Alixan Airbnb Cancellation Policy Trends Analysis (2025)
Flexible
4 listings
26.7% of total
Moderate
5 listings
33.3% of total
Firm
4 listings
26.7% of total
Strict
2 listings
13.3% of total
Cancellation Policy Insights for Alixan
- The prevailing Airbnb cancellation policy trend in Alixan is Moderate, used by 33.3% of listings.
- There's a relatively balanced mix between guest-friendly (60.0%) and stricter (40.0%) policies, offering choices for different guest needs.
Recommendations for Hosts
- Consider adopting a Moderate policy to align with the 33.3% market standard in Alixan.
- Using a Strict policy might deter some guests, as only 13.3% of listings use it. Evaluate if potential revenue protection outweighs possible lower booking rates.
- Regularly review your cancellation policy against competitors and market demand shifts in Alixan.
Alixan STR Booking Lead Time Analysis (2025)
Average Booking Lead Time by Month
Booking Lead Time Insights for Alixan
- The overall average booking lead time for vacation rentals in Alixan is 38 days.
- Guests book furthest in advance for stays during May (average 76 days), likely coinciding with peak travel demand or local events.
- The shortest booking windows occur for stays in March (average 20 days), indicating more last-minute travel plans during this time.
- Seasonally, Spring (53 days avg.) sees the longest lead times, while Fall (28 days avg.) has the shortest, reflecting typical travel planning cycles.
Recommendations for Hosts
- Use the overall average lead time (38 days) as a baseline for your pricing and availability strategy in Alixan.
- For May stays, consider implementing length-of-stay discounts or slightly higher rates for bookings made less than 76 days out to capitalize on advance planning.
- Target marketing efforts for the Spring season well in advance (at least 53 days) to capture early planners.
- Monitor your own booking lead times against these Alixan averages to identify opportunities for dynamic pricing adjustments.
Popular & Essential Airbnb Amenities in Alixan (2025)
Amenity Prevalence
Amenity Insights for Alixan
- Essential amenities in Alixan that guests expect include: Hot water, Heating, Wifi. Lacking these (any) could significantly impact bookings.
- Popular amenities like Essentials, Free parking on premises, Hangers are common but not universal. Offering these can provide a competitive edge.
Recommendations for Hosts
- Ensure your listing includes all essential amenities for Alixan: Hot water, Heating, Wifi.
- Prioritize adding missing essentials: Wifi.
- Consider adding popular differentiators like Essentials or Free parking on premises to increase appeal.
- Highlight unique or less common amenities you offer (e.g., hot tub, dedicated workspace, EV charger) in your listing description and photos.
- Regularly check competitor amenities in Alixan to stay competitive.
Alixan Airbnb Guest Demographics & Profile Analysis (2025)
Guest Profile Summary for Alixan
- The typical guest profile for Airbnb in Alixan consists of primarily domestic travelers (90%), often arriving from nearby Paris, typically belonging to the Post-2000s (Gen Z/Alpha) group (50%), primarily speaking French or English.
- Domestic travelers account for 90.4% of guests.
- Key international markets include France (90.4%) and Netherlands (1.8%).
- Top languages spoken are French (42.9%) followed by English (27.6%).
- A significant demographic segment is the Post-2000s (Gen Z/Alpha) group, representing 50% of guests.
Recommendations for Hosts
- Target domestic marketing efforts towards travelers from Paris and Lyon.
- Tailor amenities and listing descriptions to appeal to the dominant Post-2000s (Gen Z/Alpha) demographic (e.g., highlight fast WiFi, smart home features, local guides).
- Highlight unique local experiences or amenities relevant to the primary guest profile.
- Consider seasonal promotions aligned with peak travel times for key origin markets.
Nearby Short-Term Rental Market Comparison
How does the Alixan Airbnb market stack up against its neighbors? Compare key performance metrics like average monthly revenue, ADR, and occupancy rates in surrounding areas to understand the broader regional STR landscape.
| Market | Active Properties | Monthly Revenue | Daily Rate | Avg. Occupancy |
|---|---|---|---|---|
| Les Clefs | 30 | $5,741 | $323.11 | 44% |
| Manigod | 194 | $4,127 | $427.80 | 40% |
| Divajeu | 19 | $3,941 | $410.65 | 42% |
| Saint-Germain-au-Mont-d'Or | 10 | $3,928 | $316.02 | 40% |
| Dommartin | 11 | $3,905 | $327.00 | 36% |
| Ramatuelle | 213 | $3,891 | $670.10 | 41% |
| Saint-Tropez | 742 | $3,498 | $506.57 | 41% |
| Saint-Nicolas-la-Chapelle | 27 | $3,381 | $375.70 | 43% |
| Courzieu | 11 | $3,267 | $287.83 | 52% |
| Charvonnex | 11 | $3,212 | $228.03 | 56% |