Whitehorse Airbnb Market Analysis 2025: Short Term Rental Data & Vacation Rental Statistics in Yukon, Canada
Is Airbnb profitable in Whitehorse in 2025? Explore comprehensive Airbnb analytics for Whitehorse, Yukon, Canada to uncover income potential. This 2025 STR market report for Whitehorse, based on AirROI data from April 2024 to March 2025, reveals key trends in the market of 239 active listings.
Whether you're considering an Airbnb investment in Whitehorse, optimizing your existing vacation rental, or exploring rental arbitrage opportunities, understanding the Whitehorse Airbnb data is crucial. Leveraging the low regulation environment is key to maximizing your short term rental income potential. Let's dive into the specifics.
Key Whitehorse Airbnb Performance Metrics Overview
Monthly Airbnb Revenue Variations & Income Potential in Whitehorse (2025)
Understanding the monthly revenue variations for Airbnb listings in Whitehorse is key to maximizing your short term rental income potential. Seasonality significantly impacts earnings. Our analysis, based on data from the past 12 months, shows that the peak revenue month for STRs in Whitehorse is typically August, while January often presents the lowest earnings, highlighting opportunities for strategic pricing adjustments during shoulder and low seasons. Explore the typical Airbnb income in Whitehorse across different performance tiers:
- Best-in-class properties (Top 10%) achieve $4,906+ monthly, often utilizing dynamic pricing and superior guest experiences.
- Strong performing properties (Top 25%) earn $3,688 or more, indicating effective management and desirable locations/amenities.
- Typical properties (Median) generate around $2,460 per month, representing the average market performance.
- Entry-level properties (Bottom 25%) see earnings around $1,415, often with potential for optimization.
Average Monthly Airbnb Earnings Trend in Whitehorse
Whitehorse Airbnb Occupancy Rate Trends (2025)
Maximize your bookings by understanding the Whitehorse STR occupancy trends. Seasonal demand shifts significantly influence how often properties are booked. Typically, Septembersees the highest demand (peak season occupancy), while January experiences the lowest (low season). Effective strategies, like adjusting minimum stays or offering promotions, can boost occupancy during slower periods. Here's how different property tiers perform in Whitehorse:
- Best-in-class properties (Top 10%) achieve 88%+ occupancy, indicating high desirability and potentially optimized availability.
- Strong performing properties (Top 25%) maintain 77% or higher occupancy, suggesting good market fit and guest satisfaction.
- Typical properties (Median) have an occupancy rate around 56%.
- Entry-level properties (Bottom 25%) average 30% occupancy, potentially facing higher vacancy.
Average Monthly Occupancy Rate Trend in Whitehorse
Average Daily Rate (ADR) Airbnb Trends in Whitehorse (2025)
Effective short term rental pricing strategy in Whitehorse involves understanding monthly ADR fluctuations. The Average Daily Rate (ADR) for Airbnb in Whitehorse typically peaks in November and dips lowest during April. Leveraging Airbnb dynamic pricing tools or strategies based on this seasonality can significantly boost revenue. Here's a look at the typical nightly rates achieved:
- Best-in-class properties (Top 10%) command rates of $227+ per night, often due to premium features or locations.
- Strong performing properties (Top 25%) achieve nightly rates of $176 or more.
- Typical properties (Median) charge around $141 per night.
- Entry-level properties (Bottom 25%) earn around $98 per night.
Average Daily Rate (ADR) Trend by Month in Whitehorse
Get Live Whitehorse Market Intelligence 👇

Explore Real-time Analytics
Airbnb Seasonality Analysis & Trends in Whitehorse (2025)
Peak Season (August, July, June)
- Revenue averages $3,313 per month
- Occupancy rates average 60.7%
- Daily rates average $153
Shoulder Season
- Revenue averages $2,694 per month
- Occupancy maintains around 52.7%
- Daily rates hold near $149
Low Season (January, February, March)
- Revenue drops to average $2,150 per month
- Occupancy decreases to average 47.4%
- Daily rates adjust to average $149
Seasonality Insights for Whitehorse
- The Airbnb seasonality in Whitehorse shows moderate seasonality with distinct peak and low periods. While the sections above show seasonal averages, it's also insightful to look at the extremes:
- During the high season, the absolute peak month showcases Whitehorse's highest earning potential, with monthly revenues capable of climbing to $3,407, occupancy reaching a high of 64.3%, and ADRs peaking at $154.
- Conversely, the slowest single month of the year, typically falling within the low season, marks the market's lowest point. In this month, revenue might dip to $2,051, occupancy could drop to 43.5%, and ADRs may adjust down to $144.
- Understanding both the seasonal averages and these monthly peaks and troughs in revenue, occupancy, and ADR is crucial for maximizing your Airbnb profit potential in Whitehorse.
Seasonal Strategies for Maximizing Profit
- Peak Season: Maximize revenue through premium pricing and potentially longer minimum stays. Ensure high availability.
- Low Season: Offer competitive pricing, special promotions (e.g., extended stay discounts), and flexible cancellation policies. Target off-season travelers like remote workers or budget-conscious guests.
- Shoulder Seasons: Implement dynamic pricing that balances peak and low rates. Target weekend travelers or specific events. Offer slightly more flexible terms than peak season.
- Regularly analyze your own performance against these Whitehorse seasonality benchmarks and adjust your pricing and availability strategy accordingly.
Best Areas for Airbnb Investment in Whitehorse (2025)
Exploring the top neighborhoods for short-term rentals in Whitehorse? This section highlights key areas, outlining why they are attractive for hosts and guests, along with notable local attractions. Consider these locations based on your target guest profile and investment strategy.
| Neighborhood / Area | Why Host Here? (Target Guests & Appeal) | Key Attractions & Landmarks |
|---|---|---|
| Downtown Whitehorse | The vibrant center of Whitehorse, offering a mix of local shops, restaurants, and cultural attractions. Ideal for tourists wanting to explore the city’s history and enjoy local events. | Yukon Arts Centre, Whitehorse Waterfront, MacBride Museum of Yukon History, Kwanlin Dün Cultural Centre, Brewery, Local parks and trails |
| Riverdale | A family-friendly neighborhood along the Yukon River, known for its beautiful views and outdoor activities. Attracts visitors looking for nature and peaceful surroundings while being close to the city. | Yukon River, Miles Canyon, Riverdale Park, Local shops, Walking and biking trails, Community events |
| Copper Ridge | A residential area above the city with stunning views of Whitehorse and the surrounding mountains. Popular among those seeking a quieter stay while still being a short drive from downtown amenities. | Copper Ridge Park, Scenic views, Walking trails, Local schools and amenities |
| Whistle Bend | A newer residential community that offers various amenities and services. An emerging area for visitors looking for modern accommodations and easy access to outdoor activities and parks. | Whistle Bend Park, Community Centre, Outdoor recreation spots, Access to trails and nature |
| Lake Chaplin | Known for its beautiful lake and surrounding natural areas, this location is perfect for travelers interested in outdoor activities like fishing and hiking, as well as a tranquil environment. | Lake Chaplin, Fishing spots, Hiking trails, Wildlife viewing, Picnic areas |
| Takhini Hot Springs | A popular destination for those seeking relaxation and adventure, with the famous hot springs nearby. Ideal for wellness retreats and spa experiences, attracting various tourists. | Takhini Hot Springs, Outdoor hot pools, Amazing views of the Northern Lights, Hiking and winter sports in nearby areas |
| Marsh Lake | A peaceful area south of Whitehorse, known for its stunning lake views and natural beauty. This tranquil setting is perfect for nature lovers and those wanting to escape the city's hustle. | Marsh Lake, Fishing and boating opportunities, Nature trails, Wildlife viewing, Picnic spots |
| Haines Junction | A gateway to Kluane National Park, known for its breathtaking landscapes and outdoor adventures. Great for those interested in hiking and exploring Canada's wilderness. | Kluane National Park, Mount Logan, Hiking trails, Wildlife viewing, Local art and culture |
Understanding Airbnb License Requirements & STR Laws in Whitehorse (2025)
While Whitehorse, Yukon, Canada currently shows low STR regulations, specific Airbnb license requirements might still exist or change. Always verify the latest short term rental regulations and Airbnb license requirements directly with local government authorities for Whitehorse to ensure full compliance before hosting.
(Source: AirROI data, 2025, finding no licensed listings among those analyzed)
Top Performing Airbnb Properties in Whitehorse (2025)
Benchmark your potential! Explore examples of top-performing Airbnb properties in Whitehorsebased on Trailing Twelve Month (TTM) revenue. Analyze their characteristics, revenue, occupancy rate, and ADR to understand what drives success in this market.

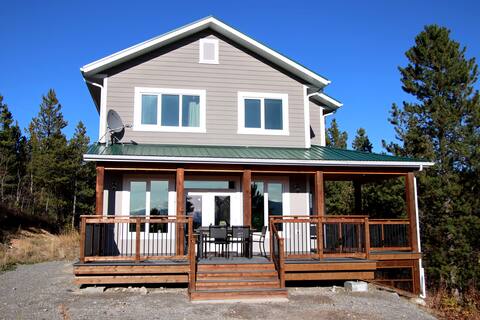
Mountain Haus w/HOT TUB, firepit & backyard
Entire Place • 4 bedrooms
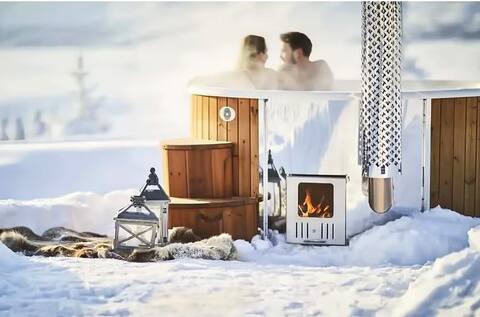
Nighthawk Guesthouse at Hot Springs
Entire Place • 4 bedrooms
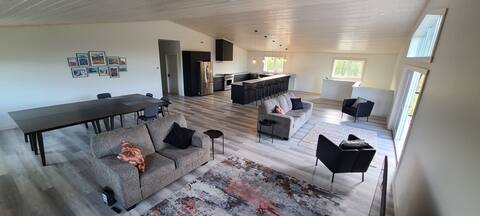
Great views, hot tub, 4 bdrm, 20 min from downtown
Entire Place • 4 bedrooms
Waterfront Urban Farm
Entire Place • 3 bedrooms
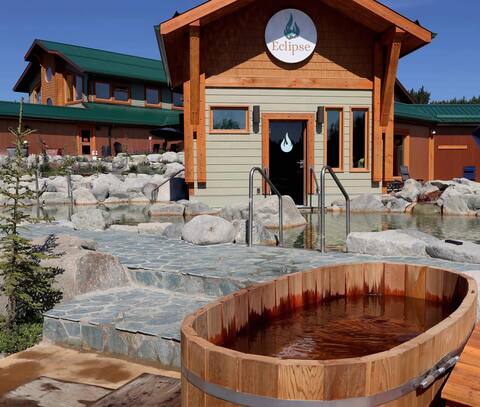
Suite 2 Apt with discounted entry to Hot Springs
Entire Place • 2 bedrooms

Suite 1 Apt with discounted entry to Hot Springs
Entire Place • 3 bedrooms
Note: Performance varies based on location, size, amenities, seasonality, and management quality. Data reflects the past 12 months.
Top Performing Airbnb Hosts in Whitehorse (2025)
Learn from the best! This table showcases top-performing Airbnb hosts in Whitehorse based on the number of properties managed and estimated total revenue over the past year. Analyze their scale and performance metrics.
| Host Name | Properties | Grossing Revenue | Stay Reviews | Avg Rating |
|---|---|---|---|---|
| Benjamin | 35 | $840,110 | 590 | 3.66/5.0 |
| Yukon Hot Springs Resort | 10 | $379,804 | 138 | 4.94/5.0 |
| Yong | 13 | $286,561 | 443 | 4.71/5.0 |
| Julia | 3 | $179,161 | 46 | 5.00/5.0 |
| Amber & Erik | 4 | $166,454 | 432 | 4.88/5.0 |
| Laird | 4 | $148,904 | 164 | 4.97/5.0 |
| Michelle | 2 | $135,060 | 178 | 4.93/5.0 |
| Catherine | 3 | $130,212 | 117 | 4.83/5.0 |
| Chad | 3 | $118,511 | 111 | 4.99/5.0 |
| Kathleen | 2 | $114,846 | 38 | 4.95/5.0 |
Analyzing the strategies of top hosts, such as their property selection, pricing, and guest communication, can offer valuable lessons for optimizing your own Airbnb operations in Whitehorse.
Dive Deeper: Advanced Whitehorse STR Market Data (2025)
Ready to unlock more insights? AirROI provides access to advanced metrics and comprehensive Airbnb data for Whitehorse. Explore detailed analytics beyond this report to refine your investment strategy, optimize pricing, and maximize your vacation rental profits.
Explore Advanced MetricsWhitehorse Short-Term Rental Market Composition (2025): Property & Room Types
Room Type Distribution
Property Type Distribution
Market Composition Insights for Whitehorse
- The Whitehorse Airbnb market composition is heavily skewed towards Entire Home/Apt listings, which make up 89.1% of the 239 active rentals. This indicates strong guest preference for privacy and space.
- Looking at the property type distribution in Whitehorse, House properties are the most common (36%), reflecting the local real estate landscape.
- Houses represent a significant 36% portion, catering likely to families or larger groups.
- The presence of 5.9% Hotel/Boutique listings indicates integration with traditional hospitality.
- Smaller segments like unique stays (combined 0.4%) offer potential for unique stay experiences.
Whitehorse Airbnb Room Capacity Analysis (2025): Bedroom Distribution
Distribution of Listings by Number of Bedrooms
Room Capacity Insights for Whitehorse
- The dominant room capacity in Whitehorse is 1 bedroom listings, making up 40.6% of the market. This suggests a strong demand for properties suitable for couples or solo travelers.
- Together, 1 bedroom and 2 bedrooms properties represent 71.6% of the active Airbnb listings in Whitehorse, indicating a high concentration in these sizes.
Whitehorse Vacation Rental Guest Capacity Trends (2025)
Distribution of Listings by Guest Capacity
Guest Capacity Insights for Whitehorse
- The most common guest capacity trend in Whitehorse vacation rentals is listings accommodating 4 guests (29.7%). This suggests the primary traveler segment is likely small families or groups.
- Properties designed for 4 guests and 2 guests dominate the Whitehorse STR market, accounting for 54.4% of listings.
- 23.5% of properties accommodate 6+ guests, serving the market segment for larger families or group travel in Whitehorse.
- On average, properties in Whitehorse are equipped to host 3.8 guests.
Whitehorse Airbnb Booking Patterns (2025): Available vs. Booked Days
Available Days Distribution
Booked Days Distribution
Booking Pattern Insights for Whitehorse
- The most common availability pattern in Whitehorse falls within the 91-180 days range, representing 31.8% of listings. This suggests many properties have significant open periods on their calendars.
- Approximately 55.2% of listings show high availability (181+ days open annually), indicating potential for increased bookings or specific owner usage patterns.
- For booked days, the 181-270 days range is most frequent in Whitehorse (32.6%), reflecting common guest stay durations or potential owner blocking patterns.
- A notable 46.8% of properties secure long booking periods (181+ days booked per year), highlighting successful long-term rental strategies or significant owner usage.
Whitehorse Airbnb Minimum Stay Requirements Analysis
Distribution of Listings by Minimum Night Requirement
1 Night
50 listings
22.3% of total
2 Nights
85 listings
37.9% of total
3 Nights
49 listings
21.9% of total
4-6 Nights
11 listings
4.9% of total
7-29 Nights
7 listings
3.1% of total
30+ Nights
22 listings
9.8% of total
Key Insights
- The most prevalent minimum stay requirement in Whitehorse is 2 Nights, adopted by 37.9% of listings. This highlights the market's preference for shorter, flexible bookings.
- A strong majority (60.2%) of the Whitehorse Airbnb data shows acceptance of very short stays (1-2 nights), indicating a dynamic, high-turnover market.
Recommendations
- Align with the market by considering a 2 Nights minimum stay, as 37.9% of Whitehorse hosts use this setting.
- If feasible, allowing 1-night stays, especially midweek or during low season, could capture last-minute bookings, as only 22.3% currently do.
- Explore offering discounts for stays of 30+ nights to attract the 9.8% of the market seeking extended stays.
- Adjust minimum nights based on seasonality – potentially shorter during low season and longer during peak demand periods in Whitehorse.
Whitehorse Airbnb Cancellation Policy Trends Analysis (2025)
Flexible
35 listings
16.2% of total
Moderate
86 listings
39.8% of total
Firm
58 listings
26.9% of total
Strict
37 listings
17.1% of total
Cancellation Policy Insights for Whitehorse
- The prevailing Airbnb cancellation policy trend in Whitehorse is Moderate, used by 39.8% of listings.
- There's a relatively balanced mix between guest-friendly (56.0%) and stricter (44.0%) policies, offering choices for different guest needs.
Recommendations for Hosts
- Consider adopting a Moderate policy to align with the 39.8% market standard in Whitehorse.
- Regularly review your cancellation policy against competitors and market demand shifts in Whitehorse.
Whitehorse STR Booking Lead Time Analysis (2025)
Average Booking Lead Time by Month
Booking Lead Time Insights for Whitehorse
- The overall average booking lead time for vacation rentals in Whitehorse is 48 days.
- Guests book furthest in advance for stays during June (average 80 days), likely coinciding with peak travel demand or local events.
- The shortest booking windows occur for stays in November (average 38 days), indicating more last-minute travel plans during this time.
- Seasonally, Summer (74 days avg.) sees the longest lead times, while Winter (45 days avg.) has the shortest, reflecting typical travel planning cycles.
Recommendations for Hosts
- Use the overall average lead time (48 days) as a baseline for your pricing and availability strategy in Whitehorse.
- For June stays, consider implementing length-of-stay discounts or slightly higher rates for bookings made less than 80 days out to capitalize on advance planning.
- Target marketing efforts for the Summer season well in advance (at least 74 days) to capture early planners.
- Monitor your own booking lead times against these Whitehorse averages to identify opportunities for dynamic pricing adjustments.
Popular & Essential Airbnb Amenities in Whitehorse (2025)
Amenity Prevalence
Amenity Insights for Whitehorse
- Essential amenities in Whitehorse that guests expect include: Smoke alarm, Kitchen. Lacking these (any) could significantly impact bookings.
- Popular amenities like Heating, Wifi, Essentials are common but not universal. Offering these can provide a competitive edge.
- Warning: Wifi is not universally provided but is considered essential globally. Ensure reliable Wifi is offered.
Recommendations for Hosts
- Ensure your listing includes all essential amenities for Whitehorse: Smoke alarm, Kitchen.
- Prioritize adding missing essentials: Smoke alarm, Kitchen.
- Consider adding popular differentiators like Heating or Wifi to increase appeal.
- Highlight unique or less common amenities you offer (e.g., hot tub, dedicated workspace, EV charger) in your listing description and photos.
- Regularly check competitor amenities in Whitehorse to stay competitive.
Whitehorse Airbnb Guest Demographics & Profile Analysis (2025)
Guest Profile Summary for Whitehorse
- The typical guest profile for Airbnb in Whitehorse consists of a mix of domestic (65%) and international guests, often arriving from nearby Whitehorse, typically belonging to the Post-2000s (Gen Z/Alpha) group (50%), primarily speaking English or French.
- Domestic travelers account for 64.7% of guests.
- Key international markets include Canada (64.7%) and United States (26.1%).
- Top languages spoken are English (64.8%) followed by French (11.5%).
- A significant demographic segment is the Post-2000s (Gen Z/Alpha) group, representing 50% of guests.
Recommendations for Hosts
- Target domestic marketing efforts towards travelers from Whitehorse and Vancouver.
- Tailor amenities and listing descriptions to appeal to the dominant Post-2000s (Gen Z/Alpha) demographic (e.g., highlight fast WiFi, smart home features, local guides).
- Highlight unique local experiences or amenities relevant to the primary guest profile.
- Consider seasonal promotions aligned with peak travel times for key origin markets.
Nearby Short-Term Rental Market Comparison
How does the Whitehorse Airbnb market stack up against its neighbors? Compare key performance metrics like average monthly revenue, ADR, and occupancy rates in surrounding areas to understand the broader regional STR landscape.