Weedon Airbnb Market Analysis 2025: Short Term Rental Data & Vacation Rental Statistics in Quebec, Canada
Is Airbnb profitable in Weedon in 2025? Explore comprehensive Airbnb analytics for Weedon, Quebec, Canada to uncover income potential. This 2025 STR market report for Weedon, based on AirROI data from April 2024 to March 2025, reveals key trends in the niche market of 40 active listings.
Whether you're considering an Airbnb investment in Weedon, optimizing your existing vacation rental, or exploring rental arbitrage opportunities, understanding the Weedon Airbnb data is crucial. Navigating the high regulation landscape is key to maximizing your short term rental income potential. Let's dive into the specifics.
Key Weedon Airbnb Performance Metrics Overview
Monthly Airbnb Revenue Variations & Income Potential in Weedon (2025)
Understanding the monthly revenue variations for Airbnb listings in Weedon is key to maximizing your short term rental income potential. Seasonality significantly impacts earnings. Our analysis, based on data from the past 12 months, shows that the peak revenue month for STRs in Weedon is typically July, while November often presents the lowest earnings, highlighting opportunities for strategic pricing adjustments during shoulder and low seasons. Explore the typical Airbnb income in Weedon across different performance tiers:
- Best-in-class properties (Top 10%) achieve $5,927+ monthly, often utilizing dynamic pricing and superior guest experiences.
- Strong performing properties (Top 25%) earn $3,919 or more, indicating effective management and desirable locations/amenities.
- Typical properties (Median) generate around $2,862 per month, representing the average market performance.
- Entry-level properties (Bottom 25%) see earnings around $1,607, often with potential for optimization.
Average Monthly Airbnb Earnings Trend in Weedon
Weedon Airbnb Occupancy Rate Trends (2025)
Maximize your bookings by understanding the Weedon STR occupancy trends. Seasonal demand shifts significantly influence how often properties are booked. Typically, Julysees the highest demand (peak season occupancy), while May experiences the lowest (low season). Effective strategies, like adjusting minimum stays or offering promotions, can boost occupancy during slower periods. Here's how different property tiers perform in Weedon:
- Best-in-class properties (Top 10%) achieve 72%+ occupancy, indicating high desirability and potentially optimized availability.
- Strong performing properties (Top 25%) maintain 55% or higher occupancy, suggesting good market fit and guest satisfaction.
- Typical properties (Median) have an occupancy rate around 37%.
- Entry-level properties (Bottom 25%) average 23% occupancy, potentially facing higher vacancy.
Average Monthly Occupancy Rate Trend in Weedon
Average Daily Rate (ADR) Airbnb Trends in Weedon (2025)
Effective short term rental pricing strategy in Weedon involves understanding monthly ADR fluctuations. The Average Daily Rate (ADR) for Airbnb in Weedon typically peaks in December and dips lowest during September. Leveraging Airbnb dynamic pricing tools or strategies based on this seasonality can significantly boost revenue. Here's a look at the typical nightly rates achieved:
- Best-in-class properties (Top 10%) command rates of $288+ per night, often due to premium features or locations.
- Strong performing properties (Top 25%) achieve nightly rates of $215 or more.
- Typical properties (Median) charge around $176 per night.
- Entry-level properties (Bottom 25%) earn around $146 per night.
Average Daily Rate (ADR) Trend by Month in Weedon
Get Live Weedon Market Intelligence 👇

Explore Real-time Analytics
Airbnb Seasonality Analysis & Trends in Weedon (2025)
Peak Season (July, June, May)
- Revenue averages $4,583 per month
- Occupancy rates average 48.5%
- Daily rates average $196
Shoulder Season
- Revenue averages $2,914 per month
- Occupancy maintains around 38.7%
- Daily rates hold near $208
Low Season (September, October, November)
- Revenue drops to average $1,886 per month
- Occupancy decreases to average 34.5%
- Daily rates adjust to average $187
Seasonality Insights for Weedon
- The Airbnb seasonality in Weedon shows highly seasonal trends requiring careful strategy. While the sections above show seasonal averages, it's also insightful to look at the extremes:
- During the high season, the absolute peak month showcases Weedon's highest earning potential, with monthly revenues capable of climbing to $4,842, occupancy reaching a high of 71.2%, and ADRs peaking at $233.
- Conversely, the slowest single month of the year, typically falling within the low season, marks the market's lowest point. In this month, revenue might dip to $1,670, occupancy could drop to 28.0%, and ADRs may adjust down to $183.
- Understanding both the seasonal averages and these monthly peaks and troughs in revenue, occupancy, and ADR is crucial for maximizing your Airbnb profit potential in Weedon.
Seasonal Strategies for Maximizing Profit
- Peak Season: Maximize revenue through premium pricing and potentially longer minimum stays. Ensure high availability.
- Low Season: Offer competitive pricing, special promotions (e.g., extended stay discounts), and flexible cancellation policies. Target off-season travelers like remote workers or budget-conscious guests.
- Shoulder Seasons: Implement dynamic pricing that balances peak and low rates. Target weekend travelers or specific events. Offer slightly more flexible terms than peak season.
- Regularly analyze your own performance against these Weedon seasonality benchmarks and adjust your pricing and availability strategy accordingly.
Best Areas for Airbnb Investment in Weedon (2025)
Exploring the top neighborhoods for short-term rentals in Weedon? This section highlights key areas, outlining why they are attractive for hosts and guests, along with notable local attractions. Consider these locations based on your target guest profile and investment strategy.
| Neighborhood / Area | Why Host Here? (Target Guests & Appeal) | Key Attractions & Landmarks |
|---|---|---|
| Wellington-Sud | A picturesque area in Weedon, popular for its tranquil environment and natural beauty. Ideal for those seeking a peaceful retreat in nature. | Parc des Lions, Lac de la Couronne, Sentier de la Rivière, Pêche à la mouche, Randonnées en raquettes |
| Weedon Village | The heart of Weedon, offering proximity to local amenities and services, making it convenient for visitors. | Église de Weedon, Marché local, Proximité des commerces, École de musique, Activités communautaires |
| Montagne de la Croix | A stunning mountain area perfect for outdoor enthusiasts and adventurers, appealing to hikers and nature lovers. | Randonnée, Vues panoramiques, Observation de la faune, Activités en plein air, Sentiers pédestres |
| Lac des Sources | A serene lake area known for its water activities, perfect for families and those looking to relax by the water. | Plage du lac, Location de kayaks, Pêche, Pique-nique au bord de l'eau, Baignade |
| Les Cèdres | A charming neighborhood with a community feel, attracting visitors interested in local culture and history. | Musée de Weedon, Événements locaux, Visites guidées, Ateliers artisanaux, Marché extérieur |
| Ferme de la Rive | A rural area that provides an authentic agricultural experience, attractive to those interested in farm life. | Visites de la ferme, Produits locaux, Dégustations, Événements champêtres, Ateliers pour enfants |
| Parc naturel de Weedon | A beautiful natural park with trails and wildlife, great for hiking and outdoor events, appealing to nature lovers. | Sentiers de randonnée, Observation des oiseaux, Pique-nique dans la nature, Activités familiales, Écotourisme |
| Vieux Weedon | A historical area showcasing the heritage of the town, attracting visitors interested in culture and history. | Bâtiments patrimoniaux, Festivals culturels, Visites historiques, Ateliers artisanaux, Sculptures extérieures |
Understanding Airbnb License Requirements & STR Laws in Weedon (2025)
Yes, Weedon, Quebec, Canada enforces high STR regulations. Obtaining a license and ensuring compliance is almost certainly required according to current 2025 STR laws. Always verify the latest short term rental regulations and Airbnb license requirements directly with local government authorities for Weedon to ensure full compliance before hosting.
(Source: AirROI data, 2025, based on 83% licensed listings)
Top Performing Airbnb Properties in Weedon (2025)
Benchmark your potential! Explore examples of top-performing Airbnb properties in Weedonbased on Trailing Twelve Month (TTM) revenue. Analyze their characteristics, revenue, occupancy rate, and ADR to understand what drives success in this market.
Ô 2 chalets Spa/Massage
Entire Place • 4 bedrooms

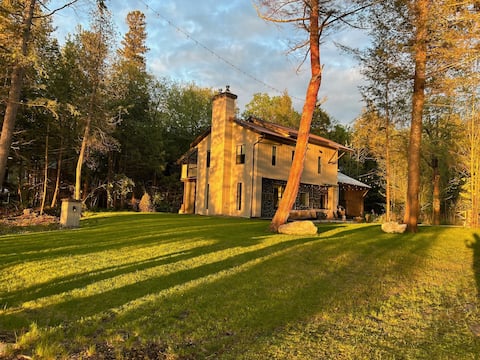
Superb log cabin *Spa* *Waterfront*
Entire Place • 3 bedrooms
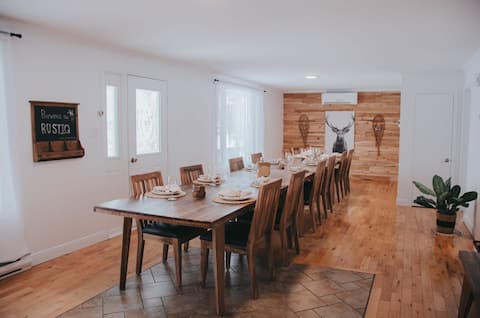
Le Rustiq chalet
Entire Place • 5 bedrooms
Le chic scandinave du Lac Aylmer *SPA-FOYER BOIS*
Entire Place • 2 bedrooms
Hotel à la maison - Le refuge de Louise, avec spa
Entire Place • 3 bedrooms
Chalet BIA - In the Know of the 2 Rivers
Entire Place • 3 bedrooms
Note: Performance varies based on location, size, amenities, seasonality, and management quality. Data reflects the past 12 months.
Top Performing Airbnb Hosts in Weedon (2025)
Learn from the best! This table showcases top-performing Airbnb hosts in Weedon based on the number of properties managed and estimated total revenue over the past year. Analyze their scale and performance metrics.
| Host Name | Properties | Grossing Revenue | Stay Reviews | Avg Rating |
|---|---|---|---|---|
| Maude | 7 | $318,915 | 153 | 3.48/5.0 |
| Lisa-Marie Et Alexandre | 4 | $164,209 | 187 | 4.87/5.0 |
| Pierre-Luc | 2 | $79,443 | 180 | 4.97/5.0 |
| Hôtel À La Maison | 2 | $73,698 | 64 | 4.88/5.0 |
| Louis-Philip | 2 | $73,268 | 36 | 4.55/5.0 |
| Host #315795667 | 1 | $50,491 | 24 | 5.00/5.0 |
| Bianca | 1 | $47,238 | 66 | 4.94/5.0 |
| Christine | 1 | $35,375 | 6 | 4.83/5.0 |
| Emmanuel | 1 | $34,716 | 29 | 4.93/5.0 |
| Édith | 1 | $32,145 | 40 | 4.93/5.0 |
Analyzing the strategies of top hosts, such as their property selection, pricing, and guest communication, can offer valuable lessons for optimizing your own Airbnb operations in Weedon.
Dive Deeper: Advanced Weedon STR Market Data (2025)
Ready to unlock more insights? AirROI provides access to advanced metrics and comprehensive Airbnb data for Weedon. Explore detailed analytics beyond this report to refine your investment strategy, optimize pricing, and maximize your vacation rental profits.
Explore Advanced MetricsWeedon Short-Term Rental Market Composition (2025): Property & Room Types
Room Type Distribution
Property Type Distribution
Market Composition Insights for Weedon
- The Weedon Airbnb market composition is heavily skewed towards Entire Home/Apt listings, which make up 100% of the 40 active rentals. This indicates strong guest preference for privacy and space.
- Looking at the property type distribution in Weedon, House properties are the most common (97.5%), reflecting the local real estate landscape.
- Houses represent a significant 97.5% portion, catering likely to families or larger groups.
- Smaller segments like outdoor/unique (combined 2.5%) offer potential for unique stay experiences.
Weedon Airbnb Room Capacity Analysis (2025): Bedroom Distribution
Distribution of Listings by Number of Bedrooms
Room Capacity Insights for Weedon
- The dominant room capacity in Weedon is 3 bedrooms listings, making up 40% of the market. This suggests a strong demand for properties suitable for families or small groups.
- Together, 3 bedrooms and 2 bedrooms properties represent 75.0% of the active Airbnb listings in Weedon, indicating a high concentration in these sizes.
- A significant 60.0% of listings offer 3+ bedrooms, catering to larger groups and families seeking more space in Weedon.
Weedon Vacation Rental Guest Capacity Trends (2025)
Distribution of Listings by Guest Capacity
Guest Capacity Insights for Weedon
- The most common guest capacity trend in Weedon vacation rentals is listings accommodating 8+ guests (52.5%). This suggests the primary traveler segment is likely larger groups.
- Properties designed for 8+ guests and 6 guests dominate the Weedon STR market, accounting for 80.0% of listings.
- 90.0% of properties accommodate 6+ guests, serving the market segment for larger families or group travel in Weedon.
- On average, properties in Weedon are equipped to host 7.0 guests.
Weedon Airbnb Booking Patterns (2025): Available vs. Booked Days
Available Days Distribution
Booked Days Distribution
Booking Pattern Insights for Weedon
- The most common availability pattern in Weedon falls within the 181-270 days range, representing 37.5% of listings. This suggests many properties have significant open periods on their calendars.
- Approximately 65.0% of listings show high availability (181+ days open annually), indicating potential for increased bookings or specific owner usage patterns.
- For booked days, the 181-270 days range is most frequent in Weedon (35%), reflecting common guest stay durations or potential owner blocking patterns.
- A notable 37.5% of properties secure long booking periods (181+ days booked per year), highlighting successful long-term rental strategies or significant owner usage.
Weedon Airbnb Minimum Stay Requirements Analysis
Distribution of Listings by Minimum Night Requirement
2 Nights
20 listings
52.6% of total
3 Nights
1 listings
2.6% of total
4-6 Nights
2 listings
5.3% of total
7-29 Nights
2 listings
5.3% of total
30+ Nights
13 listings
34.2% of total
Key Insights
- The most prevalent minimum stay requirement in Weedon is 2 Nights, adopted by 52.6% of listings. This highlights the market's preference for shorter, flexible bookings.
- A significant segment (34.2%) caters to monthly stays (30+ nights) in Weedon, pointing to opportunities in the extended-stay market.
Recommendations
- Align with the market by considering a 2 Nights minimum stay, as 52.6% of Weedon hosts use this setting.
- A 2-night minimum appears standard (52.6%). Consider this for weekends or peak periods.
- Explore offering discounts for stays of 30+ nights to attract the 34.2% of the market seeking extended stays.
- Adjust minimum nights based on seasonality – potentially shorter during low season and longer during peak demand periods in Weedon.
Weedon Airbnb Cancellation Policy Trends Analysis (2025)
Super Strict 30 Days
1 listings
3% of total
Flexible
1 listings
3% of total
Moderate
2 listings
6.1% of total
Firm
18 listings
54.5% of total
Strict
11 listings
33.3% of total
Cancellation Policy Insights for Weedon
- The prevailing Airbnb cancellation policy trend in Weedon is Firm, used by 54.5% of listings.
- A majority (87.8%) of hosts in Weedon utilize Firm or Strict policies, indicating a market where hosts prioritize booking security.
Recommendations for Hosts
- Consider adopting a Firm policy to align with the 54.5% market standard in Weedon.
- With 33.3% using Strict terms, this is a viable option in Weedon, particularly for high-value properties or during peak demand periods.
- Regularly review your cancellation policy against competitors and market demand shifts in Weedon.
Weedon STR Booking Lead Time Analysis (2025)
Average Booking Lead Time by Month
Booking Lead Time Insights for Weedon
- The overall average booking lead time for vacation rentals in Weedon is 35 days.
- Guests book furthest in advance for stays during July (average 87 days), likely coinciding with peak travel demand or local events.
- The shortest booking windows occur for stays in September (average 24 days), indicating more last-minute travel plans during this time.
- Seasonally, Summer (63 days avg.) sees the longest lead times, while Fall (30 days avg.) has the shortest, reflecting typical travel planning cycles.
Recommendations for Hosts
- Use the overall average lead time (35 days) as a baseline for your pricing and availability strategy in Weedon.
- For July stays, consider implementing length-of-stay discounts or slightly higher rates for bookings made less than 87 days out to capitalize on advance planning.
- Target marketing efforts for the Summer season well in advance (at least 63 days) to capture early planners.
- Monitor your own booking lead times against these Weedon averages to identify opportunities for dynamic pricing adjustments.
Popular & Essential Airbnb Amenities in Weedon (2025)
Amenity Prevalence
Amenity Insights for Weedon
- Essential amenities in Weedon that guests expect include: Free parking on premises, Heating, Smoke alarm, Wifi. Lacking these (any) could significantly impact bookings.
- Popular amenities like TV, Cooking basics, Essentials are common but not universal. Offering these can provide a competitive edge.
Recommendations for Hosts
- Ensure your listing includes all essential amenities for Weedon: Free parking on premises, Heating, Smoke alarm, Wifi.
- Prioritize adding missing essentials: Smoke alarm, Wifi.
- Consider adding popular differentiators like TV or Cooking basics to increase appeal.
- Highlight unique or less common amenities you offer (e.g., hot tub, dedicated workspace, EV charger) in your listing description and photos.
- Regularly check competitor amenities in Weedon to stay competitive.
Weedon Airbnb Guest Demographics & Profile Analysis (2025)
Guest Profile Summary for Weedon
- The typical guest profile for Airbnb in Weedon consists of primarily domestic travelers (86%), often arriving from nearby Montreal, typically belonging to the Post-2000s (Gen Z/Alpha) group (50%), primarily speaking French or English.
- Domestic travelers account for 86.4% of guests.
- Key international markets include Canada (86.4%) and United States (7.7%).
- Top languages spoken are French (48.7%) followed by English (39%).
- A significant demographic segment is the Post-2000s (Gen Z/Alpha) group, representing 50% of guests.
Recommendations for Hosts
- Target domestic marketing efforts towards travelers from Montreal and Sherbrooke.
- Tailor amenities and listing descriptions to appeal to the dominant Post-2000s (Gen Z/Alpha) demographic (e.g., highlight fast WiFi, smart home features, local guides).
- Highlight unique local experiences or amenities relevant to the primary guest profile.
- Consider seasonal promotions aligned with peak travel times for key origin markets.
Nearby Short-Term Rental Market Comparison
How does the Weedon Airbnb market stack up against its neighbors? Compare key performance metrics like average monthly revenue, ADR, and occupancy rates in surrounding areas to understand the broader regional STR landscape.
| Market | Active Properties | Monthly Revenue | Daily Rate | Avg. Occupancy |
|---|---|---|---|---|
| Jefferson | 28 | $5,920 | $432.83 | 50% |
| Stowe | 842 | $4,757 | $474.92 | 41% |
| Otisfield | 11 | $4,471 | $391.16 | 43% |
| Saint-Denis-de-Brompton | 28 | $4,459 | $383.13 | 34% |
| Dalton | 13 | $4,397 | $359.89 | 45% |
| Calais | 16 | $4,320 | $299.79 | 49% |
| Woodstock | 45 | $4,116 | $385.01 | 44% |
| Waterloo | 11 | $4,092 | $357.06 | 37% |
| Topsham | 13 | $3,952 | $265.51 | 50% |
| Jericho | 23 | $3,945 | $309.71 | 54% |