Trois-Rives Airbnb Market Analysis 2025: Short Term Rental Data & Vacation Rental Statistics in Quebec, Canada
Is Airbnb profitable in Trois-Rives in 2025? Explore comprehensive Airbnb analytics for Trois-Rives, Quebec, Canada to uncover income potential. This 2025 STR market report for Trois-Rives, based on AirROI data from April 2024 to March 2025, reveals key trends in the niche market of 29 active listings.
Whether you're considering an Airbnb investment in Trois-Rives, optimizing your existing vacation rental, or exploring rental arbitrage opportunities, understanding the Trois-Rives Airbnb data is crucial. Navigating the high regulation landscape is key to maximizing your short term rental income potential. Let's dive into the specifics.
Key Trois-Rives Airbnb Performance Metrics Overview
Monthly Airbnb Revenue Variations & Income Potential in Trois-Rives (2025)
Understanding the monthly revenue variations for Airbnb listings in Trois-Rives is key to maximizing your short term rental income potential. Seasonality significantly impacts earnings. Our analysis, based on data from the past 12 months, shows that the peak revenue month for STRs in Trois-Rives is typically July, while November often presents the lowest earnings, highlighting opportunities for strategic pricing adjustments during shoulder and low seasons. Explore the typical Airbnb income in Trois-Rives across different performance tiers:
- Best-in-class properties (Top 10%) achieve $6,349+ monthly, often utilizing dynamic pricing and superior guest experiences.
- Strong performing properties (Top 25%) earn $4,819 or more, indicating effective management and desirable locations/amenities.
- Typical properties (Median) generate around $3,143 per month, representing the average market performance.
- Entry-level properties (Bottom 25%) see earnings around $1,699, often with potential for optimization.
Average Monthly Airbnb Earnings Trend in Trois-Rives
Trois-Rives Airbnb Occupancy Rate Trends (2025)
Maximize your bookings by understanding the Trois-Rives STR occupancy trends. Seasonal demand shifts significantly influence how often properties are booked. Typically, Julysees the highest demand (peak season occupancy), while April experiences the lowest (low season). Effective strategies, like adjusting minimum stays or offering promotions, can boost occupancy during slower periods. Here's how different property tiers perform in Trois-Rives:
- Best-in-class properties (Top 10%) achieve 72%+ occupancy, indicating high desirability and potentially optimized availability.
- Strong performing properties (Top 25%) maintain 56% or higher occupancy, suggesting good market fit and guest satisfaction.
- Typical properties (Median) have an occupancy rate around 39%.
- Entry-level properties (Bottom 25%) average 26% occupancy, potentially facing higher vacancy.
Average Monthly Occupancy Rate Trend in Trois-Rives
Average Daily Rate (ADR) Airbnb Trends in Trois-Rives (2025)
Effective short term rental pricing strategy in Trois-Rives involves understanding monthly ADR fluctuations. The Average Daily Rate (ADR) for Airbnb in Trois-Rives typically peaks in December and dips lowest during March. Leveraging Airbnb dynamic pricing tools or strategies based on this seasonality can significantly boost revenue. Here's a look at the typical nightly rates achieved:
- Best-in-class properties (Top 10%) command rates of $334+ per night, often due to premium features or locations.
- Strong performing properties (Top 25%) achieve nightly rates of $263 or more.
- Typical properties (Median) charge around $199 per night.
- Entry-level properties (Bottom 25%) earn around $160 per night.
Average Daily Rate (ADR) Trend by Month in Trois-Rives
Get Live Trois-Rives Market Intelligence 👇

Explore Real-time Analytics
Airbnb Seasonality Analysis & Trends in Trois-Rives (2025)
Peak Season (July, August, June)
- Revenue averages $5,075 per month
- Occupancy rates average 55.2%
- Daily rates average $242
Shoulder Season
- Revenue averages $3,378 per month
- Occupancy maintains around 36.8%
- Daily rates hold near $227
Low Season (February, October, November)
- Revenue drops to average $2,333 per month
- Occupancy decreases to average 37.0%
- Daily rates adjust to average $216
Seasonality Insights for Trois-Rives
- The Airbnb seasonality in Trois-Rives shows highly seasonal trends requiring careful strategy. While the sections above show seasonal averages, it's also insightful to look at the extremes:
- During the high season, the absolute peak month showcases Trois-Rives's highest earning potential, with monthly revenues capable of climbing to $5,672, occupancy reaching a high of 64.5%, and ADRs peaking at $248.
- Conversely, the slowest single month of the year, typically falling within the low season, marks the market's lowest point. In this month, revenue might dip to $2,235, occupancy could drop to 27.3%, and ADRs may adjust down to $209.
- Understanding both the seasonal averages and these monthly peaks and troughs in revenue, occupancy, and ADR is crucial for maximizing your Airbnb profit potential in Trois-Rives.
Seasonal Strategies for Maximizing Profit
- Peak Season: Maximize revenue through premium pricing and potentially longer minimum stays. Ensure high availability.
- Low Season: Offer competitive pricing, special promotions (e.g., extended stay discounts), and flexible cancellation policies. Target off-season travelers like remote workers or budget-conscious guests.
- Shoulder Seasons: Implement dynamic pricing that balances peak and low rates. Target weekend travelers or specific events. Offer slightly more flexible terms than peak season.
- Regularly analyze your own performance against these Trois-Rives seasonality benchmarks and adjust your pricing and availability strategy accordingly.
Best Areas for Airbnb Investment in Trois-Rives (2025)
Exploring the top neighborhoods for short-term rentals in Trois-Rives? This section highlights key areas, outlining why they are attractive for hosts and guests, along with notable local attractions. Consider these locations based on your target guest profile and investment strategy.
| Neighborhood / Area | Why Host Here? (Target Guests & Appeal) | Key Attractions & Landmarks |
|---|---|---|
| Trois-Rives Downtown | The heart of Trois-Rives, offering a charming blend of local culture and accessibility. Ideal for tourists looking to explore local dining and events. | Trois-Rives Park, Local craft shops, Cultural festivals, Gatineau River access |
| Lac des Îles | A serene lake area perfect for nature lovers and outdoor enthusiasts. Popular for its recreational activities and beautiful scenery, attracting families and couples. | Lac des Îles Beach, Hiking trails, Kayaking, Fishing spots, Picnic areas |
| Parc National de la Mauricie | A stunning national park known for its breathtaking landscapes and outdoor activities. Attracts nature lovers and adventure seekers year-round. | Hiking trails, Wildlife viewing, Canoeing, Camping sites, Scenic viewpoints |
| Bistro de la Rivière | A popular local dining area offering traditional Quebec cuisine. Great for visitors looking for local flavors and culinary experiences. | Local bistro, Culinary events, Farmers market, Live music on weekends |
| Saint-Jean-des-Piles | This nearby town offers beautiful natural surroundings and is close to key attractions of the region. Great for those exploring the Mauricie area. | Nature reserves, Historic sites, Craft markets, River access, Cycling paths |
| Montagne du Loup | A scenic area known for its hiking opportunities and stunning views. Perfect for outdoor enthusiasts and those seeking a retreat from the city. | Hiking trails, Observation deck, Nature photography spots, Wildflower viewing |
| Cascades de la Chute | Famous for its beautiful waterfalls and scenic views. This area attracts both tourists and locals during the warmer months for picnics and hikes. | Waterfall views, Picnic spots, Photography opportunities, Nature trails |
| Cultural Heritage District | Rich in history and culture, this area offers insights into the local heritage and traditions. Great for visitors interested in cultural tours. | Historic buildings, Museums, Cultural events, Art galleries |
Understanding Airbnb License Requirements & STR Laws in Trois-Rives (2025)
Yes, Trois-Rives, Quebec, Canada enforces high STR regulations. Obtaining a license and ensuring compliance is almost certainly required according to current 2025 STR laws. Always verify the latest short term rental regulations and Airbnb license requirements directly with local government authorities for Trois-Rives to ensure full compliance before hosting.
(Source: AirROI data, 2025, based on 76% licensed listings)
Top Performing Airbnb Properties in Trois-Rives (2025)
Benchmark your potential! Explore examples of top-performing Airbnb properties in Trois-Rivesbased on Trailing Twelve Month (TTM) revenue. Analyze their characteristics, revenue, occupancy rate, and ADR to understand what drives success in this market.
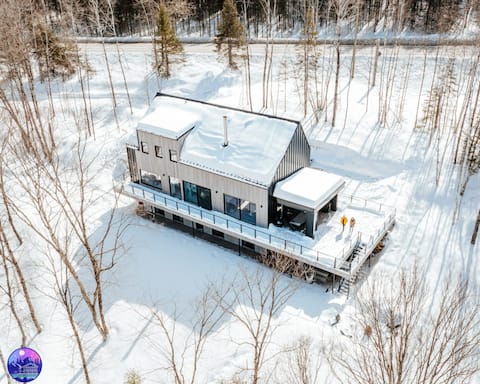
Flodhaus | river front | spa | sauna
Entire Place • 7 bedrooms
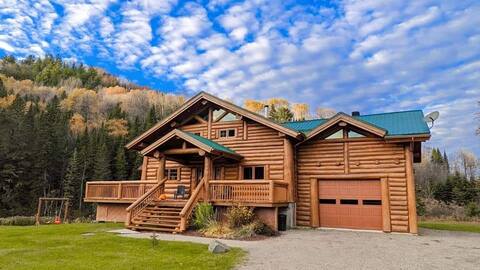
** WATERFRONT CHALET * SPA * BILLIARDS * FIREPLACE **
Entire Place • 5 bedrooms

Le Chic St-Maurice
Entire Place • 3 bedrooms
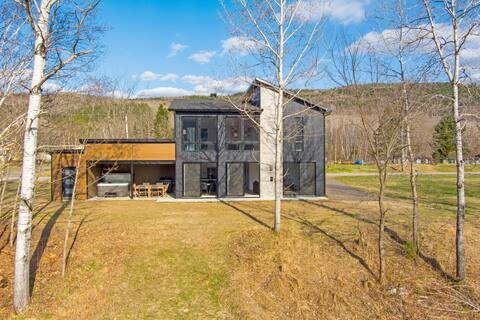
Chalet Le Panoramique with spa
Entire Place • 3 bedrooms
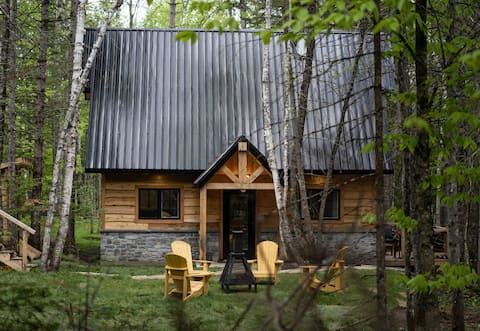
Majestic chalet with a hot tub by the water.
Entire Place • 1 bedroom
The Grandiose | Spa | Campfire | Riverside
Entire Place • 3 bedrooms
Note: Performance varies based on location, size, amenities, seasonality, and management quality. Data reflects the past 12 months.
Top Performing Airbnb Hosts in Trois-Rives (2025)
Learn from the best! This table showcases top-performing Airbnb hosts in Trois-Rives based on the number of properties managed and estimated total revenue over the past year. Analyze their scale and performance metrics.
| Host Name | Properties | Grossing Revenue | Stay Reviews | Avg Rating |
|---|---|---|---|---|
| Galaxia | 1 | $116,893 | 6 | 4.17/5.0 |
| Emmanuel | 2 | $108,994 | 59 | 4.75/5.0 |
| Dave | 2 | $107,371 | 71 | 4.87/5.0 |
| Francis | 2 | $85,393 | 24 | 4.92/5.0 |
| Mélanie | 1 | $66,777 | 123 | 4.89/5.0 |
| David | 1 | $57,091 | 106 | 4.82/5.0 |
| Ramy | 1 | $55,171 | 70 | 4.94/5.0 |
| Sabrina | 1 | $50,780 | 33 | 4.85/5.0 |
| Maxime | 1 | $40,255 | 9 | 5.00/5.0 |
| Genevieve | 1 | $39,772 | 52 | 4.92/5.0 |
Analyzing the strategies of top hosts, such as their property selection, pricing, and guest communication, can offer valuable lessons for optimizing your own Airbnb operations in Trois-Rives.
Dive Deeper: Advanced Trois-Rives STR Market Data (2025)
Ready to unlock more insights? AirROI provides access to advanced metrics and comprehensive Airbnb data for Trois-Rives. Explore detailed analytics beyond this report to refine your investment strategy, optimize pricing, and maximize your vacation rental profits.
Explore Advanced MetricsTrois-Rives Short-Term Rental Market Composition (2025): Property & Room Types
Room Type Distribution
Property Type Distribution
Market Composition Insights for Trois-Rives
- The Trois-Rives Airbnb market composition is heavily skewed towards Entire Home/Apt listings, which make up 100% of the 29 active rentals. This indicates strong guest preference for privacy and space.
- Looking at the property type distribution in Trois-Rives, House properties are the most common (86.2%), reflecting the local real estate landscape.
- Houses represent a significant 86.2% portion, catering likely to families or larger groups.
- Smaller segments like unique stays (combined 3.4%) offer potential for unique stay experiences.
Trois-Rives Airbnb Room Capacity Analysis (2025): Bedroom Distribution
Distribution of Listings by Number of Bedrooms
Room Capacity Insights for Trois-Rives
- The dominant room capacity in Trois-Rives is 3 bedrooms listings, making up 34.5% of the market. This suggests a strong demand for properties suitable for families or small groups.
- Together, 3 bedrooms and 4 bedrooms properties represent 55.2% of the active Airbnb listings in Trois-Rives, indicating a high concentration in these sizes.
- A significant 65.5% of listings offer 3+ bedrooms, catering to larger groups and families seeking more space in Trois-Rives.
Trois-Rives Vacation Rental Guest Capacity Trends (2025)
Distribution of Listings by Guest Capacity
Guest Capacity Insights for Trois-Rives
- The most common guest capacity trend in Trois-Rives vacation rentals is listings accommodating 8+ guests (62.1%). This suggests the primary traveler segment is likely larger groups.
- Properties designed for 8+ guests and 4 guests dominate the Trois-Rives STR market, accounting for 79.3% of listings.
- 79.3% of properties accommodate 6+ guests, serving the market segment for larger families or group travel in Trois-Rives.
- On average, properties in Trois-Rives are equipped to host 6.8 guests.
Trois-Rives Airbnb Booking Patterns (2025): Available vs. Booked Days
Available Days Distribution
Booked Days Distribution
Booking Pattern Insights for Trois-Rives
- The most common availability pattern in Trois-Rives falls within the 271-366 days range, representing 37.9% of listings. This suggests many properties have significant open periods on their calendars.
- Approximately 72.4% of listings show high availability (181+ days open annually), indicating potential for increased bookings or specific owner usage patterns.
- For booked days, the 91-180 days range is most frequent in Trois-Rives (41.4%), reflecting common guest stay durations or potential owner blocking patterns.
- A notable 27.5% of properties secure long booking periods (181+ days booked per year), highlighting successful long-term rental strategies or significant owner usage.
Trois-Rives Airbnb Minimum Stay Requirements Analysis
Distribution of Listings by Minimum Night Requirement
1 Night
1 listings
3.6% of total
2 Nights
15 listings
53.6% of total
7-29 Nights
3 listings
10.7% of total
30+ Nights
9 listings
32.1% of total
Key Insights
- The most prevalent minimum stay requirement in Trois-Rives is 2 Nights, adopted by 53.6% of listings. This highlights the market's preference for shorter, flexible bookings.
- A significant segment (32.1%) caters to monthly stays (30+ nights) in Trois-Rives, pointing to opportunities in the extended-stay market.
Recommendations
- Align with the market by considering a 2 Nights minimum stay, as 53.6% of Trois-Rives hosts use this setting.
- If feasible, allowing 1-night stays, especially midweek or during low season, could capture last-minute bookings, as only 3.6% currently do.
- A 2-night minimum appears standard (53.6%). Consider this for weekends or peak periods.
- Explore offering discounts for stays of 30+ nights to attract the 32.1% of the market seeking extended stays.
- Adjust minimum nights based on seasonality – potentially shorter during low season and longer during peak demand periods in Trois-Rives.
Trois-Rives Airbnb Cancellation Policy Trends Analysis (2025)
Super Strict 30 Days
1 listings
4.3% of total
Flexible
4 listings
17.4% of total
Moderate
4 listings
17.4% of total
Firm
7 listings
30.4% of total
Strict
7 listings
30.4% of total
Cancellation Policy Insights for Trois-Rives
- The prevailing Airbnb cancellation policy trend in Trois-Rives is Firm, used by 30.4% of listings.
- A majority (60.8%) of hosts in Trois-Rives utilize Firm or Strict policies, indicating a market where hosts prioritize booking security.
Recommendations for Hosts
- Consider adopting a Firm policy to align with the 30.4% market standard in Trois-Rives.
- With 30.4% using Strict terms, this is a viable option in Trois-Rives, particularly for high-value properties or during peak demand periods.
- Regularly review your cancellation policy against competitors and market demand shifts in Trois-Rives.
Trois-Rives STR Booking Lead Time Analysis (2025)
Average Booking Lead Time by Month
Booking Lead Time Insights for Trois-Rives
- The overall average booking lead time for vacation rentals in Trois-Rives is 46 days.
- Guests book furthest in advance for stays during July (average 95 days), likely coinciding with peak travel demand or local events.
- The shortest booking windows occur for stays in April (average 30 days), indicating more last-minute travel plans during this time.
- Seasonally, Summer (79 days avg.) sees the longest lead times, while Spring (34 days avg.) has the shortest, reflecting typical travel planning cycles.
Recommendations for Hosts
- Use the overall average lead time (46 days) as a baseline for your pricing and availability strategy in Trois-Rives.
- For July stays, consider implementing length-of-stay discounts or slightly higher rates for bookings made less than 95 days out to capitalize on advance planning.
- Target marketing efforts for the Summer season well in advance (at least 79 days) to capture early planners.
- Monitor your own booking lead times against these Trois-Rives averages to identify opportunities for dynamic pricing adjustments.
Popular & Essential Airbnb Amenities in Trois-Rives (2025)
Amenity Prevalence
Amenity Insights for Trois-Rives
- Essential amenities in Trois-Rives that guests expect include: TV, Free parking on premises, Smoke alarm, Kitchen, Refrigerator, Fire pit, Indoor fireplace. Lacking these (any) could significantly impact bookings.
- Popular amenities like Wifi, Heating, BBQ grill are common but not universal. Offering these can provide a competitive edge.
- Warning: Wifi is not universally provided but is considered essential globally. Ensure reliable Wifi is offered.
Recommendations for Hosts
- Ensure your listing includes all essential amenities for Trois-Rives: TV, Free parking on premises, Smoke alarm, Kitchen, Refrigerator, Fire pit, Indoor fireplace.
- Prioritize adding missing essentials: Refrigerator, Fire pit, Indoor fireplace.
- Consider adding popular differentiators like Wifi or Heating to increase appeal.
- Highlight unique or less common amenities you offer (e.g., hot tub, dedicated workspace, EV charger) in your listing description and photos.
- Regularly check competitor amenities in Trois-Rives to stay competitive.
Trois-Rives Airbnb Guest Demographics & Profile Analysis (2025)
Guest Profile Summary for Trois-Rives
- The typical guest profile for Airbnb in Trois-Rives consists of primarily domestic travelers (72%), often arriving from nearby Montreal, typically belonging to the Post-2000s (Gen Z/Alpha) group (50%), primarily speaking French or English.
- Domestic travelers account for 72.2% of guests.
- Key international markets include Canada (72.2%) and France (15.9%).
- Top languages spoken are French (44.4%) followed by English (39.1%).
- A significant demographic segment is the Post-2000s (Gen Z/Alpha) group, representing 50% of guests.
Recommendations for Hosts
- Target domestic marketing efforts towards travelers from Montreal and Québec City.
- Tailor amenities and listing descriptions to appeal to the dominant Post-2000s (Gen Z/Alpha) demographic (e.g., highlight fast WiFi, smart home features, local guides).
- Highlight unique local experiences or amenities relevant to the primary guest profile.
- Consider seasonal promotions aligned with peak travel times for key origin markets.
Nearby Short-Term Rental Market Comparison
How does the Trois-Rives Airbnb market stack up against its neighbors? Compare key performance metrics like average monthly revenue, ADR, and occupancy rates in surrounding areas to understand the broader regional STR landscape.
| Market | Active Properties | Monthly Revenue | Daily Rate | Avg. Occupancy |
|---|---|---|---|---|
| Saint-Denis-de-Brompton | 28 | $4,459 | $383.13 | 34% |
| Waterloo | 11 | $4,092 | $357.06 | 37% |
| Shannon | 25 | $3,918 | $240.28 | 51% |
| Shefford | 26 | $3,538 | $254.63 | 43% |
| Lac-Beauport | 56 | $3,512 | $213.74 | 52% |
| Stanstead (Canton) | 40 | $3,462 | $234.29 | 46% |
| Venise-en-Québec | 22 | $3,336 | $297.53 | 36% |
| Saint-Basile | 12 | $3,221 | $180.24 | 52% |
| Saint-Paulin | 14 | $3,163 | $490.55 | 33% |
| Saint-Roch-de-Mékinac | 11 | $3,108 | $314.58 | 41% |