Sherbrooke Airbnb Market Analysis 2025: Short Term Rental Data & Vacation Rental Statistics in Quebec, Canada
Is Airbnb profitable in Sherbrooke in 2025? Explore comprehensive Airbnb analytics for Sherbrooke, Quebec, Canada to uncover income potential. This 2025 STR market report for Sherbrooke, based on AirROI data from April 2024 to March 2025, reveals key trends in the niche market of 130 active listings.
Whether you're considering an Airbnb investment in Sherbrooke, optimizing your existing vacation rental, or exploring rental arbitrage opportunities, understanding the Sherbrooke Airbnb data is crucial. Navigating the high regulation landscape is key to maximizing your short term rental income potential. Let's dive into the specifics.
Key Sherbrooke Airbnb Performance Metrics Overview
Monthly Airbnb Revenue Variations & Income Potential in Sherbrooke (2025)
Understanding the monthly revenue variations for Airbnb listings in Sherbrooke is key to maximizing your short term rental income potential. Seasonality significantly impacts earnings. Our analysis, based on data from the past 12 months, shows that the peak revenue month for STRs in Sherbrooke is typically August, while January often presents the lowest earnings, highlighting opportunities for strategic pricing adjustments during shoulder and low seasons. Explore the typical Airbnb income in Sherbrooke across different performance tiers:
- Best-in-class properties (Top 10%) achieve $3,260+ monthly, often utilizing dynamic pricing and superior guest experiences.
- Strong performing properties (Top 25%) earn $2,028 or more, indicating effective management and desirable locations/amenities.
- Typical properties (Median) generate around $1,168 per month, representing the average market performance.
- Entry-level properties (Bottom 25%) see earnings around $586, often with potential for optimization.
Average Monthly Airbnb Earnings Trend in Sherbrooke
Sherbrooke Airbnb Occupancy Rate Trends (2025)
Maximize your bookings by understanding the Sherbrooke STR occupancy trends. Seasonal demand shifts significantly influence how often properties are booked. Typically, Augustsees the highest demand (peak season occupancy), while June experiences the lowest (low season). Effective strategies, like adjusting minimum stays or offering promotions, can boost occupancy during slower periods. Here's how different property tiers perform in Sherbrooke:
- Best-in-class properties (Top 10%) achieve 85%+ occupancy, indicating high desirability and potentially optimized availability.
- Strong performing properties (Top 25%) maintain 71% or higher occupancy, suggesting good market fit and guest satisfaction.
- Typical properties (Median) have an occupancy rate around 48%.
- Entry-level properties (Bottom 25%) average 26% occupancy, potentially facing higher vacancy.
Average Monthly Occupancy Rate Trend in Sherbrooke
Average Daily Rate (ADR) Airbnb Trends in Sherbrooke (2025)
Effective short term rental pricing strategy in Sherbrooke involves understanding monthly ADR fluctuations. The Average Daily Rate (ADR) for Airbnb in Sherbrooke typically peaks in December and dips lowest during April. Leveraging Airbnb dynamic pricing tools or strategies based on this seasonality can significantly boost revenue. Here's a look at the typical nightly rates achieved:
- Best-in-class properties (Top 10%) command rates of $161+ per night, often due to premium features or locations.
- Strong performing properties (Top 25%) achieve nightly rates of $101 or more.
- Typical properties (Median) charge around $63 per night.
- Entry-level properties (Bottom 25%) earn around $42 per night.
Average Daily Rate (ADR) Trend by Month in Sherbrooke
Get Live Sherbrooke Market Intelligence 👇

Explore Real-time Analytics
Airbnb Seasonality Analysis & Trends in Sherbrooke (2025)
Peak Season (August, May, July)
- Revenue averages $1,836 per month
- Occupancy rates average 57.1%
- Daily rates average $82
Shoulder Season
- Revenue averages $1,512 per month
- Occupancy maintains around 45.3%
- Daily rates hold near $82
Low Season (January, February, November)
- Revenue drops to average $1,304 per month
- Occupancy decreases to average 46.9%
- Daily rates adjust to average $82
Seasonality Insights for Sherbrooke
- The Airbnb seasonality in Sherbrooke shows moderate seasonality with distinct peak and low periods. While the sections above show seasonal averages, it's also insightful to look at the extremes:
- During the high season, the absolute peak month showcases Sherbrooke's highest earning potential, with monthly revenues capable of climbing to $1,863, occupancy reaching a high of 61.6%, and ADRs peaking at $85.
- Conversely, the slowest single month of the year, typically falling within the low season, marks the market's lowest point. In this month, revenue might dip to $1,277, occupancy could drop to 38.9%, and ADRs may adjust down to $80.
- Understanding both the seasonal averages and these monthly peaks and troughs in revenue, occupancy, and ADR is crucial for maximizing your Airbnb profit potential in Sherbrooke.
Seasonal Strategies for Maximizing Profit
- Peak Season: Maximize revenue through premium pricing and potentially longer minimum stays. Ensure high availability.
- Low Season: Offer competitive pricing, special promotions (e.g., extended stay discounts), and flexible cancellation policies. Target off-season travelers like remote workers or budget-conscious guests.
- Shoulder Seasons: Implement dynamic pricing that balances peak and low rates. Target weekend travelers or specific events. Offer slightly more flexible terms than peak season.
- Regularly analyze your own performance against these Sherbrooke seasonality benchmarks and adjust your pricing and availability strategy accordingly.
Best Areas for Airbnb Investment in Sherbrooke (2025)
Exploring the top neighborhoods for short-term rentals in Sherbrooke? This section highlights key areas, outlining why they are attractive for hosts and guests, along with notable local attractions. Consider these locations based on your target guest profile and investment strategy.
| Neighborhood / Area | Why Host Here? (Target Guests & Appeal) | Key Attractions & Landmarks |
|---|---|---|
| Brompton Park | A growing neighborhood close to the university, attracting young professionals and students. Offers affordable housing and is a prime area for short-term rentals due to its proximity to the educational hub. | Sherbrooke University, Brompton Park, La Halte des Pèlerins, Parc du Domaine-Howard, Café littéraire Les Lèvres noires |
| Downtown Sherbrooke | The vibrant core of Sherbrooke, filled with restaurants, shops, and cultural venues. Ideal for tourists looking to experience the city's nightlife and activities. | Sherbrooke Museum of Fine Arts, Place Farhat-Hadad, Theatre Granada, Le Parc Jacques-Cartier, Local cafes and restaurants |
| Fleurimont | A family-friendly neighborhood known for its parks and community life. Attractive for longer-term rentals and families visiting the region. | Parc du 4-Septembre, Parc de la Gare, Parc Rondeau, Local farmers market, Cultural community events |
| Mont-Bellevue | An area known for its natural beauty and access to outdoor activities, making it popular for those looking for a getaway spot. | Mont Bellevue Park, Lac des Nations, Biking trails, Hiking paths, Scenic viewpoints |
| Rock Forest | A suburban area that offers a mix of residential and commercial spaces, popular among families and professionals. | Parc de la Rivière-aux-Sables, Local shopping centers, Community centers, Natural parks, Family-friendly activities |
| Sherbrooke Village | Known for its historic charm and close-knit community feel. Attracts tourists seeking a quaint atmosphere with local shops and cafes. | Historic buildings, Red Carpet Cafe, Boutique shops, Cultural festivals, Annual markets |
| Lennoxville | A charming neighborhood that is home to Bishop's University, attracting students and academic visitors. Offers a lively atmosphere and cultural events. | Bishop's University, Lennoxville Heritage Walk, Local eateries, Cultural events, Parks and recreational facilities |
| Ascot Corner | A unique and picturesque area known for its vineyards and rural charm, attracting tourists looking for a peaceful retreat. | Vineyards, Scenic landscapes, Local wineries, Nature trails, Agritourism experiences |
Understanding Airbnb License Requirements & STR Laws in Sherbrooke (2025)
Yes, Sherbrooke, Quebec, Canada enforces high STR regulations. Obtaining a license and ensuring compliance is almost certainly required according to current 2025 STR laws. Always verify the latest short term rental regulations and Airbnb license requirements directly with local government authorities for Sherbrooke to ensure full compliance before hosting.
(Source: AirROI data, 2025, based on 49% licensed listings)
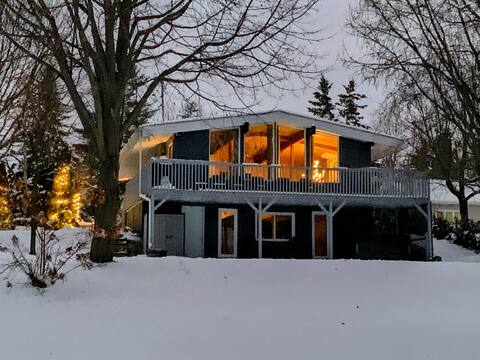
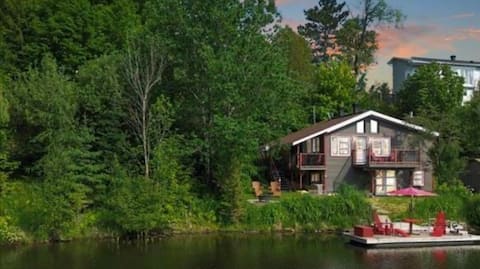
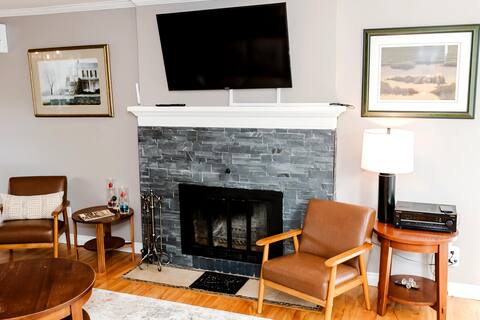
Top Performing Airbnb Properties in Sherbrooke (2025)
Benchmark your potential! Explore examples of top-performing Airbnb properties in Sherbrookebased on Trailing Twelve Month (TTM) revenue. Analyze their characteristics, revenue, occupancy rate, and ADR to understand what drives success in this market.
Beautiful cottage directly on Lake Magog!
Entire Place • 3 bedrooms
The haven of peace
Entire Place • 3 bedrooms
Small Town Oasis
Entire Place • 3 bedrooms

CHALET LAC MAGOG & COMFORT
Entire Place • 3 bedrooms

Open plan, gym, and hot tubs!
Entire Place • 2 bedrooms

4 Bedroom House
Entire Place • 4 bedrooms
Note: Performance varies based on location, size, amenities, seasonality, and management quality. Data reflects the past 12 months.
Top Performing Airbnb Hosts in Sherbrooke (2025)
Learn from the best! This table showcases top-performing Airbnb hosts in Sherbrooke based on the number of properties managed and estimated total revenue over the past year. Analyze their scale and performance metrics.
| Host Name | Properties | Grossing Revenue | Stay Reviews | Avg Rating |
|---|---|---|---|---|
| Guillaume Fontaine | 3 | $90,788 | 20 | 4.75/5.0 |
| Jean-Guy | 1 | $61,450 | 87 | 4.98/5.0 |
| Mylène | 1 | $53,610 | 32 | 4.78/5.0 |
| Elodie | 4 | $53,288 | 104 | 3.67/5.0 |
| Andrew | 1 | $52,911 | 26 | 5.00/5.0 |
| Marie-Claude | 6 | $52,394 | 1186 | 4.78/5.0 |
| Nil | 1 | $50,890 | 186 | 4.96/5.0 |
| Amalia | 1 | $39,771 | 25 | 4.96/5.0 |
| Vincent | 1 | $38,194 | 30 | 4.90/5.0 |
| Bryan | 2 | $33,969 | 245 | 4.92/5.0 |
Analyzing the strategies of top hosts, such as their property selection, pricing, and guest communication, can offer valuable lessons for optimizing your own Airbnb operations in Sherbrooke.
Dive Deeper: Advanced Sherbrooke STR Market Data (2025)
Ready to unlock more insights? AirROI provides access to advanced metrics and comprehensive Airbnb data for Sherbrooke. Explore detailed analytics beyond this report to refine your investment strategy, optimize pricing, and maximize your vacation rental profits.
Explore Advanced MetricsSherbrooke Short-Term Rental Market Composition (2025): Property & Room Types
Room Type Distribution
Property Type Distribution
Market Composition Insights for Sherbrooke
- The Sherbrooke Airbnb market composition is heavily skewed towards Entire Home/Apt listings, which make up 76.2% of the 130 active rentals. This indicates strong guest preference for privacy and space.
- Looking at the property type distribution in Sherbrooke, House properties are the most common (48.5%), reflecting the local real estate landscape.
- Houses represent a significant 48.5% portion, catering likely to families or larger groups.
- Smaller segments like hotel/boutique, outdoor/unique (combined 4.6%) offer potential for unique stay experiences.
Sherbrooke Airbnb Room Capacity Analysis (2025): Bedroom Distribution
Distribution of Listings by Number of Bedrooms
Room Capacity Insights for Sherbrooke
- The dominant room capacity in Sherbrooke is 1 bedroom listings, making up 34.6% of the market. This suggests a strong demand for properties suitable for couples or solo travelers.
- Together, 1 bedroom and 2 bedrooms properties represent 56.1% of the active Airbnb listings in Sherbrooke, indicating a high concentration in these sizes.
- A significant 25.5% of listings offer 3+ bedrooms, catering to larger groups and families seeking more space in Sherbrooke.
Sherbrooke Vacation Rental Guest Capacity Trends (2025)
Distribution of Listings by Guest Capacity
Guest Capacity Insights for Sherbrooke
- The most common guest capacity trend in Sherbrooke vacation rentals is listings accommodating 2 guests (24.6%). This suggests the primary traveler segment is likely couples or solo travelers.
- Properties designed for 2 guests and 4 guests dominate the Sherbrooke STR market, accounting for 43.8% of listings.
- 24.6% of properties accommodate 6+ guests, serving the market segment for larger families or group travel in Sherbrooke.
- On average, properties in Sherbrooke are equipped to host 3.5 guests.
Sherbrooke Airbnb Booking Patterns (2025): Available vs. Booked Days
Available Days Distribution
Booked Days Distribution
Booking Pattern Insights for Sherbrooke
- The most common availability pattern in Sherbrooke falls within the 181-270 days range, representing 39.2% of listings. This suggests many properties have significant open periods on their calendars.
- Approximately 75.4% of listings show high availability (181+ days open annually), indicating potential for increased bookings or specific owner usage patterns.
- For booked days, the 91-180 days range is most frequent in Sherbrooke (40%), reflecting common guest stay durations or potential owner blocking patterns.
- A notable 25.4% of properties secure long booking periods (181+ days booked per year), highlighting successful long-term rental strategies or significant owner usage.
Sherbrooke Airbnb Minimum Stay Requirements Analysis
Distribution of Listings by Minimum Night Requirement
1 Night
15 listings
12.5% of total
2 Nights
25 listings
20.8% of total
3 Nights
5 listings
4.2% of total
4-6 Nights
1 listings
0.8% of total
7-29 Nights
5 listings
4.2% of total
30+ Nights
69 listings
57.5% of total
Key Insights
- The most prevalent minimum stay requirement in Sherbrooke is 30+ Nights, adopted by 57.5% of listings. This highlights the market's preference for longer commitments.
- A significant segment (57.5%) caters to monthly stays (30+ nights) in Sherbrooke, pointing to opportunities in the extended-stay market.
Recommendations
- Align with the market by considering a 30+ Nights minimum stay, as 57.5% of Sherbrooke hosts use this setting.
- If feasible, allowing 1-night stays, especially midweek or during low season, could capture last-minute bookings, as only 12.5% currently do.
- Explore offering discounts for stays of 30+ nights to attract the 57.5% of the market seeking extended stays.
- Adjust minimum nights based on seasonality – potentially shorter during low season and longer during peak demand periods in Sherbrooke.
Sherbrooke Airbnb Cancellation Policy Trends Analysis (2025)
Super Strict 60 Days
3 listings
2.8% of total
Flexible
28 listings
25.7% of total
Moderate
22 listings
20.2% of total
Firm
23 listings
21.1% of total
Strict
33 listings
30.3% of total
Cancellation Policy Insights for Sherbrooke
- The prevailing Airbnb cancellation policy trend in Sherbrooke is Strict, used by 30.3% of listings.
- A majority (51.4%) of hosts in Sherbrooke utilize Firm or Strict policies, indicating a market where hosts prioritize booking security.
Recommendations for Hosts
- Consider adopting a Strict policy to align with the 30.3% market standard in Sherbrooke.
- With 30.3% using Strict terms, this is a viable option in Sherbrooke, particularly for high-value properties or during peak demand periods.
- Regularly review your cancellation policy against competitors and market demand shifts in Sherbrooke.
Sherbrooke STR Booking Lead Time Analysis (2025)
Average Booking Lead Time by Month
Booking Lead Time Insights for Sherbrooke
- The overall average booking lead time for vacation rentals in Sherbrooke is 49 days.
- Guests book furthest in advance for stays during April (average 78 days), likely coinciding with peak travel demand or local events.
- The shortest booking windows occur for stays in February (average 33 days), indicating more last-minute travel plans during this time.
- Seasonally, Spring (62 days avg.) sees the longest lead times, while Winter (42 days avg.) has the shortest, reflecting typical travel planning cycles.
Recommendations for Hosts
- Use the overall average lead time (49 days) as a baseline for your pricing and availability strategy in Sherbrooke.
- For April stays, consider implementing length-of-stay discounts or slightly higher rates for bookings made less than 78 days out to capitalize on advance planning.
- Target marketing efforts for the Spring season well in advance (at least 62 days) to capture early planners.
- Monitor your own booking lead times against these Sherbrooke averages to identify opportunities for dynamic pricing adjustments.
Popular & Essential Airbnb Amenities in Sherbrooke (2025)
Amenity Prevalence
Amenity Insights for Sherbrooke
- Essential amenities in Sherbrooke that guests expect include: Wifi, Smoke alarm, Heating, Free parking on premises. Lacking these (any) could significantly impact bookings.
- Popular amenities like Essentials, Hot water, Kitchen are common but not universal. Offering these can provide a competitive edge.
Recommendations for Hosts
- Ensure your listing includes all essential amenities for Sherbrooke: Wifi, Smoke alarm, Heating, Free parking on premises.
- Prioritize adding missing essentials: Wifi, Smoke alarm, Heating, Free parking on premises.
- Consider adding popular differentiators like Essentials or Hot water to increase appeal.
- Highlight unique or less common amenities you offer (e.g., hot tub, dedicated workspace, EV charger) in your listing description and photos.
- Regularly check competitor amenities in Sherbrooke to stay competitive.
Sherbrooke Airbnb Guest Demographics & Profile Analysis (2025)
Guest Profile Summary for Sherbrooke
- The typical guest profile for Airbnb in Sherbrooke consists of primarily domestic travelers (66%), often arriving from nearby Montreal, typically belonging to the Post-2000s (Gen Z/Alpha) group (50%), primarily speaking English or French.
- Domestic travelers account for 66.3% of guests.
- Key international markets include Canada (66.3%) and United States (14.1%).
- Top languages spoken are English (42.6%) followed by French (40.9%).
- A significant demographic segment is the Post-2000s (Gen Z/Alpha) group, representing 50% of guests.
Recommendations for Hosts
- Target domestic marketing efforts towards travelers from Montreal and Toronto.
- Tailor amenities and listing descriptions to appeal to the dominant Post-2000s (Gen Z/Alpha) demographic (e.g., highlight fast WiFi, smart home features, local guides).
- Highlight unique local experiences or amenities relevant to the primary guest profile.
- Consider seasonal promotions aligned with peak travel times for key origin markets.
Nearby Short-Term Rental Market Comparison
How does the Sherbrooke Airbnb market stack up against its neighbors? Compare key performance metrics like average monthly revenue, ADR, and occupancy rates in surrounding areas to understand the broader regional STR landscape.
| Market | Active Properties | Monthly Revenue | Daily Rate | Avg. Occupancy |
|---|---|---|---|---|
| Jefferson | 28 | $5,920 | $432.83 | 50% |
| Stowe | 842 | $4,757 | $474.92 | 41% |
| Otisfield | 11 | $4,471 | $391.16 | 43% |
| Saint-Denis-de-Brompton | 28 | $4,459 | $383.13 | 34% |
| Dalton | 13 | $4,397 | $359.89 | 45% |
| Calais | 16 | $4,320 | $299.79 | 49% |
| Woodstock | 45 | $4,116 | $385.01 | 44% |
| Waterloo | 11 | $4,092 | $357.06 | 37% |
| Topsham | 13 | $3,952 | $265.51 | 50% |
| Jericho | 23 | $3,945 | $309.71 | 54% |