Shawinigan Airbnb Market Analysis 2025: Short Term Rental Data & Vacation Rental Statistics in Quebec, Canada
Is Airbnb profitable in Shawinigan in 2025? Explore comprehensive Airbnb analytics for Shawinigan, Quebec, Canada to uncover income potential. This 2025 STR market report for Shawinigan, based on AirROI data from April 2024 to March 2025, reveals key trends in the niche market of 131 active listings.
Whether you're considering an Airbnb investment in Shawinigan, optimizing your existing vacation rental, or exploring rental arbitrage opportunities, understanding the Shawinigan Airbnb data is crucial. Navigating the high regulation landscape is key to maximizing your short term rental income potential. Let's dive into the specifics.
Key Shawinigan Airbnb Performance Metrics Overview
Monthly Airbnb Revenue Variations & Income Potential in Shawinigan (2025)
Understanding the monthly revenue variations for Airbnb listings in Shawinigan is key to maximizing your short term rental income potential. Seasonality significantly impacts earnings. Our analysis, based on data from the past 12 months, shows that the peak revenue month for STRs in Shawinigan is typically August, while March often presents the lowest earnings, highlighting opportunities for strategic pricing adjustments during shoulder and low seasons. Explore the typical Airbnb income in Shawinigan across different performance tiers:
- Best-in-class properties (Top 10%) achieve $4,320+ monthly, often utilizing dynamic pricing and superior guest experiences.
- Strong performing properties (Top 25%) earn $2,789 or more, indicating effective management and desirable locations/amenities.
- Typical properties (Median) generate around $1,528 per month, representing the average market performance.
- Entry-level properties (Bottom 25%) see earnings around $771, often with potential for optimization.
Average Monthly Airbnb Earnings Trend in Shawinigan
Shawinigan Airbnb Occupancy Rate Trends (2025)
Maximize your bookings by understanding the Shawinigan STR occupancy trends. Seasonal demand shifts significantly influence how often properties are booked. Typically, Augustsees the highest demand (peak season occupancy), while April experiences the lowest (low season). Effective strategies, like adjusting minimum stays or offering promotions, can boost occupancy during slower periods. Here's how different property tiers perform in Shawinigan:
- Best-in-class properties (Top 10%) achieve 73%+ occupancy, indicating high desirability and potentially optimized availability.
- Strong performing properties (Top 25%) maintain 56% or higher occupancy, suggesting good market fit and guest satisfaction.
- Typical properties (Median) have an occupancy rate around 39%.
- Entry-level properties (Bottom 25%) average 22% occupancy, potentially facing higher vacancy.
Average Monthly Occupancy Rate Trend in Shawinigan
Average Daily Rate (ADR) Airbnb Trends in Shawinigan (2025)
Effective short term rental pricing strategy in Shawinigan involves understanding monthly ADR fluctuations. The Average Daily Rate (ADR) for Airbnb in Shawinigan typically peaks in July and dips lowest during April. Leveraging Airbnb dynamic pricing tools or strategies based on this seasonality can significantly boost revenue. Here's a look at the typical nightly rates achieved:
- Best-in-class properties (Top 10%) command rates of $235+ per night, often due to premium features or locations.
- Strong performing properties (Top 25%) achieve nightly rates of $166 or more.
- Typical properties (Median) charge around $127 per night.
- Entry-level properties (Bottom 25%) earn around $82 per night.
Average Daily Rate (ADR) Trend by Month in Shawinigan
Get Live Shawinigan Market Intelligence 👇

Explore Real-time Analytics
Airbnb Seasonality Analysis & Trends in Shawinigan (2025)
Peak Season (August, July, June)
- Revenue averages $3,007 per month
- Occupancy rates average 53.4%
- Daily rates average $153
Shoulder Season
- Revenue averages $1,974 per month
- Occupancy maintains around 38.8%
- Daily rates hold near $147
Low Season (January, March, November)
- Revenue drops to average $1,452 per month
- Occupancy decreases to average 30.7%
- Daily rates adjust to average $148
Seasonality Insights for Shawinigan
- The Airbnb seasonality in Shawinigan shows highly seasonal trends requiring careful strategy. While the sections above show seasonal averages, it's also insightful to look at the extremes:
- During the high season, the absolute peak month showcases Shawinigan's highest earning potential, with monthly revenues capable of climbing to $3,336, occupancy reaching a high of 64.3%, and ADRs peaking at $155.
- Conversely, the slowest single month of the year, typically falling within the low season, marks the market's lowest point. In this month, revenue might dip to $1,308, occupancy could drop to 29.4%, and ADRs may adjust down to $144.
- Understanding both the seasonal averages and these monthly peaks and troughs in revenue, occupancy, and ADR is crucial for maximizing your Airbnb profit potential in Shawinigan.
Seasonal Strategies for Maximizing Profit
- Peak Season: Maximize revenue through premium pricing and potentially longer minimum stays. Ensure high availability.
- Low Season: Offer competitive pricing, special promotions (e.g., extended stay discounts), and flexible cancellation policies. Target off-season travelers like remote workers or budget-conscious guests.
- Shoulder Seasons: Implement dynamic pricing that balances peak and low rates. Target weekend travelers or specific events. Offer slightly more flexible terms than peak season.
- Regularly analyze your own performance against these Shawinigan seasonality benchmarks and adjust your pricing and availability strategy accordingly.
Best Areas for Airbnb Investment in Shawinigan (2025)
Exploring the top neighborhoods for short-term rentals in Shawinigan? This section highlights key areas, outlining why they are attractive for hosts and guests, along with notable local attractions. Consider these locations based on your target guest profile and investment strategy.
| Neighborhood / Area | Why Host Here? (Target Guests & Appeal) | Key Attractions & Landmarks |
|---|---|---|
| Mauricie Region | The entire Mauricie region is popular for outdoor activities, and Shawinigan serves as an excellent base to explore the beauty of the rivers and forests. Tourists flock to the region for its nature and recreational activities. | La Mauricie National Park, Barrage de la Rivière Saint-Maurice, Parc de la Cité, Historic Shawinigan, Les Jardins de la Paix |
| Shawinigan Falls | This area is famous for its stunning waterfalls and vibrant natural scenery, making it ideal for tourists looking to experience the natural beauty of Quebec. | Shawinigan Falls, Parc de l'Île de la Cité, Cité de l'énergie, Le Parc des Chutes, Parc de la Rivière |
| Downtown Shawinigan | Urban area with shops, eateries, and access to local culture. A variety of services and a vibrant atmosphere attract both business travelers and tourists. | Shawinigan Arts Centre, Café l'Innocence, Local shops and boutiques, Le Balcon de l'Art, Festival de la Pêche |
| La Cité de l'énergie | A unique energy-themed park that provides entertainment and education, appealing to families and educational groups. | Cité de l'énergie, Tour of the hydropower plant, Interactive exhibits, Theater shows, Rides and games |
| Borough of Shawinigan-Sud | A residential area that offers a quieter experience with good access to outdoor activities and local amenities. | Parc des Chutes, Natural trails, Local community events, Shops in Shawinigan-Sud |
| Pointe-du-Lac | A picturesque area along the Saint-Lawrence River, offering stunning views and a peaceful environment, perfect for a getaway. | Saint-Lawrence River views, Local parks, Historic sites, Nearby hiking trails |
| Grand-Mère | A charming neighborhood that boasts rich history and a sense of community, attracting visitors who are interested in local heritage. | Heritage sites, Local festivals, Shopping and dining options, Cultural events |
| Technopole of Shawinigan | Home to several tech companies and research institutions, this area attracts business travelers and professionals. | Innovation center, Workshops and events, Local businesses, High-tech industry tours |
Understanding Airbnb License Requirements & STR Laws in Shawinigan (2025)
Yes, Shawinigan, Quebec, Canada enforces high STR regulations. Obtaining a license and ensuring compliance is almost certainly required according to current 2025 STR laws. Always verify the latest short term rental regulations and Airbnb license requirements directly with local government authorities for Shawinigan to ensure full compliance before hosting.
(Source: AirROI data, 2025, based on 83% licensed listings)
Top Performing Airbnb Properties in Shawinigan (2025)
Benchmark your potential! Explore examples of top-performing Airbnb properties in Shawiniganbased on Trailing Twelve Month (TTM) revenue. Analyze their characteristics, revenue, occupancy rate, and ADR to understand what drives success in this market.
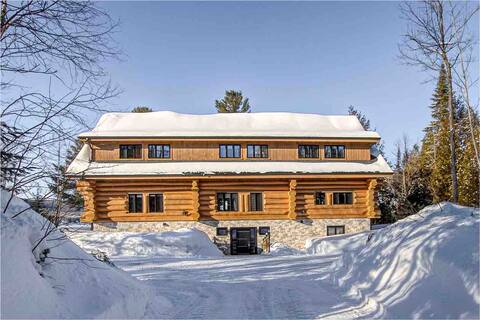
Domaine la pitoune
Entire Place • 8 bedrooms
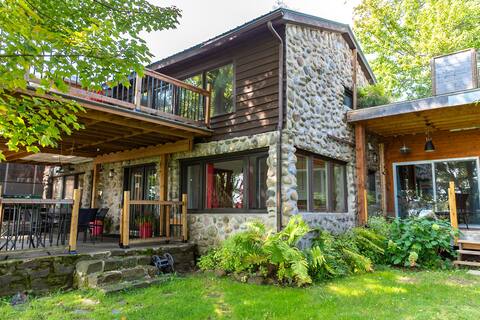
Turtle Lake Chalet | Spa | Waterfront
Entire Place • 6 bedrooms
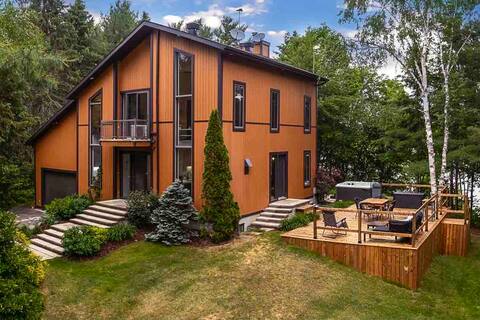
The Mauricie Oasis
Entire Place • 4 bedrooms
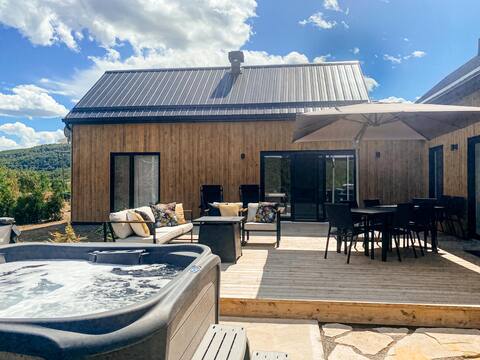
Chalet with SPA located on the banks of the Saint-Maurice.
Entire Place • 3 bedrooms

Parc de la Mauricie - Suite le Chrétien
Entire Place • 2 bedrooms

Chalet au bord de l'eau
Entire Place • 3 bedrooms
Note: Performance varies based on location, size, amenities, seasonality, and management quality. Data reflects the past 12 months.
Top Performing Airbnb Hosts in Shawinigan (2025)
Learn from the best! This table showcases top-performing Airbnb hosts in Shawinigan based on the number of properties managed and estimated total revenue over the past year. Analyze their scale and performance metrics.
| Host Name | Properties | Grossing Revenue | Stay Reviews | Avg Rating |
|---|---|---|---|---|
| Nature Nature Inc. | 21 | $535,840 | 656 | 4.88/5.0 |
| Steeve | 16 | $298,594 | 75 | 2.35/5.0 |
| Dylan | 1 | $153,811 | 53 | 4.98/5.0 |
| Galaxia | 1 | $84,957 | 9 | 4.22/5.0 |
| Martin | 5 | $82,908 | 600 | 4.86/5.0 |
| Marie-Andrée | 1 | $64,810 | 77 | 5.00/5.0 |
| Josee | 6 | $61,350 | 248 | 4.83/5.0 |
| Host #212545045 | 1 | $51,759 | 23 | 4.96/5.0 |
| Charles | 1 | $44,956 | 54 | 4.96/5.0 |
| Manon | 2 | $44,015 | 116 | 4.94/5.0 |
Analyzing the strategies of top hosts, such as their property selection, pricing, and guest communication, can offer valuable lessons for optimizing your own Airbnb operations in Shawinigan.
Dive Deeper: Advanced Shawinigan STR Market Data (2025)
Ready to unlock more insights? AirROI provides access to advanced metrics and comprehensive Airbnb data for Shawinigan. Explore detailed analytics beyond this report to refine your investment strategy, optimize pricing, and maximize your vacation rental profits.
Explore Advanced MetricsShawinigan Short-Term Rental Market Composition (2025): Property & Room Types
Room Type Distribution
Property Type Distribution
Market Composition Insights for Shawinigan
- The Shawinigan Airbnb market composition is heavily skewed towards Entire Home/Apt listings, which make up 75.6% of the 131 active rentals. This indicates strong guest preference for privacy and space.
- Looking at the property type distribution in Shawinigan, House properties are the most common (61.8%), reflecting the local real estate landscape.
- Houses represent a significant 61.8% portion, catering likely to families or larger groups.
- The presence of 18.3% Hotel/Boutique listings indicates integration with traditional hospitality.
- Smaller segments like outdoor/unique, others (combined 3.9%) offer potential for unique stay experiences.
Shawinigan Airbnb Room Capacity Analysis (2025): Bedroom Distribution
Distribution of Listings by Number of Bedrooms
Room Capacity Insights for Shawinigan
- The dominant room capacity in Shawinigan is 1 bedroom listings, making up 35.9% of the market. This suggests a strong demand for properties suitable for couples or solo travelers.
- Together, 1 bedroom and 2 bedrooms properties represent 57.3% of the active Airbnb listings in Shawinigan, indicating a high concentration in these sizes.
- A significant 23.7% of listings offer 3+ bedrooms, catering to larger groups and families seeking more space in Shawinigan.
Shawinigan Vacation Rental Guest Capacity Trends (2025)
Distribution of Listings by Guest Capacity
Guest Capacity Insights for Shawinigan
- The most common guest capacity trend in Shawinigan vacation rentals is listings accommodating 4 guests (26%). This suggests the primary traveler segment is likely small families or groups.
- Properties designed for 4 guests and 2 guests dominate the Shawinigan STR market, accounting for 48.9% of listings.
- 29.1% of properties accommodate 6+ guests, serving the market segment for larger families or group travel in Shawinigan.
- On average, properties in Shawinigan are equipped to host 3.8 guests.
Shawinigan Airbnb Booking Patterns (2025): Available vs. Booked Days
Available Days Distribution
Booked Days Distribution
Booking Pattern Insights for Shawinigan
- The most common availability pattern in Shawinigan falls within the 181-270 days range, representing 41.2% of listings. This suggests many properties have significant open periods on their calendars.
- Approximately 75.6% of listings show high availability (181+ days open annually), indicating potential for increased bookings or specific owner usage patterns.
- For booked days, the 91-180 days range is most frequent in Shawinigan (42%), reflecting common guest stay durations or potential owner blocking patterns.
- A notable 24.4% of properties secure long booking periods (181+ days booked per year), highlighting successful long-term rental strategies or significant owner usage.
Shawinigan Airbnb Minimum Stay Requirements Analysis
Distribution of Listings by Minimum Night Requirement
1 Night
50 listings
40.3% of total
2 Nights
28 listings
22.6% of total
3 Nights
4 listings
3.2% of total
4-6 Nights
1 listings
0.8% of total
7-29 Nights
21 listings
16.9% of total
30+ Nights
20 listings
16.1% of total
Key Insights
- The most prevalent minimum stay requirement in Shawinigan is 1 Night, adopted by 40.3% of listings. This highlights the market's preference for shorter, flexible bookings.
- A strong majority (62.9%) of the Shawinigan Airbnb data shows acceptance of very short stays (1-2 nights), indicating a dynamic, high-turnover market.
- A significant segment (16.1%) caters to monthly stays (30+ nights) in Shawinigan, pointing to opportunities in the extended-stay market.
Recommendations
- Align with the market by considering a 1 Night minimum stay, as 40.3% of Shawinigan hosts use this setting.
- Explore offering discounts for stays of 30+ nights to attract the 16.1% of the market seeking extended stays.
- Adjust minimum nights based on seasonality – potentially shorter during low season and longer during peak demand periods in Shawinigan.
Shawinigan Airbnb Cancellation Policy Trends Analysis (2025)
Flexible
36 listings
30.8% of total
Moderate
22 listings
18.8% of total
Firm
25 listings
21.4% of total
Strict
34 listings
29.1% of total
Cancellation Policy Insights for Shawinigan
- The prevailing Airbnb cancellation policy trend in Shawinigan is Flexible, used by 30.8% of listings.
- A majority (50.5%) of hosts in Shawinigan utilize Firm or Strict policies, indicating a market where hosts prioritize booking security.
Recommendations for Hosts
- Consider adopting a Flexible policy to align with the 30.8% market standard in Shawinigan.
- Regularly review your cancellation policy against competitors and market demand shifts in Shawinigan.
Shawinigan STR Booking Lead Time Analysis (2025)
Average Booking Lead Time by Month
Booking Lead Time Insights for Shawinigan
- The overall average booking lead time for vacation rentals in Shawinigan is 57 days.
- Guests book furthest in advance for stays during July (average 85 days), likely coinciding with peak travel demand or local events.
- The shortest booking windows occur for stays in November (average 39 days), indicating more last-minute travel plans during this time.
- Seasonally, Summer (77 days avg.) sees the longest lead times, while Winter (50 days avg.) has the shortest, reflecting typical travel planning cycles.
Recommendations for Hosts
- Use the overall average lead time (57 days) as a baseline for your pricing and availability strategy in Shawinigan.
- For July stays, consider implementing length-of-stay discounts or slightly higher rates for bookings made less than 85 days out to capitalize on advance planning.
- Target marketing efforts for the Summer season well in advance (at least 77 days) to capture early planners.
- Monitor your own booking lead times against these Shawinigan averages to identify opportunities for dynamic pricing adjustments.
Popular & Essential Airbnb Amenities in Shawinigan (2025)
Amenity Prevalence
Amenity Insights for Shawinigan
- Essential amenities in Shawinigan that guests expect include: Smoke alarm, Heating, Free parking on premises. Lacking these (any) could significantly impact bookings.
- Popular amenities like Fire extinguisher, Essentials, Hot water are common but not universal. Offering these can provide a competitive edge.
Recommendations for Hosts
- Ensure your listing includes all essential amenities for Shawinigan: Smoke alarm, Heating, Free parking on premises.
- Prioritize adding missing essentials: Smoke alarm, Heating, Free parking on premises.
- Consider adding popular differentiators like Fire extinguisher or Essentials to increase appeal.
- Highlight unique or less common amenities you offer (e.g., hot tub, dedicated workspace, EV charger) in your listing description and photos.
- Regularly check competitor amenities in Shawinigan to stay competitive.
Shawinigan Airbnb Guest Demographics & Profile Analysis (2025)
Guest Profile Summary for Shawinigan
- The typical guest profile for Airbnb in Shawinigan consists of a mix of domestic (42%) and international guests, with top international origins including France, typically belonging to the Post-2000s (Gen Z/Alpha) group (50%), primarily speaking French or English.
- Domestic travelers account for 42.4% of guests.
- Key international markets include Canada (42.4%) and France (41.8%).
- Top languages spoken are French (42.5%) followed by English (38.9%).
- A significant demographic segment is the Post-2000s (Gen Z/Alpha) group, representing 50% of guests.
Recommendations for Hosts
- Balance marketing efforts between domestic and international channels based on the guest mix.
- Tailor amenities and listing descriptions to appeal to the dominant Post-2000s (Gen Z/Alpha) demographic (e.g., highlight fast WiFi, smart home features, local guides).
- Highlight unique local experiences or amenities relevant to the primary guest profile.
- Consider seasonal promotions aligned with peak travel times for key origin markets.
Nearby Short-Term Rental Market Comparison
How does the Shawinigan Airbnb market stack up against its neighbors? Compare key performance metrics like average monthly revenue, ADR, and occupancy rates in surrounding areas to understand the broader regional STR landscape.
| Market | Active Properties | Monthly Revenue | Daily Rate | Avg. Occupancy |
|---|---|---|---|---|
| Saint-Denis-de-Brompton | 28 | $4,459 | $383.13 | 34% |
| Waterloo | 11 | $4,092 | $357.06 | 37% |
| Shannon | 25 | $3,918 | $240.28 | 51% |
| Shefford | 26 | $3,538 | $254.63 | 43% |
| Lac-Beauport | 56 | $3,512 | $213.74 | 52% |
| Stanstead (Canton) | 40 | $3,462 | $234.29 | 46% |
| Venise-en-Québec | 22 | $3,336 | $297.53 | 36% |
| Saint-Basile | 12 | $3,221 | $180.24 | 52% |
| Saint-Paulin | 14 | $3,163 | $490.55 | 33% |
| Saint-Roch-de-Mékinac | 11 | $3,108 | $314.58 | 41% |