Salaberry-de-Valleyfield Airbnb Market Analysis 2025: Short Term Rental Data & Vacation Rental Statistics in Quebec, Canada
Is Airbnb profitable in Salaberry-de-Valleyfield in 2025? Explore comprehensive Airbnb analytics for Salaberry-de-Valleyfield, Quebec, Canada to uncover income potential. This 2025 STR market report for Salaberry-de-Valleyfield, based on AirROI data from April 2024 to March 2025, reveals key trends in the niche market of 19 active listings.
Whether you're considering an Airbnb investment in Salaberry-de-Valleyfield, optimizing your existing vacation rental, or exploring rental arbitrage opportunities, understanding the Salaberry-de-Valleyfield Airbnb data is crucial. Navigating the high regulation landscape is key to maximizing your short term rental income potential. Let's dive into the specifics.
Key Salaberry-de-Valleyfield Airbnb Performance Metrics Overview
Monthly Airbnb Revenue Variations & Income Potential in Salaberry-de-Valleyfield (2025)
Understanding the monthly revenue variations for Airbnb listings in Salaberry-de-Valleyfield is key to maximizing your short term rental income potential. Seasonality significantly impacts earnings. Our analysis, based on data from the past 12 months, shows that the peak revenue month for STRs in Salaberry-de-Valleyfield is typically April, while January often presents the lowest earnings, highlighting opportunities for strategic pricing adjustments during shoulder and low seasons. Explore the typical Airbnb income in Salaberry-de-Valleyfield across different performance tiers:
- Best-in-class properties (Top 10%) achieve $4,577+ monthly, often utilizing dynamic pricing and superior guest experiences.
- Strong performing properties (Top 25%) earn $1,969 or more, indicating effective management and desirable locations/amenities.
- Typical properties (Median) generate around $1,234 per month, representing the average market performance.
- Entry-level properties (Bottom 25%) see earnings around $665, often with potential for optimization.
Average Monthly Airbnb Earnings Trend in Salaberry-de-Valleyfield
Salaberry-de-Valleyfield Airbnb Occupancy Rate Trends (2025)
Maximize your bookings by understanding the Salaberry-de-Valleyfield STR occupancy trends. Seasonal demand shifts significantly influence how often properties are booked. Typically, Maysees the highest demand (peak season occupancy), while March experiences the lowest (low season). Effective strategies, like adjusting minimum stays or offering promotions, can boost occupancy during slower periods. Here's how different property tiers perform in Salaberry-de-Valleyfield:
- Best-in-class properties (Top 10%) achieve 83%+ occupancy, indicating high desirability and potentially optimized availability.
- Strong performing properties (Top 25%) maintain 66% or higher occupancy, suggesting good market fit and guest satisfaction.
- Typical properties (Median) have an occupancy rate around 42%.
- Entry-level properties (Bottom 25%) average 22% occupancy, potentially facing higher vacancy.
Average Monthly Occupancy Rate Trend in Salaberry-de-Valleyfield
Average Daily Rate (ADR) Airbnb Trends in Salaberry-de-Valleyfield (2025)
Effective short term rental pricing strategy in Salaberry-de-Valleyfield involves understanding monthly ADR fluctuations. The Average Daily Rate (ADR) for Airbnb in Salaberry-de-Valleyfield typically peaks in December and dips lowest during April. Leveraging Airbnb dynamic pricing tools or strategies based on this seasonality can significantly boost revenue. Here's a look at the typical nightly rates achieved:
- Best-in-class properties (Top 10%) command rates of $336+ per night, often due to premium features or locations.
- Strong performing properties (Top 25%) achieve nightly rates of $111 or more.
- Typical properties (Median) charge around $70 per night.
- Entry-level properties (Bottom 25%) earn around $50 per night.
Average Daily Rate (ADR) Trend by Month in Salaberry-de-Valleyfield
Get Live Salaberry-de-Valleyfield Market Intelligence 👇

Explore Real-time Analytics
Airbnb Seasonality Analysis & Trends in Salaberry-de-Valleyfield (2025)
Peak Season (April, July, May)
- Revenue averages $2,586 per month
- Occupancy rates average 53.7%
- Daily rates average $107
Shoulder Season
- Revenue averages $1,616 per month
- Occupancy maintains around 47.0%
- Daily rates hold near $117
Low Season (January, March, November)
- Revenue drops to average $1,062 per month
- Occupancy decreases to average 38.5%
- Daily rates adjust to average $128
Seasonality Insights for Salaberry-de-Valleyfield
- The Airbnb seasonality in Salaberry-de-Valleyfield shows highly seasonal trends requiring careful strategy. While the sections above show seasonal averages, it's also insightful to look at the extremes:
- During the high season, the absolute peak month showcases Salaberry-de-Valleyfield's highest earning potential, with monthly revenues capable of climbing to $2,647, occupancy reaching a high of 63.9%, and ADRs peaking at $138.
- Conversely, the slowest single month of the year, typically falling within the low season, marks the market's lowest point. In this month, revenue might dip to $919, occupancy could drop to 30.2%, and ADRs may adjust down to $106.
- Understanding both the seasonal averages and these monthly peaks and troughs in revenue, occupancy, and ADR is crucial for maximizing your Airbnb profit potential in Salaberry-de-Valleyfield.
Seasonal Strategies for Maximizing Profit
- Peak Season: Maximize revenue through premium pricing and potentially longer minimum stays. Ensure high availability.
- Low Season: Offer competitive pricing, special promotions (e.g., extended stay discounts), and flexible cancellation policies. Target off-season travelers like remote workers or budget-conscious guests.
- Shoulder Seasons: Implement dynamic pricing that balances peak and low rates. Target weekend travelers or specific events. Offer slightly more flexible terms than peak season.
- Regularly analyze your own performance against these Salaberry-de-Valleyfield seasonality benchmarks and adjust your pricing and availability strategy accordingly.
Best Areas for Airbnb Investment in Salaberry-de-Valleyfield (2025)
Exploring the top neighborhoods for short-term rentals in Salaberry-de-Valleyfield? This section highlights key areas, outlining why they are attractive for hosts and guests, along with notable local attractions. Consider these locations based on your target guest profile and investment strategy.
| Neighborhood / Area | Why Host Here? (Target Guests & Appeal) | Key Attractions & Landmarks |
|---|---|---|
| Downtown Salaberry-de-Valleyfield | The vibrant center of the city, ideal for visitors looking for shopping, dining and entertainment with easy access to local attractions. | Parc de la Riviere, Centre culturel de Valleyfield, Cinema Pavillon, Les Jardins de la Gare, Promenade de la Riviere |
| L'Anse à l'Orme | A serene and picturesque area by the water, perfect for those looking for a relaxing stay close to nature and beautiful views. | L'Anse à l'Orme Park, Waterfront views, Local walking trails, Fishing activities, Picnic areas |
| Saint-Timothée | A suburban area that offers a family-friendly atmosphere, popular with visitors seeking a quieter retreat not far from the city. | Parc Saint-Timothée, Local shops and cafes, Beach areas, Community events, Nature walks |
| Valleyfield Historic District | Rich in history and culture, this district attracts guests interested in exploring the heritage of Salaberry-de-Valleyfield. | Historic buildings, Local museums, Cultural events, Art galleries, Theatre performances |
| Parc Lefebvre | A large park ideal for outdoor activities, festivals, and family gatherings. Great for those who appreciate nature and community events. | Open green spaces, Playgrounds, Sports fields, Festival grounds, Walking paths |
| Île Saint-Jean | A charming island spot for nature lovers and those seeking outdoor adventures such as hiking and biking. | Scenic views, Bird watching, Nature trails, Cycling routes, Picnic spots |
| Cité des Arts | A district known for artistic endeavors, attracting those looking to immerse themselves in local art and creativity. | Art studios, Workshops, Galleries, Art installations, Cultural festivals |
| Beauharnois | Nearby community with a growing tourism appeal due to its waterfront location and recreational opportunities. | Beaches, Water activities, Local dining, Outdoor events, Scenic spots |
Understanding Airbnb License Requirements & STR Laws in Salaberry-de-Valleyfield (2025)
Yes, Salaberry-de-Valleyfield, Quebec, Canada enforces high STR regulations. Obtaining a license and ensuring compliance is almost certainly required according to current 2025 STR laws. Always verify the latest short term rental regulations and Airbnb license requirements directly with local government authorities for Salaberry-de-Valleyfield to ensure full compliance before hosting.
(Source: AirROI data, 2025, based on 74% licensed listings)
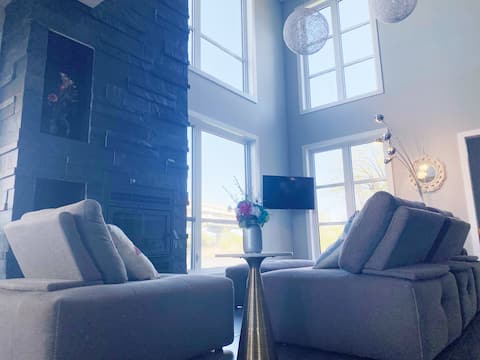
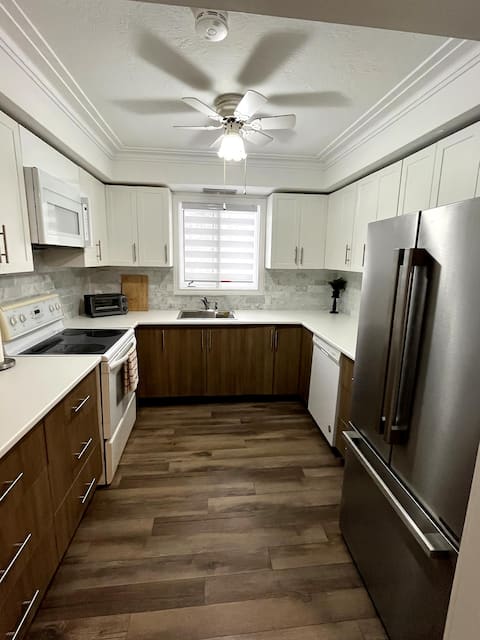
Top Performing Airbnb Properties in Salaberry-de-Valleyfield (2025)
Benchmark your potential! Explore examples of top-performing Airbnb properties in Salaberry-de-Valleyfieldbased on Trailing Twelve Month (TTM) revenue. Analyze their characteristics, revenue, occupancy rate, and ADR to understand what drives success in this market.
Summer early bird special
Entire Place • 6 bedrooms

Family gathering lake view
Entire Place • 6 bedrooms

Warm and modern
Entire Place • 2 bedrooms
Cozy Private Stay – Perfect for All Travelers
Entire Place • 1 bedroom
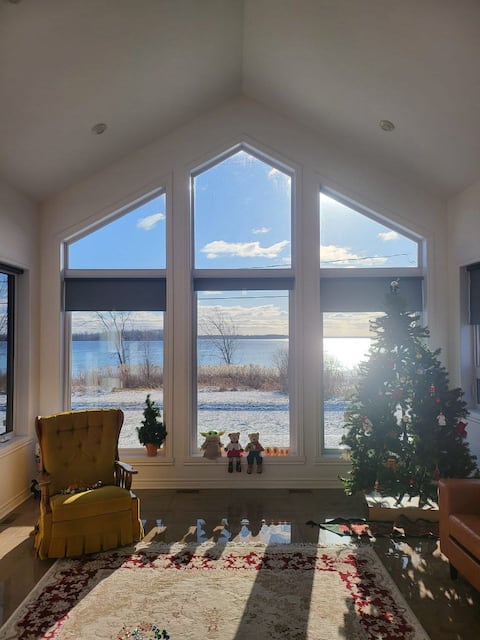
Stylish River view Chalet
Entire Place • 2 bedrooms
Sweet happiness
Entire Place • 1 bedroom
Note: Performance varies based on location, size, amenities, seasonality, and management quality. Data reflects the past 12 months.
Top Performing Airbnb Hosts in Salaberry-de-Valleyfield (2025)
Learn from the best! This table showcases top-performing Airbnb hosts in Salaberry-de-Valleyfield based on the number of properties managed and estimated total revenue over the past year. Analyze their scale and performance metrics.
| Host Name | Properties | Grossing Revenue | Stay Reviews | Avg Rating |
|---|---|---|---|---|
| Host #148205710 | 2 | $79,306 | 61 | 4.88/5.0 |
| Verne Xavier | 2 | $37,750 | 214 | 4.83/5.0 |
| Koyla Linda | 3 | $30,121 | 124 | 4.89/5.0 |
| Niloufar | 2 | $27,781 | 8 | 2.50/5.0 |
| Ayobami | 1 | $27,177 | 28 | 4.64/5.0 |
| Jonathan | 1 | $14,832 | 75 | 4.95/5.0 |
| Victor | 1 | $13,311 | 211 | 4.83/5.0 |
| Anne | 1 | $11,097 | 34 | 4.74/5.0 |
| Khalil | 1 | $8,043 | 18 | 4.39/5.0 |
| Ghyslaine | 1 | $6,341 | 37 | 4.73/5.0 |
Analyzing the strategies of top hosts, such as their property selection, pricing, and guest communication, can offer valuable lessons for optimizing your own Airbnb operations in Salaberry-de-Valleyfield.
Dive Deeper: Advanced Salaberry-de-Valleyfield STR Market Data (2025)
Ready to unlock more insights? AirROI provides access to advanced metrics and comprehensive Airbnb data for Salaberry-de-Valleyfield. Explore detailed analytics beyond this report to refine your investment strategy, optimize pricing, and maximize your vacation rental profits.
Explore Advanced MetricsSalaberry-de-Valleyfield Short-Term Rental Market Composition (2025): Property & Room Types
Room Type Distribution
Property Type Distribution
Market Composition Insights for Salaberry-de-Valleyfield
- The Salaberry-de-Valleyfield Airbnb market composition is heavily skewed towards Entire Home/Apt listings, which make up 78.9% of the 19 active rentals. This indicates strong guest preference for privacy and space.
- Looking at the property type distribution in Salaberry-de-Valleyfield, House properties are the most common (63.2%), reflecting the local real estate landscape.
- Houses represent a significant 63.2% portion, catering likely to families or larger groups.
Salaberry-de-Valleyfield Airbnb Room Capacity Analysis (2025): Bedroom Distribution
Distribution of Listings by Number of Bedrooms
Room Capacity Insights for Salaberry-de-Valleyfield
- The dominant room capacity in Salaberry-de-Valleyfield is 1 bedroom listings, making up 36.8% of the market. This suggests a strong demand for properties suitable for couples or solo travelers.
- Together, 1 bedroom and 2 bedrooms properties represent 57.9% of the active Airbnb listings in Salaberry-de-Valleyfield, indicating a high concentration in these sizes.
- A significant 21.0% of listings offer 3+ bedrooms, catering to larger groups and families seeking more space in Salaberry-de-Valleyfield.
Salaberry-de-Valleyfield Vacation Rental Guest Capacity Trends (2025)
Distribution of Listings by Guest Capacity
Guest Capacity Insights for Salaberry-de-Valleyfield
- The most common guest capacity trend in Salaberry-de-Valleyfield vacation rentals is listings accommodating 4 guests (26.3%). This suggests the primary traveler segment is likely small families or groups.
- Properties designed for 4 guests and 2 guests dominate the Salaberry-de-Valleyfield STR market, accounting for 47.4% of listings.
- 26.3% of properties accommodate 6+ guests, serving the market segment for larger families or group travel in Salaberry-de-Valleyfield.
- On average, properties in Salaberry-de-Valleyfield are equipped to host 3.4 guests.
Salaberry-de-Valleyfield Airbnb Booking Patterns (2025): Available vs. Booked Days
Available Days Distribution
Booked Days Distribution
Booking Pattern Insights for Salaberry-de-Valleyfield
- The most common availability pattern in Salaberry-de-Valleyfield falls within the 181-270 days range, representing 52.6% of listings. This suggests many properties have significant open periods on their calendars.
- Approximately 78.9% of listings show high availability (181+ days open annually), indicating potential for increased bookings or specific owner usage patterns.
- For booked days, the 91-180 days range is most frequent in Salaberry-de-Valleyfield (47.4%), reflecting common guest stay durations or potential owner blocking patterns.
- A notable 26.4% of properties secure long booking periods (181+ days booked per year), highlighting successful long-term rental strategies or significant owner usage.
Salaberry-de-Valleyfield Airbnb Minimum Stay Requirements Analysis
Distribution of Listings by Minimum Night Requirement
1 Night
4 listings
23.5% of total
2 Nights
4 listings
23.5% of total
4-6 Nights
2 listings
11.8% of total
30+ Nights
7 listings
41.2% of total
Key Insights
- The most prevalent minimum stay requirement in Salaberry-de-Valleyfield is 30+ Nights, adopted by 41.2% of listings. This highlights the market's preference for longer commitments.
- A significant segment (41.2%) caters to monthly stays (30+ nights) in Salaberry-de-Valleyfield, pointing to opportunities in the extended-stay market.
Recommendations
- Align with the market by considering a 30+ Nights minimum stay, as 41.2% of Salaberry-de-Valleyfield hosts use this setting.
- If feasible, allowing 1-night stays, especially midweek or during low season, could capture last-minute bookings, as only 23.5% currently do.
- Explore offering discounts for stays of 30+ nights to attract the 41.2% of the market seeking extended stays.
- Adjust minimum nights based on seasonality – potentially shorter during low season and longer during peak demand periods in Salaberry-de-Valleyfield.
Salaberry-de-Valleyfield Airbnb Cancellation Policy Trends Analysis (2025)
Flexible
3 listings
18.8% of total
Moderate
11 listings
68.8% of total
Firm
1 listings
6.3% of total
Strict
1 listings
6.3% of total
Cancellation Policy Insights for Salaberry-de-Valleyfield
- The prevailing Airbnb cancellation policy trend in Salaberry-de-Valleyfield is Moderate, used by 68.8% of listings.
- The market strongly favors guest-friendly terms, with 87.6% of listings offering Flexible or Moderate policies. This suggests guests in Salaberry-de-Valleyfield may expect booking flexibility.
- Strict cancellation policies are quite rare (6.3%), potentially making listings with this policy less competitive unless justified by high demand or property type.
Recommendations for Hosts
- Consider adopting a Moderate policy to align with the 68.8% market standard in Salaberry-de-Valleyfield.
- Using a Strict policy might deter some guests, as only 6.3% of listings use it. Evaluate if potential revenue protection outweighs possible lower booking rates.
- Regularly review your cancellation policy against competitors and market demand shifts in Salaberry-de-Valleyfield.
Salaberry-de-Valleyfield STR Booking Lead Time Analysis (2025)
Average Booking Lead Time by Month
Booking Lead Time Insights for Salaberry-de-Valleyfield
- The overall average booking lead time for vacation rentals in Salaberry-de-Valleyfield is 36 days.
- Guests book furthest in advance for stays during November (average 85 days), likely coinciding with peak travel demand or local events.
- The shortest booking windows occur for stays in March (average 20 days), indicating more last-minute travel plans during this time.
- Seasonally, Fall (57 days avg.) sees the longest lead times, while Winter (38 days avg.) has the shortest, reflecting typical travel planning cycles.
Recommendations for Hosts
- Use the overall average lead time (36 days) as a baseline for your pricing and availability strategy in Salaberry-de-Valleyfield.
- For November stays, consider implementing length-of-stay discounts or slightly higher rates for bookings made less than 85 days out to capitalize on advance planning.
- Target marketing efforts for the Fall season well in advance (at least 57 days) to capture early planners.
- Monitor your own booking lead times against these Salaberry-de-Valleyfield averages to identify opportunities for dynamic pricing adjustments.
Popular & Essential Airbnb Amenities in Salaberry-de-Valleyfield (2025)
Amenity Prevalence
Amenity Insights for Salaberry-de-Valleyfield
- Essential amenities in Salaberry-de-Valleyfield that guests expect include: Free parking on premises, Wifi, Smoke alarm. Lacking these (any) could significantly impact bookings.
- Popular amenities like Hot water, Kitchen, Dedicated workspace are common but not universal. Offering these can provide a competitive edge.
Recommendations for Hosts
- Ensure your listing includes all essential amenities for Salaberry-de-Valleyfield: Free parking on premises, Wifi, Smoke alarm.
- Consider adding popular differentiators like Hot water or Kitchen to increase appeal.
- Highlight unique or less common amenities you offer (e.g., hot tub, dedicated workspace, EV charger) in your listing description and photos.
- Regularly check competitor amenities in Salaberry-de-Valleyfield to stay competitive.
Salaberry-de-Valleyfield Airbnb Guest Demographics & Profile Analysis (2025)
Guest Profile Summary for Salaberry-de-Valleyfield
- The typical guest profile for Airbnb in Salaberry-de-Valleyfield consists of primarily domestic travelers (79%), often arriving from nearby Ottawa, typically belonging to the Post-2000s (Gen Z/Alpha) group (50%), primarily speaking English or French.
- Domestic travelers account for 79.3% of guests.
- Key international markets include Canada (79.3%) and United States (8.5%).
- Top languages spoken are English (45.9%) followed by French (29.1%).
- A significant demographic segment is the Post-2000s (Gen Z/Alpha) group, representing 50% of guests.
Recommendations for Hosts
- Target domestic marketing efforts towards travelers from Ottawa and Toronto.
- Tailor amenities and listing descriptions to appeal to the dominant Post-2000s (Gen Z/Alpha) demographic (e.g., highlight fast WiFi, smart home features, local guides).
- Highlight unique local experiences or amenities relevant to the primary guest profile.
- Consider seasonal promotions aligned with peak travel times for key origin markets.
Nearby Short-Term Rental Market Comparison
How does the Salaberry-de-Valleyfield Airbnb market stack up against its neighbors? Compare key performance metrics like average monthly revenue, ADR, and occupancy rates in surrounding areas to understand the broader regional STR landscape.
| Market | Active Properties | Monthly Revenue | Daily Rate | Avg. Occupancy |
|---|---|---|---|---|
| Mille-Isles | 93 | $5,049 | $415.08 | 41% |
| Malletts Bay | 49 | $4,960 | $414.58 | 48% |
| Wilmington | 130 | $4,484 | $324.06 | 45% |
| Grenville-sur-la-Rouge | 32 | $4,226 | $362.40 | 41% |
| Middlebury | 52 | $4,128 | $288.39 | 54% |
| New Haven | 12 | $3,904 | $206.65 | 58% |
| South Burlington | 103 | $3,864 | $291.90 | 50% |
| La Conception | 172 | $3,846 | $290.12 | 42% |
| Town of North Elba | 249 | $3,765 | $395.96 | 41% |
| Cantley | 22 | $3,741 | $242.96 | 50% |