Sainte-Rose-du-Nord Airbnb Market Analysis 2025: Short Term Rental Data & Vacation Rental Statistics in Quebec, Canada
Is Airbnb profitable in Sainte-Rose-du-Nord in 2025? Explore comprehensive Airbnb analytics for Sainte-Rose-du-Nord, Quebec, Canada to uncover income potential. This 2025 STR market report for Sainte-Rose-du-Nord, based on AirROI data from April 2024 to March 2025, reveals key trends in the niche market of 26 active listings.
Whether you're considering an Airbnb investment in Sainte-Rose-du-Nord, optimizing your existing vacation rental, or exploring rental arbitrage opportunities, understanding the Sainte-Rose-du-Nord Airbnb data is crucial. Navigating the high regulation landscape is key to maximizing your short term rental income potential. Let's dive into the specifics.
Key Sainte-Rose-du-Nord Airbnb Performance Metrics Overview
Monthly Airbnb Revenue Variations & Income Potential in Sainte-Rose-du-Nord (2025)
Understanding the monthly revenue variations for Airbnb listings in Sainte-Rose-du-Nord is key to maximizing your short term rental income potential. Seasonality significantly impacts earnings. Our analysis, based on data from the past 12 months, shows that the peak revenue month for STRs in Sainte-Rose-du-Nord is typically May, while January often presents the lowest earnings, highlighting opportunities for strategic pricing adjustments during shoulder and low seasons. Explore the typical Airbnb income in Sainte-Rose-du-Nord across different performance tiers:
- Best-in-class properties (Top 10%) achieve $4,607+ monthly, often utilizing dynamic pricing and superior guest experiences.
- Strong performing properties (Top 25%) earn $3,877 or more, indicating effective management and desirable locations/amenities.
- Typical properties (Median) generate around $2,211 per month, representing the average market performance.
- Entry-level properties (Bottom 25%) see earnings around $947, often with potential for optimization.
Average Monthly Airbnb Earnings Trend in Sainte-Rose-du-Nord
Sainte-Rose-du-Nord Airbnb Occupancy Rate Trends (2025)
Maximize your bookings by understanding the Sainte-Rose-du-Nord STR occupancy trends. Seasonal demand shifts significantly influence how often properties are booked. Typically, Augustsees the highest demand (peak season occupancy), while June experiences the lowest (low season). Effective strategies, like adjusting minimum stays or offering promotions, can boost occupancy during slower periods. Here's how different property tiers perform in Sainte-Rose-du-Nord:
- Best-in-class properties (Top 10%) achieve 76%+ occupancy, indicating high desirability and potentially optimized availability.
- Strong performing properties (Top 25%) maintain 60% or higher occupancy, suggesting good market fit and guest satisfaction.
- Typical properties (Median) have an occupancy rate around 39%.
- Entry-level properties (Bottom 25%) average 17% occupancy, potentially facing higher vacancy.
Average Monthly Occupancy Rate Trend in Sainte-Rose-du-Nord
Average Daily Rate (ADR) Airbnb Trends in Sainte-Rose-du-Nord (2025)
Effective short term rental pricing strategy in Sainte-Rose-du-Nord involves understanding monthly ADR fluctuations. The Average Daily Rate (ADR) for Airbnb in Sainte-Rose-du-Nord typically peaks in July and dips lowest during November. Leveraging Airbnb dynamic pricing tools or strategies based on this seasonality can significantly boost revenue. Here's a look at the typical nightly rates achieved:
- Best-in-class properties (Top 10%) command rates of $235+ per night, often due to premium features or locations.
- Strong performing properties (Top 25%) achieve nightly rates of $174 or more.
- Typical properties (Median) charge around $151 per night.
- Entry-level properties (Bottom 25%) earn around $126 per night.
Average Daily Rate (ADR) Trend by Month in Sainte-Rose-du-Nord
Get Live Sainte-Rose-du-Nord Market Intelligence 👇

Explore Real-time Analytics
Airbnb Seasonality Analysis & Trends in Sainte-Rose-du-Nord (2025)
Peak Season (May, August, April)
- Revenue averages $3,608 per month
- Occupancy rates average 44.6%
- Daily rates average $157
Shoulder Season
- Revenue averages $2,328 per month
- Occupancy maintains around 43.1%
- Daily rates hold near $156
Low Season (January, March, December)
- Revenue drops to average $1,576 per month
- Occupancy decreases to average 30.1%
- Daily rates adjust to average $156
Seasonality Insights for Sainte-Rose-du-Nord
- The Airbnb seasonality in Sainte-Rose-du-Nord shows highly seasonal trends requiring careful strategy. While the sections above show seasonal averages, it's also insightful to look at the extremes:
- During the high season, the absolute peak month showcases Sainte-Rose-du-Nord's highest earning potential, with monthly revenues capable of climbing to $3,835, occupancy reaching a high of 66.9%, and ADRs peaking at $164.
- Conversely, the slowest single month of the year, typically falling within the low season, marks the market's lowest point. In this month, revenue might dip to $1,523, occupancy could drop to 23.7%, and ADRs may adjust down to $149.
- Understanding both the seasonal averages and these monthly peaks and troughs in revenue, occupancy, and ADR is crucial for maximizing your Airbnb profit potential in Sainte-Rose-du-Nord.
Seasonal Strategies for Maximizing Profit
- Peak Season: Maximize revenue through premium pricing and potentially longer minimum stays. Ensure high availability.
- Low Season: Offer competitive pricing, special promotions (e.g., extended stay discounts), and flexible cancellation policies. Target off-season travelers like remote workers or budget-conscious guests.
- Shoulder Seasons: Implement dynamic pricing that balances peak and low rates. Target weekend travelers or specific events. Offer slightly more flexible terms than peak season.
- Regularly analyze your own performance against these Sainte-Rose-du-Nord seasonality benchmarks and adjust your pricing and availability strategy accordingly.
Best Areas for Airbnb Investment in Sainte-Rose-du-Nord (2025)
Exploring the top neighborhoods for short-term rentals in Sainte-Rose-du-Nord? This section highlights key areas, outlining why they are attractive for hosts and guests, along with notable local attractions. Consider these locations based on your target guest profile and investment strategy.
| Neighborhood / Area | Why Host Here? (Target Guests & Appeal) | Key Attractions & Landmarks |
|---|---|---|
| Les Jardins de Sainte-Rose | A tranquil area known for its beautiful gardens and proximity to nature. Ideal for guests seeking relaxation and outdoor activities. | Sainte-Rose-du-Nord Gardens, Monts Valin National Park, Lac des Écorces, Hiking trails, Scenic viewpoints |
| Historic Sainte-Rose | The historical heart of Sainte-Rose-du-Nord, featuring charming architecture and a rich cultural heritage. Perfect for history enthusiasts and culture seekers. | Sainte-Rose-du-Nord Church, Local artisan shops, Cultural festivals, Historical plaques, Guided tours |
| Lac Saint-Jean | A picturesque location by the lake, perfect for water activities and nature retreats. Attracts families and outdoor lovers. | Kayaking, Fishing, Beach areas, Lac Saint-Jean Park, Walking trails |
| Nature Trails | Known for its extensive trail networks, catering to outdoorsy individuals and adventure seekers. Popular for hiking, biking, and wildlife watching. | Hiking paths, Wildlife observation, Picnic areas, Scenic nature spots, Mountain biking trails |
| Sainte-Rose-du-Nord Mountain | An area providing stunning views and excellent hiking opportunities. Popular among nature photographers and hikers. | Viewing platforms, Mountain trails, Birdwatching, Photography spots |
| Local Cuisine | A hotspot for foodies eager to experience Quebecois culture through its delicious cuisine. Offers culinary experiences and local favorites. | Local bistros, Food festivals, Culinary workshops, Traditional Quebec food |
| Winter Activities | A winter wonderland perfect for skiing, snowshoeing, and winter sports enthusiasts. | Ski resorts, Snowshoeing trails, Winter festival, Ice fishing, Snowmobile rentals |
| Cultural Events | Known for its vibrant cultural scene and seasonal festivals, attracting visitors looking to immerse themselves in local culture. | Annual festivals, Local art shows, Music events, Craft fairs, Theater performances |
Understanding Airbnb License Requirements & STR Laws in Sainte-Rose-du-Nord (2025)
Yes, Sainte-Rose-du-Nord, Quebec, Canada enforces high STR regulations. Obtaining a license and ensuring compliance is almost certainly required according to current 2025 STR laws. Always verify the latest short term rental regulations and Airbnb license requirements directly with local government authorities for Sainte-Rose-du-Nord to ensure full compliance before hosting.
(Source: AirROI data, 2025, based on 96% licensed listings)
Top Performing Airbnb Properties in Sainte-Rose-du-Nord (2025)
Benchmark your potential! Explore examples of top-performing Airbnb properties in Sainte-Rose-du-Nordbased on Trailing Twelve Month (TTM) revenue. Analyze their characteristics, revenue, occupancy rate, and ADR to understand what drives success in this market.
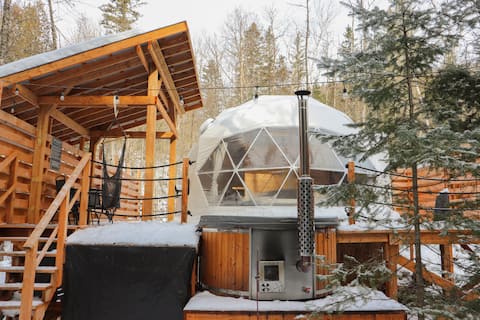
The magic of a Dome in nature with Spa and River
Entire Place • 2 bedrooms

Waterfront/River Luxurious Shack in Forest
Entire Place • 1 bedroom

Luxurious Yurt With River & Private Nordic Bath
Entire Place • N/A

Pod Hobbit Féérique with Spa and River
Entire Place • 2 bedrooms
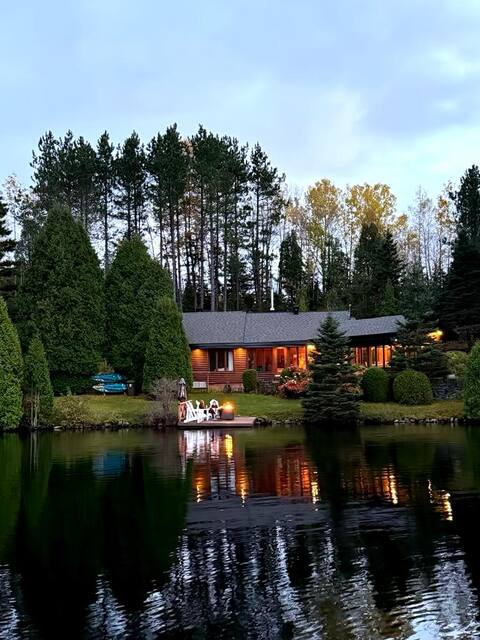
Chalet in Sainte-Rose-du-Nord "La Perle du Fjord"
Entire Place • 4 bedrooms
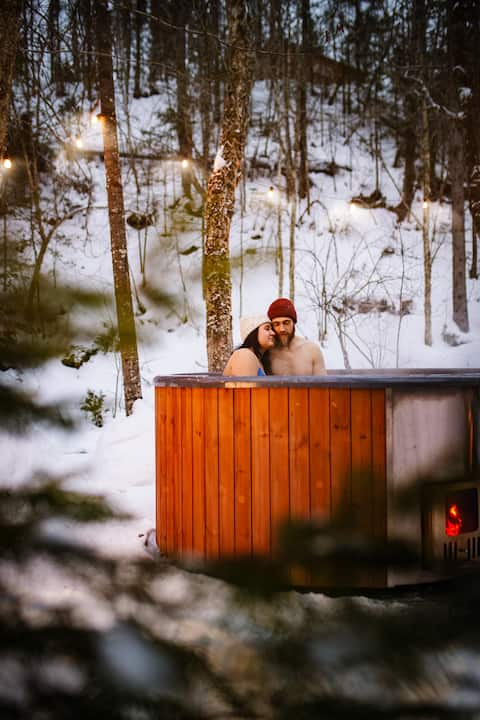
River/ Wooden hottub The Farmhouse in Forest
Entire Place • 2 bedrooms
Note: Performance varies based on location, size, amenities, seasonality, and management quality. Data reflects the past 12 months.
Top Performing Airbnb Hosts in Sainte-Rose-du-Nord (2025)
Learn from the best! This table showcases top-performing Airbnb hosts in Sainte-Rose-du-Nord based on the number of properties managed and estimated total revenue over the past year. Analyze their scale and performance metrics.
| Host Name | Properties | Grossing Revenue | Stay Reviews | Avg Rating |
|---|---|---|---|---|
| Vicky | 4 | $212,272 | 428 | 4.98/5.0 |
| Gabrielle | 2 | $66,207 | 91 | 5.00/5.0 |
| Rose Du Fjord | 2 | $61,046 | 82 | 4.83/5.0 |
| Valérie | 1 | $50,016 | 17 | 5.00/5.0 |
| Linda | 3 | $46,517 | 245 | 4.72/5.0 |
| Rosalie | 1 | $31,648 | 75 | 4.71/5.0 |
| Madeleine | 1 | $20,573 | 66 | 4.94/5.0 |
| Chantale | 1 | $15,615 | 100 | 4.90/5.0 |
| Monique | 1 | $15,412 | 436 | 4.81/5.0 |
| Manon Et Gilles | 2 | $15,156 | 74 | 4.71/5.0 |
Analyzing the strategies of top hosts, such as their property selection, pricing, and guest communication, can offer valuable lessons for optimizing your own Airbnb operations in Sainte-Rose-du-Nord.
Dive Deeper: Advanced Sainte-Rose-du-Nord STR Market Data (2025)
Ready to unlock more insights? AirROI provides access to advanced metrics and comprehensive Airbnb data for Sainte-Rose-du-Nord. Explore detailed analytics beyond this report to refine your investment strategy, optimize pricing, and maximize your vacation rental profits.
Explore Advanced MetricsSainte-Rose-du-Nord Short-Term Rental Market Composition (2025): Property & Room Types
Room Type Distribution
Property Type Distribution
Market Composition Insights for Sainte-Rose-du-Nord
- The Sainte-Rose-du-Nord Airbnb market composition is heavily skewed towards Entire Home/Apt listings, which make up 88.5% of the 26 active rentals. This indicates strong guest preference for privacy and space.
- Looking at the property type distribution in Sainte-Rose-du-Nord, House properties are the most common (57.7%), reflecting the local real estate landscape.
- Houses represent a significant 57.7% portion, catering likely to families or larger groups.
- The presence of 15.4% Hotel/Boutique listings indicates integration with traditional hospitality.
- Smaller segments like others, unique stays, outdoor/unique (combined 11.4%) offer potential for unique stay experiences.
Sainte-Rose-du-Nord Airbnb Room Capacity Analysis (2025): Bedroom Distribution
Distribution of Listings by Number of Bedrooms
Room Capacity Insights for Sainte-Rose-du-Nord
- The dominant room capacity in Sainte-Rose-du-Nord is 1 bedroom listings, making up 26.9% of the market. This suggests a strong demand for properties suitable for couples or solo travelers.
- Together, 1 bedroom and 2 bedrooms properties represent 50.0% of the active Airbnb listings in Sainte-Rose-du-Nord, indicating a high concentration in these sizes.
- A significant 30.7% of listings offer 3+ bedrooms, catering to larger groups and families seeking more space in Sainte-Rose-du-Nord.
Sainte-Rose-du-Nord Vacation Rental Guest Capacity Trends (2025)
Distribution of Listings by Guest Capacity
Guest Capacity Insights for Sainte-Rose-du-Nord
- The most common guest capacity trend in Sainte-Rose-du-Nord vacation rentals is listings accommodating 8+ guests (23.1%). This suggests the primary traveler segment is likely larger groups.
- Properties designed for 8+ guests and 4 guests dominate the Sainte-Rose-du-Nord STR market, accounting for 46.2% of listings.
- 42.3% of properties accommodate 6+ guests, serving the market segment for larger families or group travel in Sainte-Rose-du-Nord.
- On average, properties in Sainte-Rose-du-Nord are equipped to host 4.9 guests.
Sainte-Rose-du-Nord Airbnb Booking Patterns (2025): Available vs. Booked Days
Available Days Distribution
Booked Days Distribution
Booking Pattern Insights for Sainte-Rose-du-Nord
- The most common availability pattern in Sainte-Rose-du-Nord falls within the 271-366 days range, representing 46.2% of listings. This suggests many properties have significant open periods on their calendars.
- Approximately 65.4% of listings show high availability (181+ days open annually), indicating potential for increased bookings or specific owner usage patterns.
- For booked days, the 31-90 days range is most frequent in Sainte-Rose-du-Nord (42.3%), reflecting common guest stay durations or potential owner blocking patterns.
- A notable 34.6% of properties secure long booking periods (181+ days booked per year), highlighting successful long-term rental strategies or significant owner usage.
Sainte-Rose-du-Nord Airbnb Minimum Stay Requirements Analysis
Distribution of Listings by Minimum Night Requirement
1 Night
7 listings
28% of total
2 Nights
3 listings
12% of total
3 Nights
1 listings
4% of total
7-29 Nights
5 listings
20% of total
30+ Nights
9 listings
36% of total
Key Insights
- The most prevalent minimum stay requirement in Sainte-Rose-du-Nord is 30+ Nights, adopted by 36% of listings. This highlights the market's preference for longer commitments.
- A significant segment (36%) caters to monthly stays (30+ nights) in Sainte-Rose-du-Nord, pointing to opportunities in the extended-stay market.
Recommendations
- Align with the market by considering a 30+ Nights minimum stay, as 36% of Sainte-Rose-du-Nord hosts use this setting.
- If feasible, allowing 1-night stays, especially midweek or during low season, could capture last-minute bookings, as only 28% currently do.
- Explore offering discounts for stays of 30+ nights to attract the 36% of the market seeking extended stays.
- Adjust minimum nights based on seasonality – potentially shorter during low season and longer during peak demand periods in Sainte-Rose-du-Nord.
Sainte-Rose-du-Nord Airbnb Cancellation Policy Trends Analysis (2025)
Flexible
5 listings
19.2% of total
Moderate
2 listings
7.7% of total
Firm
11 listings
42.3% of total
Strict
8 listings
30.8% of total
Cancellation Policy Insights for Sainte-Rose-du-Nord
- The prevailing Airbnb cancellation policy trend in Sainte-Rose-du-Nord is Firm, used by 42.3% of listings.
- A majority (73.1%) of hosts in Sainte-Rose-du-Nord utilize Firm or Strict policies, indicating a market where hosts prioritize booking security.
Recommendations for Hosts
- Consider adopting a Firm policy to align with the 42.3% market standard in Sainte-Rose-du-Nord.
- With 30.8% using Strict terms, this is a viable option in Sainte-Rose-du-Nord, particularly for high-value properties or during peak demand periods.
- Regularly review your cancellation policy against competitors and market demand shifts in Sainte-Rose-du-Nord.
Sainte-Rose-du-Nord STR Booking Lead Time Analysis (2025)
Average Booking Lead Time by Month
Booking Lead Time Insights for Sainte-Rose-du-Nord
- The overall average booking lead time for vacation rentals in Sainte-Rose-du-Nord is 48 days.
- Guests book furthest in advance for stays during June (average 71 days), likely coinciding with peak travel demand or local events.
- The shortest booking windows occur for stays in January (average 36 days), indicating more last-minute travel plans during this time.
- Seasonally, Summer (61 days avg.) sees the longest lead times, while Winter (43 days avg.) has the shortest, reflecting typical travel planning cycles.
Recommendations for Hosts
- Use the overall average lead time (48 days) as a baseline for your pricing and availability strategy in Sainte-Rose-du-Nord.
- For June stays, consider implementing length-of-stay discounts or slightly higher rates for bookings made less than 71 days out to capitalize on advance planning.
- Target marketing efforts for the Summer season well in advance (at least 61 days) to capture early planners.
- Monitor your own booking lead times against these Sainte-Rose-du-Nord averages to identify opportunities for dynamic pricing adjustments.
Popular & Essential Airbnb Amenities in Sainte-Rose-du-Nord (2025)
Amenity Prevalence
Amenity Insights for Sainte-Rose-du-Nord
- Essential amenities in Sainte-Rose-du-Nord that guests expect include: Smoke alarm, Heating. Lacking these (any) could significantly impact bookings.
- Popular amenities like Essentials, Free parking on premises, Wifi are common but not universal. Offering these can provide a competitive edge.
- Warning: Wifi is not universally provided but is considered essential globally. Ensure reliable Wifi is offered.
Recommendations for Hosts
- Ensure your listing includes all essential amenities for Sainte-Rose-du-Nord: Smoke alarm, Heating.
- Consider adding popular differentiators like Essentials or Free parking on premises to increase appeal.
- Highlight unique or less common amenities you offer (e.g., hot tub, dedicated workspace, EV charger) in your listing description and photos.
- Regularly check competitor amenities in Sainte-Rose-du-Nord to stay competitive.
Sainte-Rose-du-Nord Airbnb Guest Demographics & Profile Analysis (2025)
Guest Profile Summary for Sainte-Rose-du-Nord
- The typical guest profile for Airbnb in Sainte-Rose-du-Nord consists of a mix of domestic (40%) and international guests, with top international origins including Canada, typically belonging to the Post-2000s (Gen Z/Alpha) group (50%), primarily speaking French or English.
- Domestic travelers account for 39.5% of guests.
- Key international markets include France (43.9%) and Canada (39.5%).
- Top languages spoken are French (43.3%) followed by English (40.3%).
- A significant demographic segment is the Post-2000s (Gen Z/Alpha) group, representing 50% of guests.
Recommendations for Hosts
- Focus marketing internationally, particularly towards travelers from Canada.
- Offer listing details and communication support in French.
- Tailor amenities and listing descriptions to appeal to the dominant Post-2000s (Gen Z/Alpha) demographic (e.g., highlight fast WiFi, smart home features, local guides).
- Highlight unique local experiences or amenities relevant to the primary guest profile.
- Consider seasonal promotions aligned with peak travel times for key origin markets.
Nearby Short-Term Rental Market Comparison
How does the Sainte-Rose-du-Nord Airbnb market stack up against its neighbors? Compare key performance metrics like average monthly revenue, ADR, and occupancy rates in surrounding areas to understand the broader regional STR landscape.
| Market | Active Properties | Monthly Revenue | Daily Rate | Avg. Occupancy |
|---|---|---|---|---|
| Les Éboulements | 137 | $3,141 | $227.50 | 42% |
| Saint-Irénée | 45 | $2,846 | $215.63 | 44% |
| Sainte-Brigitte-de-Laval | 59 | $2,652 | $185.69 | 49% |
| Petite-Rivière-Saint-François | 405 | $2,484 | $285.25 | 34% |
| Hébertville | 11 | $2,476 | $188.05 | 45% |
| Stoneham-et-Tewkesbury | 191 | $2,401 | $331.79 | 32% |
| Saint-Ferréol-les-Neiges | 172 | $2,234 | $257.49 | 35% |
| Saint-Joachim | 16 | $2,159 | $170.71 | 48% |
| Baie-Saint-Paul | 193 | $2,059 | $194.67 | 38% |
| Pohénégamook | 24 | $2,050 | $229.83 | 33% |