Saint-Raymond Airbnb Market Analysis 2025: Short Term Rental Data & Vacation Rental Statistics in Quebec, Canada
Is Airbnb profitable in Saint-Raymond in 2025? Explore comprehensive Airbnb analytics for Saint-Raymond, Quebec, Canada to uncover income potential. This 2025 STR market report for Saint-Raymond, based on AirROI data from April 2024 to March 2025, reveals key trends in the niche market of 81 active listings.
Whether you're considering an Airbnb investment in Saint-Raymond, optimizing your existing vacation rental, or exploring rental arbitrage opportunities, understanding the Saint-Raymond Airbnb data is crucial. Navigating the high regulation landscape is key to maximizing your short term rental income potential. Let's dive into the specifics.
Key Saint-Raymond Airbnb Performance Metrics Overview
Monthly Airbnb Revenue Variations & Income Potential in Saint-Raymond (2025)
Understanding the monthly revenue variations for Airbnb listings in Saint-Raymond is key to maximizing your short term rental income potential. Seasonality significantly impacts earnings. Our analysis, based on data from the past 12 months, shows that the peak revenue month for STRs in Saint-Raymond is typically August, while November often presents the lowest earnings, highlighting opportunities for strategic pricing adjustments during shoulder and low seasons. Explore the typical Airbnb income in Saint-Raymond across different performance tiers:
- Best-in-class properties (Top 10%) achieve $5,510+ monthly, often utilizing dynamic pricing and superior guest experiences.
- Strong performing properties (Top 25%) earn $3,849 or more, indicating effective management and desirable locations/amenities.
- Typical properties (Median) generate around $2,266 per month, representing the average market performance.
- Entry-level properties (Bottom 25%) see earnings around $1,025, often with potential for optimization.
Average Monthly Airbnb Earnings Trend in Saint-Raymond
Saint-Raymond Airbnb Occupancy Rate Trends (2025)
Maximize your bookings by understanding the Saint-Raymond STR occupancy trends. Seasonal demand shifts significantly influence how often properties are booked. Typically, Augustsees the highest demand (peak season occupancy), while April experiences the lowest (low season). Effective strategies, like adjusting minimum stays or offering promotions, can boost occupancy during slower periods. Here's how different property tiers perform in Saint-Raymond:
- Best-in-class properties (Top 10%) achieve 77%+ occupancy, indicating high desirability and potentially optimized availability.
- Strong performing properties (Top 25%) maintain 57% or higher occupancy, suggesting good market fit and guest satisfaction.
- Typical properties (Median) have an occupancy rate around 35%.
- Entry-level properties (Bottom 25%) average 18% occupancy, potentially facing higher vacancy.
Average Monthly Occupancy Rate Trend in Saint-Raymond
Average Daily Rate (ADR) Airbnb Trends in Saint-Raymond (2025)
Effective short term rental pricing strategy in Saint-Raymond involves understanding monthly ADR fluctuations. The Average Daily Rate (ADR) for Airbnb in Saint-Raymond typically peaks in July and dips lowest during November. Leveraging Airbnb dynamic pricing tools or strategies based on this seasonality can significantly boost revenue. Here's a look at the typical nightly rates achieved:
- Best-in-class properties (Top 10%) command rates of $339+ per night, often due to premium features or locations.
- Strong performing properties (Top 25%) achieve nightly rates of $244 or more.
- Typical properties (Median) charge around $175 per night.
- Entry-level properties (Bottom 25%) earn around $118 per night.
Average Daily Rate (ADR) Trend by Month in Saint-Raymond
Get Live Saint-Raymond Market Intelligence 👇

Explore Real-time Analytics
Airbnb Seasonality Analysis & Trends in Saint-Raymond (2025)
Peak Season (August, July, June)
- Revenue averages $3,585 per month
- Occupancy rates average 48.2%
- Daily rates average $210
Shoulder Season
- Revenue averages $2,683 per month
- Occupancy maintains around 36.5%
- Daily rates hold near $196
Low Season (September, October, November)
- Revenue drops to average $2,048 per month
- Occupancy decreases to average 36.0%
- Daily rates adjust to average $194
Seasonality Insights for Saint-Raymond
- The Airbnb seasonality in Saint-Raymond shows moderate seasonality with distinct peak and low periods. While the sections above show seasonal averages, it's also insightful to look at the extremes:
- During the high season, the absolute peak month showcases Saint-Raymond's highest earning potential, with monthly revenues capable of climbing to $3,751, occupancy reaching a high of 57.5%, and ADRs peaking at $213.
- Conversely, the slowest single month of the year, typically falling within the low season, marks the market's lowest point. In this month, revenue might dip to $1,953, occupancy could drop to 25.6%, and ADRs may adjust down to $186.
- Understanding both the seasonal averages and these monthly peaks and troughs in revenue, occupancy, and ADR is crucial for maximizing your Airbnb profit potential in Saint-Raymond.
Seasonal Strategies for Maximizing Profit
- Peak Season: Maximize revenue through premium pricing and potentially longer minimum stays. Ensure high availability.
- Low Season: Offer competitive pricing, special promotions (e.g., extended stay discounts), and flexible cancellation policies. Target off-season travelers like remote workers or budget-conscious guests.
- Shoulder Seasons: Implement dynamic pricing that balances peak and low rates. Target weekend travelers or specific events. Offer slightly more flexible terms than peak season.
- Regularly analyze your own performance against these Saint-Raymond seasonality benchmarks and adjust your pricing and availability strategy accordingly.
Best Areas for Airbnb Investment in Saint-Raymond (2025)
Exploring the top neighborhoods for short-term rentals in Saint-Raymond? This section highlights key areas, outlining why they are attractive for hosts and guests, along with notable local attractions. Consider these locations based on your target guest profile and investment strategy.
| Neighborhood / Area | Why Host Here? (Target Guests & Appeal) | Key Attractions & Landmarks |
|---|---|---|
| Saint-Raymond City Center | The heart of Saint-Raymond, filled with charming local shops, cafes, and cultural attractions. Ideal for visitors looking to experience local life and community events. | Saint-Raymond Church, Rivière Kennebec, local artisan shops, La Chute de la Petite Rivière |
| Lac des Écorces | A beautiful lake area offering a peaceful retreat with opportunities for fishing and boating. Attracts nature lovers and families seeking outdoor activities. | Lac des Écorces, fishing spots, hiking trails, picnic areas |
| Parc des Chutes-de-la-Chaudière | A stunning natural park featuring majestic waterfalls and scenic views. Popular for hiking and outdoor adventures, enticing nature enthusiasts and explorers. | Chutes de la Chaudière, hiking trails, picnic spots, landscaped gardens |
| Domaine des Cèdres | A quiet residential area with spacious properties and access to nature. Suitable for families and group retreats looking for tranquility. | natural landscapes, community parks, family-friendly ambiance |
| Montagne de la Croix | A scenic mountain area offering breathtaking views and outdoor activities year-round. Perfect for adventure seekers and outdoor lovers. | Montée de la Croix trail, panoramic viewpoints, skiing in winter, hiking in summer |
| Saint-Raymond Golf Club | An attractive location for golf enthusiasts, providing an opportunity for leisure and relaxation on the course, appealing to travelers looking to unwind. | golf courses, clubhouse, thriving golf community |
| Sentier de la Vallée du Chambord | A picturesque trail ideal for hiking and biking, attracting outdoor adventurers and fitness enthusiasts. | well-marked hiking paths, scenic views, wildlife observation |
| Local Festivals Venue | Host of various local events and festivals throughout the year. A great spot for those wanting to experience local culture and festivities. | Music festivals, food fairs, cultural celebrations |
Understanding Airbnb License Requirements & STR Laws in Saint-Raymond (2025)
Yes, Saint-Raymond, Quebec, Canada enforces high STR regulations. Obtaining a license and ensuring compliance is almost certainly required according to current 2025 STR laws. Always verify the latest short term rental regulations and Airbnb license requirements directly with local government authorities for Saint-Raymond to ensure full compliance before hosting.
(Source: AirROI data, 2025, based on 90% licensed listings)
Top Performing Airbnb Properties in Saint-Raymond (2025)
Benchmark your potential! Explore examples of top-performing Airbnb properties in Saint-Raymondbased on Trailing Twelve Month (TTM) revenue. Analyze their characteristics, revenue, occupancy rate, and ADR to understand what drives success in this market.
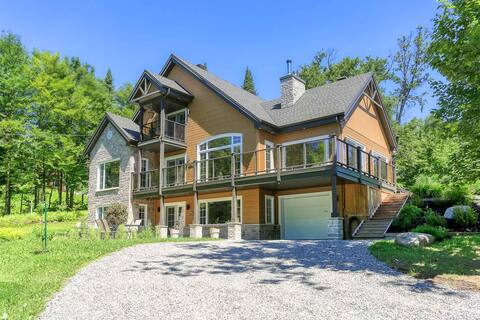
Chalet Le Corzo - Lake/Forest/Spa
Entire Place • 5 bedrooms
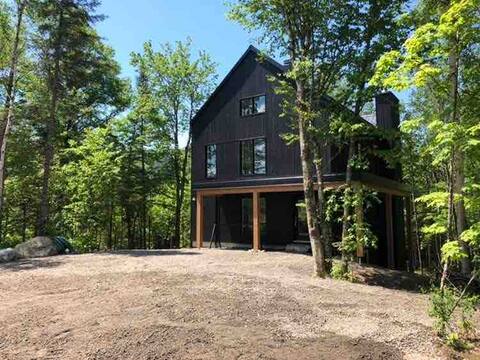
Domaine de la Passerelle - Bras Du Nord Valley
Entire Place • 4 bedrooms
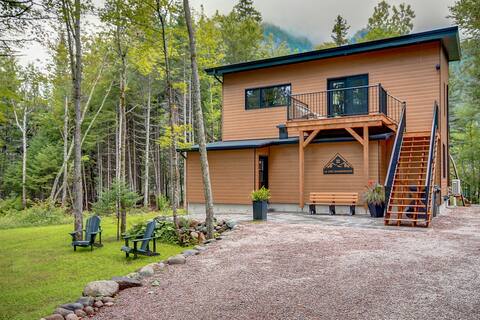
Luxurious Cottage in Nature | Modern | Spa
Entire Place • 3 bedrooms
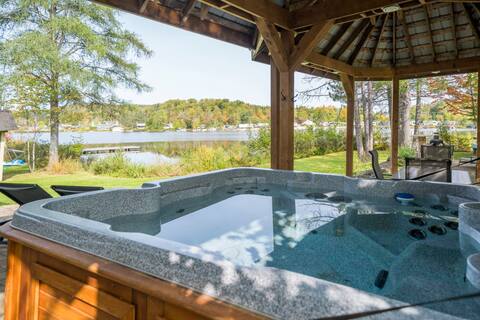
Waterfront ! with VIEW and SPA
Entire Place • 3 bedrooms

Chalet - 13 ft swimming spa, billiards, fireplaces, games
Entire Place • 3 bedrooms
Amazing view cottage on the lake
Entire Place • 3 bedrooms
Note: Performance varies based on location, size, amenities, seasonality, and management quality. Data reflects the past 12 months.
Top Performing Airbnb Hosts in Saint-Raymond (2025)
Learn from the best! This table showcases top-performing Airbnb hosts in Saint-Raymond based on the number of properties managed and estimated total revenue over the past year. Analyze their scale and performance metrics.
| Host Name | Properties | Grossing Revenue | Stay Reviews | Avg Rating |
|---|---|---|---|---|
| Les Chalets Tourisma | 8 | $221,814 | 191 | 4.85/5.0 |
| Domaine | 3 | $129,355 | 104 | 4.97/5.0 |
| Jacques | 1 | $119,269 | 40 | 4.93/5.0 |
| Mathieu | 2 | $87,257 | 216 | 4.96/5.0 |
| Dave | 3 | $84,903 | 58 | 4.90/5.0 |
| Alexis | 2 | $79,526 | 82 | 4.99/5.0 |
| Yannick | 1 | $66,470 | 37 | 4.92/5.0 |
| Rachel | 1 | $60,775 | 61 | 5.00/5.0 |
| Adam | 1 | $59,927 | 64 | 4.98/5.0 |
| Stéphane | 1 | $57,503 | 34 | 4.79/5.0 |
Analyzing the strategies of top hosts, such as their property selection, pricing, and guest communication, can offer valuable lessons for optimizing your own Airbnb operations in Saint-Raymond.
Dive Deeper: Advanced Saint-Raymond STR Market Data (2025)
Ready to unlock more insights? AirROI provides access to advanced metrics and comprehensive Airbnb data for Saint-Raymond. Explore detailed analytics beyond this report to refine your investment strategy, optimize pricing, and maximize your vacation rental profits.
Explore Advanced MetricsSaint-Raymond Short-Term Rental Market Composition (2025): Property & Room Types
Room Type Distribution
Property Type Distribution
Market Composition Insights for Saint-Raymond
- The Saint-Raymond Airbnb market composition is heavily skewed towards Entire Home/Apt listings, which make up 92.6% of the 81 active rentals. This indicates strong guest preference for privacy and space.
- Looking at the property type distribution in Saint-Raymond, House properties are the most common (86.4%), reflecting the local real estate landscape.
- Houses represent a significant 86.4% portion, catering likely to families or larger groups.
- Smaller segments like apartment/condo (combined 2.5%) offer potential for unique stay experiences.
Saint-Raymond Airbnb Room Capacity Analysis (2025): Bedroom Distribution
Distribution of Listings by Number of Bedrooms
Room Capacity Insights for Saint-Raymond
- The dominant room capacity in Saint-Raymond is 2 bedrooms listings, making up 34.6% of the market. This suggests a strong demand for properties suitable for couples or solo travelers.
- Together, 2 bedrooms and 3 bedrooms properties represent 69.2% of the active Airbnb listings in Saint-Raymond, indicating a high concentration in these sizes.
- A significant 50.6% of listings offer 3+ bedrooms, catering to larger groups and families seeking more space in Saint-Raymond.
Saint-Raymond Vacation Rental Guest Capacity Trends (2025)
Distribution of Listings by Guest Capacity
Guest Capacity Insights for Saint-Raymond
- The most common guest capacity trend in Saint-Raymond vacation rentals is listings accommodating 8+ guests (43.2%). This suggests the primary traveler segment is likely larger groups.
- Properties designed for 8+ guests and 6 guests dominate the Saint-Raymond STR market, accounting for 64.2% of listings.
- 67.9% of properties accommodate 6+ guests, serving the market segment for larger families or group travel in Saint-Raymond.
- On average, properties in Saint-Raymond are equipped to host 6.1 guests.
Saint-Raymond Airbnb Booking Patterns (2025): Available vs. Booked Days
Available Days Distribution
Booked Days Distribution
Booking Pattern Insights for Saint-Raymond
- The most common availability pattern in Saint-Raymond falls within the 181-270 days range, representing 40.7% of listings. This suggests many properties have significant open periods on their calendars.
- Approximately 74.0% of listings show high availability (181+ days open annually), indicating potential for increased bookings or specific owner usage patterns.
- For booked days, the 91-180 days range is most frequent in Saint-Raymond (42%), reflecting common guest stay durations or potential owner blocking patterns.
- A notable 27.2% of properties secure long booking periods (181+ days booked per year), highlighting successful long-term rental strategies or significant owner usage.
Saint-Raymond Airbnb Minimum Stay Requirements Analysis
Distribution of Listings by Minimum Night Requirement
1 Night
6 listings
7.8% of total
2 Nights
43 listings
55.8% of total
3 Nights
1 listings
1.3% of total
4-6 Nights
3 listings
3.9% of total
7-29 Nights
4 listings
5.2% of total
30+ Nights
20 listings
26% of total
Key Insights
- The most prevalent minimum stay requirement in Saint-Raymond is 2 Nights, adopted by 55.8% of listings. This highlights the market's preference for shorter, flexible bookings.
- A strong majority (63.6%) of the Saint-Raymond Airbnb data shows acceptance of very short stays (1-2 nights), indicating a dynamic, high-turnover market.
- A significant segment (26%) caters to monthly stays (30+ nights) in Saint-Raymond, pointing to opportunities in the extended-stay market.
Recommendations
- Align with the market by considering a 2 Nights minimum stay, as 55.8% of Saint-Raymond hosts use this setting.
- If feasible, allowing 1-night stays, especially midweek or during low season, could capture last-minute bookings, as only 7.8% currently do.
- A 2-night minimum appears standard (55.8%). Consider this for weekends or peak periods.
- Explore offering discounts for stays of 30+ nights to attract the 26% of the market seeking extended stays.
- Adjust minimum nights based on seasonality – potentially shorter during low season and longer during peak demand periods in Saint-Raymond.
Saint-Raymond Airbnb Cancellation Policy Trends Analysis (2025)
Non-refundable
2 listings
2.6% of total
Super Strict 30 Days
1 listings
1.3% of total
Flexible
11 listings
14.5% of total
Moderate
15 listings
19.7% of total
Firm
29 listings
38.2% of total
Strict
18 listings
23.7% of total
Cancellation Policy Insights for Saint-Raymond
- The prevailing Airbnb cancellation policy trend in Saint-Raymond is Firm, used by 38.2% of listings.
- A majority (61.9%) of hosts in Saint-Raymond utilize Firm or Strict policies, indicating a market where hosts prioritize booking security.
Recommendations for Hosts
- Consider adopting a Firm policy to align with the 38.2% market standard in Saint-Raymond.
- Regularly review your cancellation policy against competitors and market demand shifts in Saint-Raymond.
Saint-Raymond STR Booking Lead Time Analysis (2025)
Average Booking Lead Time by Month
Booking Lead Time Insights for Saint-Raymond
- The overall average booking lead time for vacation rentals in Saint-Raymond is 46 days.
- Guests book furthest in advance for stays during June (average 90 days), likely coinciding with peak travel demand or local events.
- The shortest booking windows occur for stays in November (average 30 days), indicating more last-minute travel plans during this time.
- Seasonally, Summer (85 days avg.) sees the longest lead times, while Fall (39 days avg.) has the shortest, reflecting typical travel planning cycles.
Recommendations for Hosts
- Use the overall average lead time (46 days) as a baseline for your pricing and availability strategy in Saint-Raymond.
- For June stays, consider implementing length-of-stay discounts or slightly higher rates for bookings made less than 90 days out to capitalize on advance planning.
- Target marketing efforts for the Summer season well in advance (at least 85 days) to capture early planners.
- Monitor your own booking lead times against these Saint-Raymond averages to identify opportunities for dynamic pricing adjustments.
Popular & Essential Airbnb Amenities in Saint-Raymond (2025)
Amenity Prevalence
Amenity Insights for Saint-Raymond
- Essential amenities in Saint-Raymond that guests expect include: Smoke alarm, Free parking on premises, Refrigerator, Heating, Kitchen, Coffee maker, Dishes and silverware, Wifi, Hot water. Lacking these (any) could significantly impact bookings.
- Popular amenities like Fire extinguisher are common but not universal. Offering these can provide a competitive edge.
Recommendations for Hosts
- Ensure your listing includes all essential amenities for Saint-Raymond: Smoke alarm, Free parking on premises, Refrigerator, Heating, Kitchen, Coffee maker, Dishes and silverware, Wifi, Hot water.
- Prioritize adding missing essentials: Refrigerator, Heating, Kitchen, Coffee maker, Dishes and silverware, Wifi, Hot water.
- Consider adding popular differentiators like Fire extinguisher to increase appeal.
- Highlight unique or less common amenities you offer (e.g., hot tub, dedicated workspace, EV charger) in your listing description and photos.
- Regularly check competitor amenities in Saint-Raymond to stay competitive.
Saint-Raymond Airbnb Guest Demographics & Profile Analysis (2025)
Guest Profile Summary for Saint-Raymond
- The typical guest profile for Airbnb in Saint-Raymond consists of primarily domestic travelers (83%), often arriving from nearby Montreal, typically belonging to the Post-2000s (Gen Z/Alpha) group (50%), primarily speaking French or English.
- Domestic travelers account for 82.6% of guests.
- Key international markets include Canada (82.6%) and United States (7%).
- Top languages spoken are French (44.5%) followed by English (42.6%).
- A significant demographic segment is the Post-2000s (Gen Z/Alpha) group, representing 50% of guests.
Recommendations for Hosts
- Target domestic marketing efforts towards travelers from Montreal and Québec City.
- Tailor amenities and listing descriptions to appeal to the dominant Post-2000s (Gen Z/Alpha) demographic (e.g., highlight fast WiFi, smart home features, local guides).
- Highlight unique local experiences or amenities relevant to the primary guest profile.
- Consider seasonal promotions aligned with peak travel times for key origin markets.
Nearby Short-Term Rental Market Comparison
How does the Saint-Raymond Airbnb market stack up against its neighbors? Compare key performance metrics like average monthly revenue, ADR, and occupancy rates in surrounding areas to understand the broader regional STR landscape.
| Market | Active Properties | Monthly Revenue | Daily Rate | Avg. Occupancy |
|---|---|---|---|---|
| Saint-Denis-de-Brompton | 28 | $4,459 | $383.13 | 34% |
| Waterloo | 11 | $4,092 | $357.06 | 37% |
| Shannon | 25 | $3,918 | $240.28 | 51% |
| Shefford | 26 | $3,538 | $254.63 | 43% |
| Lac-Beauport | 56 | $3,512 | $213.74 | 52% |
| Stanstead (Canton) | 40 | $3,462 | $234.29 | 46% |
| Saint-François-de-l'Île-d'Orléans | 12 | $3,291 | $336.24 | 39% |
| Saint-Basile | 12 | $3,221 | $180.24 | 52% |
| Les Éboulements | 137 | $3,141 | $227.50 | 42% |
| Saint-Roch-de-Mékinac | 11 | $3,108 | $314.58 | 41% |