Saint-Rémi-de-Tingwick Airbnb Market Analysis 2025: Short Term Rental Data & Vacation Rental Statistics in Quebec, Canada
Is Airbnb profitable in Saint-Rémi-de-Tingwick in 2025? Explore comprehensive Airbnb analytics for Saint-Rémi-de-Tingwick, Quebec, Canada to uncover income potential. This 2025 STR market report for Saint-Rémi-de-Tingwick, based on AirROI data from April 2024 to March 2025, reveals key trends in the niche market of 18 active listings.
Whether you're considering an Airbnb investment in Saint-Rémi-de-Tingwick, optimizing your existing vacation rental, or exploring rental arbitrage opportunities, understanding the Saint-Rémi-de-Tingwick Airbnb data is crucial. Navigating the high regulation landscape is key to maximizing your short term rental income potential. Let's dive into the specifics.
Key Saint-Rémi-de-Tingwick Airbnb Performance Metrics Overview
Monthly Airbnb Revenue Variations & Income Potential in Saint-Rémi-de-Tingwick (2025)
Understanding the monthly revenue variations for Airbnb listings in Saint-Rémi-de-Tingwick is key to maximizing your short term rental income potential. Seasonality significantly impacts earnings. Our analysis, based on data from the past 12 months, shows that the peak revenue month for STRs in Saint-Rémi-de-Tingwick is typically July, while February often presents the lowest earnings, highlighting opportunities for strategic pricing adjustments during shoulder and low seasons. Explore the typical Airbnb income in Saint-Rémi-de-Tingwick across different performance tiers:
- Best-in-class properties (Top 10%) achieve $4,884+ monthly, often utilizing dynamic pricing and superior guest experiences.
- Strong performing properties (Top 25%) earn $3,461 or more, indicating effective management and desirable locations/amenities.
- Typical properties (Median) generate around $2,197 per month, representing the average market performance.
- Entry-level properties (Bottom 25%) see earnings around $1,327, often with potential for optimization.
Average Monthly Airbnb Earnings Trend in Saint-Rémi-de-Tingwick
Saint-Rémi-de-Tingwick Airbnb Occupancy Rate Trends (2025)
Maximize your bookings by understanding the Saint-Rémi-de-Tingwick STR occupancy trends. Seasonal demand shifts significantly influence how often properties are booked. Typically, Julysees the highest demand (peak season occupancy), while June experiences the lowest (low season). Effective strategies, like adjusting minimum stays or offering promotions, can boost occupancy during slower periods. Here's how different property tiers perform in Saint-Rémi-de-Tingwick:
- Best-in-class properties (Top 10%) achieve 69%+ occupancy, indicating high desirability and potentially optimized availability.
- Strong performing properties (Top 25%) maintain 56% or higher occupancy, suggesting good market fit and guest satisfaction.
- Typical properties (Median) have an occupancy rate around 40%.
- Entry-level properties (Bottom 25%) average 25% occupancy, potentially facing higher vacancy.
Average Monthly Occupancy Rate Trend in Saint-Rémi-de-Tingwick
Average Daily Rate (ADR) Airbnb Trends in Saint-Rémi-de-Tingwick (2025)
Effective short term rental pricing strategy in Saint-Rémi-de-Tingwick involves understanding monthly ADR fluctuations. The Average Daily Rate (ADR) for Airbnb in Saint-Rémi-de-Tingwick typically peaks in August and dips lowest during February. Leveraging Airbnb dynamic pricing tools or strategies based on this seasonality can significantly boost revenue. Here's a look at the typical nightly rates achieved:
- Best-in-class properties (Top 10%) command rates of $350+ per night, often due to premium features or locations.
- Strong performing properties (Top 25%) achieve nightly rates of $271 or more.
- Typical properties (Median) charge around $161 per night.
- Entry-level properties (Bottom 25%) earn around $127 per night.
Average Daily Rate (ADR) Trend by Month in Saint-Rémi-de-Tingwick
Get Live Saint-Rémi-de-Tingwick Market Intelligence 👇

Explore Real-time Analytics
Airbnb Seasonality Analysis & Trends in Saint-Rémi-de-Tingwick (2025)
Peak Season (July, April, May)
- Revenue averages $3,586 per month
- Occupancy rates average 51.8%
- Daily rates average $220
Shoulder Season
- Revenue averages $2,505 per month
- Occupancy maintains around 40.4%
- Daily rates hold near $208
Low Season (January, February, November)
- Revenue drops to average $1,691 per month
- Occupancy decreases to average 35.0%
- Daily rates adjust to average $177
Seasonality Insights for Saint-Rémi-de-Tingwick
- The Airbnb seasonality in Saint-Rémi-de-Tingwick shows highly seasonal trends requiring careful strategy. While the sections above show seasonal averages, it's also insightful to look at the extremes:
- During the high season, the absolute peak month showcases Saint-Rémi-de-Tingwick's highest earning potential, with monthly revenues capable of climbing to $4,226, occupancy reaching a high of 67.3%, and ADRs peaking at $224.
- Conversely, the slowest single month of the year, typically falling within the low season, marks the market's lowest point. In this month, revenue might dip to $1,360, occupancy could drop to 20.5%, and ADRs may adjust down to $176.
- Understanding both the seasonal averages and these monthly peaks and troughs in revenue, occupancy, and ADR is crucial for maximizing your Airbnb profit potential in Saint-Rémi-de-Tingwick.
Seasonal Strategies for Maximizing Profit
- Peak Season: Maximize revenue through premium pricing and potentially longer minimum stays. Ensure high availability.
- Low Season: Offer competitive pricing, special promotions (e.g., extended stay discounts), and flexible cancellation policies. Target off-season travelers like remote workers or budget-conscious guests.
- Shoulder Seasons: Implement dynamic pricing that balances peak and low rates. Target weekend travelers or specific events. Offer slightly more flexible terms than peak season.
- Regularly analyze your own performance against these Saint-Rémi-de-Tingwick seasonality benchmarks and adjust your pricing and availability strategy accordingly.
Best Areas for Airbnb Investment in Saint-Rémi-de-Tingwick (2025)
Exploring the top neighborhoods for short-term rentals in Saint-Rémi-de-Tingwick? This section highlights key areas, outlining why they are attractive for hosts and guests, along with notable local attractions. Consider these locations based on your target guest profile and investment strategy.
| Neighborhood / Area | Why Host Here? (Target Guests & Appeal) | Key Attractions & Landmarks |
|---|---|---|
| Saint-Rémi-de-Tingwick Center | The heart of the town, offering easy access to local shops, restaurants, and community events. It's attractive to visitors who want to experience the local culture and amenities. | Local shops and cafes, Community events, Saint-Rémi-de-Tingwick Library, Nearby parks |
| Lac Saint-Rémi | A serene lake area ideal for nature lovers and families. Perfect for those seeking relaxation and outdoor activities like fishing and boating. | Fishing opportunities, Boating activities, Picnic areas, Scenic views, Nature trails |
| Montée Saint-Rémi | A picturesque area with charming rural landscapes, popular among guests looking for a peaceful retreat away from the city hustle. | Beautiful countryside views, Walking and biking trails, Local farms, Nature observation |
| Saint-Rémi-de-Tingwick Historical Site | This area features rich history and culture, appealing to those interested in heritage and local history. | Historical landmarks, Cultural heritage sites, Museums, Guided tours, Local history exhibits |
| Parc des Champs-de-Golf | This golf course area is attractive for sports enthusiasts and those looking to enjoy recreational activities amidst nature. | Golf course, Scenic walking paths, Relaxation areas, Nature views |
| Local Wine Trails | Saint-Rémi-de-Tingwick is close to several vineyards and wineries, attracting wine lovers and tourists looking for tasting experiences. | Vineyard tours, Wine tastings, Scenic vineyard views, Local gastronomy |
| Winter Sports Area | In winter, this area becomes popular for snow sports, attracting visitors looking for skiing, snowboarding, and winter activities. | Skiing and snowboarding, Snowshoeing, Winter festivals, Access to winter trails |
| Cultural Festival Grounds | Known for hosting local festivals and cultural events, this area draws visitors looking for vibrant local experiences and entertainment. | Annual cultural festivals, Concerts and events, Food and craft fairs, Community gatherings |
Understanding Airbnb License Requirements & STR Laws in Saint-Rémi-de-Tingwick (2025)
Yes, Saint-Rémi-de-Tingwick, Quebec, Canada enforces high STR regulations. Obtaining a license and ensuring compliance is almost certainly required according to current 2025 STR laws. Always verify the latest short term rental regulations and Airbnb license requirements directly with local government authorities for Saint-Rémi-de-Tingwick to ensure full compliance before hosting.
(Source: AirROI data, 2025, based on 72% licensed listings)
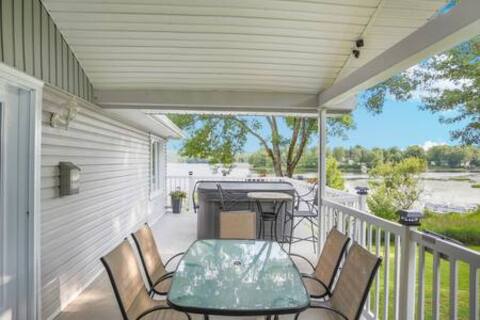
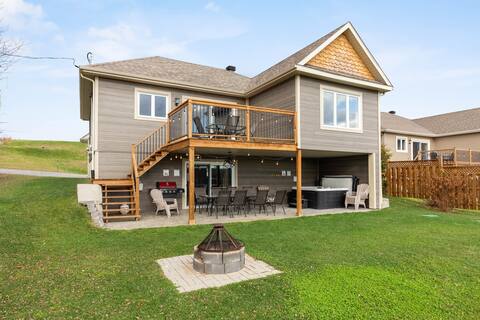
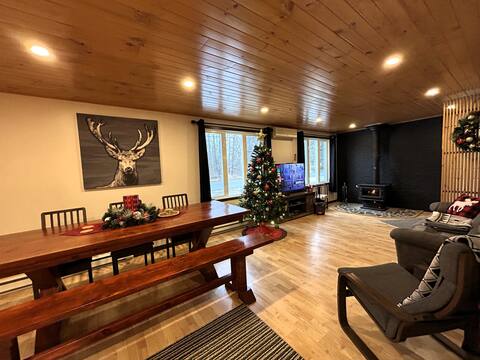
Top Performing Airbnb Properties in Saint-Rémi-de-Tingwick (2025)
Benchmark your potential! Explore examples of top-performing Airbnb properties in Saint-Rémi-de-Tingwickbased on Trailing Twelve Month (TTM) revenue. Analyze their characteristics, revenue, occupancy rate, and ADR to understand what drives success in this market.
Shack des Lacs | spa | absolute relaxation
Entire Place • 5 bedrooms

Chalet BIA - Cap au Sud
Entire Place • 3 bedrooms
Le Natura
Entire Place • 5 bedrooms
Ô Ruisseau with Hot Tub - Arcade and Fireplace
Entire Place • 3 bedrooms

Peaceful chalet located on the banks of the Trois-Lacs
Entire Place • 3 bedrooms
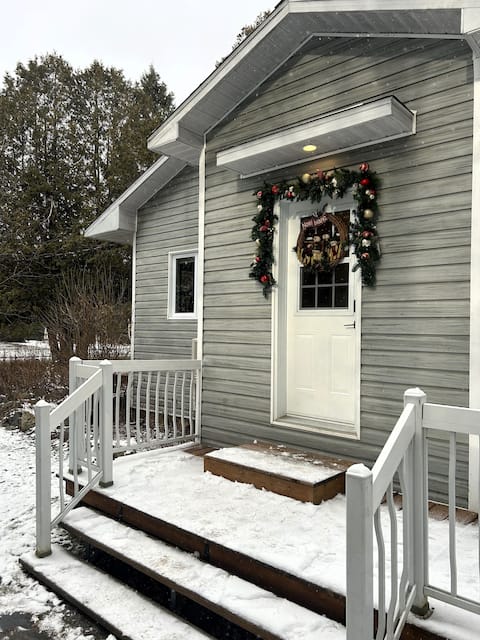
Chalet du Ruisseau with spa
Entire Place • 2 bedrooms
Note: Performance varies based on location, size, amenities, seasonality, and management quality. Data reflects the past 12 months.
Top Performing Airbnb Hosts in Saint-Rémi-de-Tingwick (2025)
Learn from the best! This table showcases top-performing Airbnb hosts in Saint-Rémi-de-Tingwick based on the number of properties managed and estimated total revenue over the past year. Analyze their scale and performance metrics.
| Host Name | Properties | Grossing Revenue | Stay Reviews | Avg Rating |
|---|---|---|---|---|
| Host #488111335 | 4 | $83,201 | 0 | 0.00/5.0 |
| Sébastien | 2 | $63,058 | 45 | 4.91/5.0 |
| Yann-Si | 1 | $51,194 | 26 | 4.88/5.0 |
| Maryse | 3 | $49,826 | 90 | 4.83/5.0 |
| Bianca | 1 | $44,304 | 89 | 4.92/5.0 |
| Pierre | 2 | $44,241 | 124 | 4.80/5.0 |
| Katyanne | 1 | $31,123 | 12 | 5.00/5.0 |
| Cynthia | 1 | $16,861 | 78 | 4.95/5.0 |
| Esther | 1 | $11,801 | 76 | 4.93/5.0 |
| Julie | 1 | $11,693 | 37 | 4.84/5.0 |
Analyzing the strategies of top hosts, such as their property selection, pricing, and guest communication, can offer valuable lessons for optimizing your own Airbnb operations in Saint-Rémi-de-Tingwick.
Dive Deeper: Advanced Saint-Rémi-de-Tingwick STR Market Data (2025)
Ready to unlock more insights? AirROI provides access to advanced metrics and comprehensive Airbnb data for Saint-Rémi-de-Tingwick. Explore detailed analytics beyond this report to refine your investment strategy, optimize pricing, and maximize your vacation rental profits.
Explore Advanced MetricsSaint-Rémi-de-Tingwick Short-Term Rental Market Composition (2025): Property & Room Types
Room Type Distribution
Property Type Distribution
Market Composition Insights for Saint-Rémi-de-Tingwick
- The Saint-Rémi-de-Tingwick Airbnb market composition is heavily skewed towards Entire Home/Apt listings, which make up 100% of the 18 active rentals. This indicates strong guest preference for privacy and space.
- Looking at the property type distribution in Saint-Rémi-de-Tingwick, House properties are the most common (100%), reflecting the local real estate landscape.
- Houses represent a significant 100% portion, catering likely to families or larger groups.
Saint-Rémi-de-Tingwick Airbnb Room Capacity Analysis (2025): Bedroom Distribution
Distribution of Listings by Number of Bedrooms
Room Capacity Insights for Saint-Rémi-de-Tingwick
- The dominant room capacity in Saint-Rémi-de-Tingwick is 2 bedrooms listings, making up 44.4% of the market. This suggests a strong demand for properties suitable for couples or solo travelers.
- Together, 2 bedrooms and 3 bedrooms properties represent 66.6% of the active Airbnb listings in Saint-Rémi-de-Tingwick, indicating a high concentration in these sizes.
- A significant 44.4% of listings offer 3+ bedrooms, catering to larger groups and families seeking more space in Saint-Rémi-de-Tingwick.
Saint-Rémi-de-Tingwick Vacation Rental Guest Capacity Trends (2025)
Distribution of Listings by Guest Capacity
Guest Capacity Insights for Saint-Rémi-de-Tingwick
- The most common guest capacity trend in Saint-Rémi-de-Tingwick vacation rentals is listings accommodating 8+ guests (55.6%). This suggests the primary traveler segment is likely larger groups.
- Properties designed for 8+ guests and 6 guests dominate the Saint-Rémi-de-Tingwick STR market, accounting for 88.9% of listings.
- 88.9% of properties accommodate 6+ guests, serving the market segment for larger families or group travel in Saint-Rémi-de-Tingwick.
- On average, properties in Saint-Rémi-de-Tingwick are equipped to host 6.9 guests.
Saint-Rémi-de-Tingwick Airbnb Booking Patterns (2025): Available vs. Booked Days
Available Days Distribution
Booked Days Distribution
Booking Pattern Insights for Saint-Rémi-de-Tingwick
- The most common availability pattern in Saint-Rémi-de-Tingwick falls within the 271-366 days range, representing 44.4% of listings. This suggests many properties have significant open periods on their calendars.
- Approximately 66.6% of listings show high availability (181+ days open annually), indicating potential for increased bookings or specific owner usage patterns.
- For booked days, the 31-90 days range is most frequent in Saint-Rémi-de-Tingwick (33.3%), reflecting common guest stay durations or potential owner blocking patterns.
- A notable 33.4% of properties secure long booking periods (181+ days booked per year), highlighting successful long-term rental strategies or significant owner usage.
Saint-Rémi-de-Tingwick Airbnb Minimum Stay Requirements Analysis
Distribution of Listings by Minimum Night Requirement
2 Nights
14 listings
77.8% of total
4-6 Nights
1 listings
5.6% of total
30+ Nights
3 listings
16.7% of total
Key Insights
- The most prevalent minimum stay requirement in Saint-Rémi-de-Tingwick is 2 Nights, adopted by 77.8% of listings. This highlights the market's preference for shorter, flexible bookings.
- A strong majority (77.8%) of the Saint-Rémi-de-Tingwick Airbnb data shows acceptance of very short stays (1-2 nights), indicating a dynamic, high-turnover market.
- A significant segment (16.7%) caters to monthly stays (30+ nights) in Saint-Rémi-de-Tingwick, pointing to opportunities in the extended-stay market.
Recommendations
- Align with the market by considering a 2 Nights minimum stay, as 77.8% of Saint-Rémi-de-Tingwick hosts use this setting.
- A 2-night minimum appears standard (77.8%). Consider this for weekends or peak periods.
- Explore offering discounts for stays of 30+ nights to attract the 16.7% of the market seeking extended stays.
- Adjust minimum nights based on seasonality – potentially shorter during low season and longer during peak demand periods in Saint-Rémi-de-Tingwick.
Saint-Rémi-de-Tingwick Airbnb Cancellation Policy Trends Analysis (2025)
Moderate
5 listings
38.5% of total
Firm
2 listings
15.4% of total
Strict
6 listings
46.2% of total
Cancellation Policy Insights for Saint-Rémi-de-Tingwick
- The prevailing Airbnb cancellation policy trend in Saint-Rémi-de-Tingwick is Strict, used by 46.2% of listings.
- A majority (61.6%) of hosts in Saint-Rémi-de-Tingwick utilize Firm or Strict policies, indicating a market where hosts prioritize booking security.
Recommendations for Hosts
- Consider adopting a Strict policy to align with the 46.2% market standard in Saint-Rémi-de-Tingwick.
- With 46.2% using Strict terms, this is a viable option in Saint-Rémi-de-Tingwick, particularly for high-value properties or during peak demand periods.
- Regularly review your cancellation policy against competitors and market demand shifts in Saint-Rémi-de-Tingwick.
Saint-Rémi-de-Tingwick STR Booking Lead Time Analysis (2025)
Average Booking Lead Time by Month
Booking Lead Time Insights for Saint-Rémi-de-Tingwick
- The overall average booking lead time for vacation rentals in Saint-Rémi-de-Tingwick is 40 days.
- Guests book furthest in advance for stays during July (average 75 days), likely coinciding with peak travel demand or local events.
- The shortest booking windows occur for stays in May (average 7 days), indicating more last-minute travel plans during this time.
- Seasonally, Summer (59 days avg.) sees the longest lead times, while Spring (18 days avg.) has the shortest, reflecting typical travel planning cycles.
Recommendations for Hosts
- Use the overall average lead time (40 days) as a baseline for your pricing and availability strategy in Saint-Rémi-de-Tingwick.
- For July stays, consider implementing length-of-stay discounts or slightly higher rates for bookings made less than 75 days out to capitalize on advance planning.
- During May, focus on last-minute booking availability and promotions, as guests book with very short notice (7 days avg.).
- Target marketing efforts for the Summer season well in advance (at least 59 days) to capture early planners.
- Monitor your own booking lead times against these Saint-Rémi-de-Tingwick averages to identify opportunities for dynamic pricing adjustments.
Popular & Essential Airbnb Amenities in Saint-Rémi-de-Tingwick (2025)
Amenity Prevalence
Amenity Insights for Saint-Rémi-de-Tingwick
- Essential amenities in Saint-Rémi-de-Tingwick that guests expect include: Cooking basics, TV, Essentials, Heating, Smoke alarm, Kitchen, Wifi. Lacking these (any) could significantly impact bookings.
- Popular amenities like Hot water, Oven, Free parking on premises are common but not universal. Offering these can provide a competitive edge.
Recommendations for Hosts
- Ensure your listing includes all essential amenities for Saint-Rémi-de-Tingwick: Cooking basics, TV, Essentials, Heating, Smoke alarm, Kitchen, Wifi.
- Consider adding popular differentiators like Hot water or Oven to increase appeal.
- Highlight unique or less common amenities you offer (e.g., hot tub, dedicated workspace, EV charger) in your listing description and photos.
- Regularly check competitor amenities in Saint-Rémi-de-Tingwick to stay competitive.
Saint-Rémi-de-Tingwick Airbnb Guest Demographics & Profile Analysis (2025)
Guest Profile Summary for Saint-Rémi-de-Tingwick
- The typical guest profile for Airbnb in Saint-Rémi-de-Tingwick consists of primarily domestic travelers (93%), often arriving from nearby Montreal, typically belonging to the Post-2000s (Gen Z/Alpha) group (50%), primarily speaking French or English.
- Domestic travelers account for 93.2% of guests.
- Key international markets include Canada (93.2%) and United States (3%).
- Top languages spoken are French (50.4%) followed by English (38.5%).
- A significant demographic segment is the Post-2000s (Gen Z/Alpha) group, representing 50% of guests.
Recommendations for Hosts
- Target domestic marketing efforts towards travelers from Montreal and Québec City.
- Tailor amenities and listing descriptions to appeal to the dominant Post-2000s (Gen Z/Alpha) demographic (e.g., highlight fast WiFi, smart home features, local guides).
- Highlight unique local experiences or amenities relevant to the primary guest profile.
- Consider seasonal promotions aligned with peak travel times for key origin markets.
Nearby Short-Term Rental Market Comparison
How does the Saint-Rémi-de-Tingwick Airbnb market stack up against its neighbors? Compare key performance metrics like average monthly revenue, ADR, and occupancy rates in surrounding areas to understand the broader regional STR landscape.
| Market | Active Properties | Monthly Revenue | Daily Rate | Avg. Occupancy |
|---|---|---|---|---|
| Jefferson | 28 | $5,920 | $432.83 | 50% |
| Stowe | 842 | $4,757 | $474.92 | 41% |
| Otisfield | 11 | $4,471 | $391.16 | 43% |
| Saint-Denis-de-Brompton | 28 | $4,459 | $383.13 | 34% |
| Dalton | 13 | $4,397 | $359.89 | 45% |
| Calais | 16 | $4,320 | $299.79 | 49% |
| Woodstock | 45 | $4,116 | $385.01 | 44% |
| Waterloo | 11 | $4,092 | $357.06 | 37% |
| Topsham | 13 | $3,952 | $265.51 | 50% |
| Jericho | 23 | $3,945 | $309.71 | 54% |