Saint-Philémon Airbnb Market Analysis 2025: Short Term Rental Data & Vacation Rental Statistics in Quebec, Canada
Is Airbnb profitable in Saint-Philémon in 2025? Explore comprehensive Airbnb analytics for Saint-Philémon, Quebec, Canada to uncover income potential. This 2025 STR market report for Saint-Philémon, based on AirROI data from April 2024 to March 2025, reveals key trends in the niche market of 42 active listings.
Whether you're considering an Airbnb investment in Saint-Philémon, optimizing your existing vacation rental, or exploring rental arbitrage opportunities, understanding the Saint-Philémon Airbnb data is crucial. Navigating the high regulation landscape is key to maximizing your short term rental income potential. Let's dive into the specifics.
Key Saint-Philémon Airbnb Performance Metrics Overview
Monthly Airbnb Revenue Variations & Income Potential in Saint-Philémon (2025)
Understanding the monthly revenue variations for Airbnb listings in Saint-Philémon is key to maximizing your short term rental income potential. Seasonality significantly impacts earnings. Our analysis, based on data from the past 12 months, shows that the peak revenue month for STRs in Saint-Phil�émon is typically December, while September often presents the lowest earnings, highlighting opportunities for strategic pricing adjustments during shoulder and low seasons. Explore the typical Airbnb income in Saint-Philémon across different performance tiers:
- Best-in-class properties (Top 10%) achieve $6,713+ monthly, often utilizing dynamic pricing and superior guest experiences.
- Strong performing properties (Top 25%) earn $4,722 or more, indicating effective management and desirable locations/amenities.
- Typical properties (Median) generate around $2,873 per month, representing the average market performance.
- Entry-level properties (Bottom 25%) see earnings around $1,377, often with potential for optimization.
Average Monthly Airbnb Earnings Trend in Saint-Philémon
Saint-Philémon Airbnb Occupancy Rate Trends (2025)
Maximize your bookings by understanding the Saint-Philémon STR occupancy trends. Seasonal demand shifts significantly influence how often properties are booked. Typically, Februarysees the highest demand (peak season occupancy), while April experiences the lowest (low season). Effective strategies, like adjusting minimum stays or offering promotions, can boost occupancy during slower periods. Here's how different property tiers perform in Saint-Philémon:
- Best-in-class properties (Top 10%) achieve 67%+ occupancy, indicating high desirability and potentially optimized availability.
- Strong performing properties (Top 25%) maintain 51% or higher occupancy, suggesting good market fit and guest satisfaction.
- Typical properties (Median) have an occupancy rate around 33%.
- Entry-level properties (Bottom 25%) average 21% occupancy, potentially facing higher vacancy.
Average Monthly Occupancy Rate Trend in Saint-Philémon
Average Daily Rate (ADR) Airbnb Trends in Saint-Philémon (2025)
Effective short term rental pricing strategy in Saint-Philémon involves understanding monthly ADR fluctuations. The Average Daily Rate (ADR) for Airbnb in Saint-Philémon typically peaks in December and dips lowest during November. Leveraging Airbnb dynamic pricing tools or strategies based on this seasonality can significantly boost revenue. Here's a look at the typical nightly rates achieved:
- Best-in-class properties (Top 10%) command rates of $387+ per night, often due to premium features or locations.
- Strong performing properties (Top 25%) achieve nightly rates of $327 or more.
- Typical properties (Median) charge around $255 per night.
- Entry-level properties (Bottom 25%) earn around $166 per night.
Average Daily Rate (ADR) Trend by Month in Saint-Philémon
Get Live Saint-Philémon Market Intelligence 👇

Explore Real-time Analytics
Airbnb Seasonality Analysis & Trends in Saint-Philémon (2025)
Peak Season (December, January, March)
- Revenue averages $4,072 per month
- Occupancy rates average 43.8%
- Daily rates average $275
Shoulder Season
- Revenue averages $3,374 per month
- Occupancy maintains around 35.9%
- Daily rates hold near $254
Low Season (September, October, November)
- Revenue drops to average $2,300 per month
- Occupancy decreases to average 31.3%
- Daily rates adjust to average $236
Seasonality Insights for Saint-Philémon
- The Airbnb seasonality in Saint-Philémon shows moderate seasonality with distinct peak and low periods. While the sections above show seasonal averages, it's also insightful to look at the extremes:
- During the high season, the absolute peak month showcases Saint-Philémon's highest earning potential, with monthly revenues capable of climbing to $4,215, occupancy reaching a high of 47.7%, and ADRs peaking at $282.
- Conversely, the slowest single month of the year, typically falling within the low season, marks the market's lowest point. In this month, revenue might dip to $2,053, occupancy could drop to 23.7%, and ADRs may adjust down to $230.
- Understanding both the seasonal averages and these monthly peaks and troughs in revenue, occupancy, and ADR is crucial for maximizing your Airbnb profit potential in Saint-Philémon.
Seasonal Strategies for Maximizing Profit
- Peak Season: Maximize revenue through premium pricing and potentially longer minimum stays. Ensure high availability.
- Low Season: Offer competitive pricing, special promotions (e.g., extended stay discounts), and flexible cancellation policies. Target off-season travelers like remote workers or budget-conscious guests.
- Shoulder Seasons: Implement dynamic pricing that balances peak and low rates. Target weekend travelers or specific events. Offer slightly more flexible terms than peak season.
- Regularly analyze your own performance against these Saint-Philémon seasonality benchmarks and adjust your pricing and availability strategy accordingly.
Best Areas for Airbnb Investment in Saint-Philémon (2025)
Exploring the top neighborhoods for short-term rentals in Saint-Philémon? This section highlights key areas, outlining why they are attractive for hosts and guests, along with notable local attractions. Consider these locations based on your target guest profile and investment strategy.
| Neighborhood / Area | Why Host Here? (Target Guests & Appeal) | Key Attractions & Landmarks |
|---|---|---|
| Saint-Philémon Village | A charming village setting known for its serene countryside, rich history, and friendly community. Ideal for guests looking to escape to nature and experience rural Quebec. | Saint-Philémon Church, local farmer's markets, hiking trails in the region, cultural festivals, artisans’ workshops |
| Parc national de Frontenac | A stunning natural park featuring lakes, forests, and outdoor activities. Perfect for nature lovers and adventure seekers looking for hiking, canoeing, and wildlife watching. | Lac Saint-François, hiking trails, camping sites, bird watching, wildlife observation |
| Themed Cabins and Chalets | Unique accommodations that offer themed stays, such as cozy cabins or luxurious chalets. Appeals to couples and families looking for memorable experiences in nature. | Themed accommodations, fire pits, scenic views, proximity to nature trails, peaceful surroundings |
| Cultural Heritage Sites | Focus on local history and heritage, providing guests with educational experiences. Ideal for tourists interested in learning about Quebec's rich past. | Musee de l'Agriculture, historical landmarks, local artisans, guided historical tours, cultural events |
| Winter Sports Resorts | A popular destination for winter sports enthusiasts, offering skiing and snowboarding experiences in the nearby areas during winter season. | Ski resorts, snowshoeing trails, snowmobiling, winter festivals, local après-ski activities |
| Local Gastronomy | Highlighting the culinary scene of the area, offering unique dining experiences and food tours. Great for foodies and those wanting to taste regional specialties. | local bistros, cheese producers, microbreweries, farm-to-table dining, food festivals |
| Scenic Views | Properties that offer breathtaking views of the surrounding landscape appeal to those looking for relaxation and picturesque settings. | panoramic viewpoints, sunset watching, photography spots, nearby lakes, walking trails |
| Eco-tourism Activities | Focused on sustainability and eco-friendly travel options, attracting environmentally-conscious travelers looking for eco-friendly accommodations and experiences. | eco-lodges, sustainable tours, nature workshops, wildlife preservation projects, organic farms |
Understanding Airbnb License Requirements & STR Laws in Saint-Philémon (2025)
Yes, Saint-Philémon, Quebec, Canada enforces high STR regulations. Obtaining a license and ensuring compliance is almost certainly required according to current 2025 STR laws. Always verify the latest short term rental regulations and Airbnb license requirements directly with local government authorities for Saint-Philémon to ensure full compliance before hosting.
(Source: AirROI data, 2025, based on 93% licensed listings)
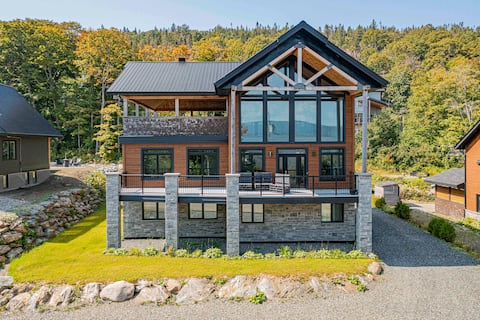
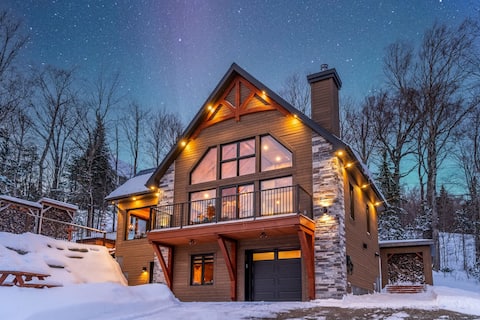
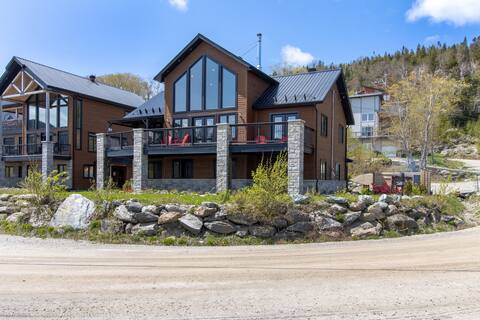
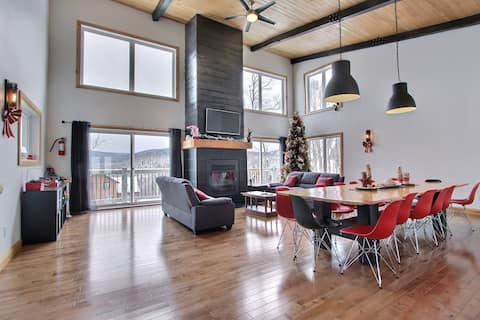
Top Performing Airbnb Properties in Saint-Philémon (2025)
Benchmark your potential! Explore examples of top-performing Airbnb properties in Saint-Philémonbased on Trailing Twelve Month (TTM) revenue. Analyze their characteristics, revenue, occupancy rate, and ADR to understand what drives success in this market.
L Elegance
Entire Place • 6 bedrooms
Promontoire-29 | Mountain chalet with a hot tub|
Entire Place • 4 bedrooms
Chalet Bellevue 1 du Massif du Sud
Entire Place • 4 bedrooms

Villa Mont Chocolat
Entire Place • 4 bedrooms
L 'scension chalet, Chaudières-Appalaches
Entire Place • 5 bedrooms
Le Billot
Entire Place • 5 bedrooms
Note: Performance varies based on location, size, amenities, seasonality, and management quality. Data reflects the past 12 months.
Top Performing Airbnb Hosts in Saint-Philémon (2025)
Learn from the best! This table showcases top-performing Airbnb hosts in Saint-Philémon based on the number of properties managed and estimated total revenue over the past year. Analyze their scale and performance metrics.
| Host Name | Properties | Grossing Revenue | Stay Reviews | Avg Rating |
|---|---|---|---|---|
| Chaletô | 7 | $286,967 | 149 | 4.89/5.0 |
| Sylvain Roch | 4 | $200,491 | 280 | 4.91/5.0 |
| ChaletsConfort | 9 | $196,878 | 121 | 4.17/5.0 |
| Louis | 2 | $90,543 | 206 | 4.89/5.0 |
| Patrick | 1 | $62,441 | 17 | 5.00/5.0 |
| David | 1 | $62,193 | 25 | 4.72/5.0 |
| Khloé | 1 | $52,430 | 14 | 4.79/5.0 |
| Dominique | 1 | $47,752 | 9 | 5.00/5.0 |
| Chalets | 1 | $46,454 | 81 | 4.57/5.0 |
| Julie | 1 | $45,805 | 72 | 4.93/5.0 |
Analyzing the strategies of top hosts, such as their property selection, pricing, and guest communication, can offer valuable lessons for optimizing your own Airbnb operations in Saint-Philémon.
Dive Deeper: Advanced Saint-Philémon STR Market Data (2025)
Ready to unlock more insights? AirROI provides access to advanced metrics and comprehensive Airbnb data for Saint-Philémon. Explore detailed analytics beyond this report to refine your investment strategy, optimize pricing, and maximize your vacation rental profits.
Explore Advanced MetricsSaint-Philémon Short-Term Rental Market Composition (2025): Property & Room Types
Room Type Distribution
Property Type Distribution
Market Composition Insights for Saint-Philémon
- The Saint-Philémon Airbnb market composition is heavily skewed towards Entire Home/Apt listings, which make up 100% of the 42 active rentals. This indicates strong guest preference for privacy and space.
- Looking at the property type distribution in Saint-Philémon, House properties are the most common (78.6%), reflecting the local real estate landscape.
- Houses represent a significant 78.6% portion, catering likely to families or larger groups.
- Smaller segments like hotel/boutique (combined 2.4%) offer potential for unique stay experiences.
Saint-Philémon Airbnb Room Capacity Analysis (2025): Bedroom Distribution
Distribution of Listings by Number of Bedrooms
Room Capacity Insights for Saint-Philémon
- The dominant room capacity in Saint-Philémon is 4 bedrooms listings, making up 33.3% of the market. This suggests a strong demand for properties suitable for families or small groups.
- Together, 4 bedrooms and 5+ bedrooms properties represent 66.6% of the active Airbnb listings in Saint-Philémon, indicating a high concentration in these sizes.
- A significant 80.9% of listings offer 3+ bedrooms, catering to larger groups and families seeking more space in Saint-Philémon.
Saint-Philémon Vacation Rental Guest Capacity Trends (2025)
Distribution of Listings by Guest Capacity
Guest Capacity Insights for Saint-Philémon
- The most common guest capacity trend in Saint-Philémon vacation rentals is listings accommodating 8+ guests (83.3%). This suggests the primary traveler segment is likely larger groups.
- Properties designed for 8+ guests and 4 guests dominate the Saint-Philémon STR market, accounting for 90.4% of listings.
- 92.8% of properties accommodate 6+ guests, serving the market segment for larger families or group travel in Saint-Philémon.
- On average, properties in Saint-Philémon are equipped to host 7.5 guests.
Saint-Philémon Airbnb Booking Patterns (2025): Available vs. Booked Days
Available Days Distribution
Booked Days Distribution
Booking Pattern Insights for Saint-Philémon
- The most common availability pattern in Saint-Philémon falls within the 181-270 days range, representing 40.5% of listings. This suggests many properties have significant open periods on their calendars.
- Approximately 73.8% of listings show high availability (181+ days open annually), indicating potential for increased bookings or specific owner usage patterns.
- For booked days, the 91-180 days range is most frequent in Saint-Philémon (40.5%), reflecting common guest stay durations or potential owner blocking patterns.
- A notable 26.2% of properties secure long booking periods (181+ days booked per year), highlighting successful long-term rental strategies or significant owner usage.
Saint-Philémon Airbnb Minimum Stay Requirements Analysis
Distribution of Listings by Minimum Night Requirement
1 Night
2 listings
4.9% of total
2 Nights
20 listings
48.8% of total
3 Nights
1 listings
2.4% of total
4-6 Nights
1 listings
2.4% of total
7-29 Nights
1 listings
2.4% of total
30+ Nights
16 listings
39% of total
Key Insights
- The most prevalent minimum stay requirement in Saint-Philémon is 2 Nights, adopted by 48.8% of listings. This highlights the market's preference for shorter, flexible bookings.
- A significant segment (39%) caters to monthly stays (30+ nights) in Saint-Philémon, pointing to opportunities in the extended-stay market.
Recommendations
- Align with the market by considering a 2 Nights minimum stay, as 48.8% of Saint-Philémon hosts use this setting.
- If feasible, allowing 1-night stays, especially midweek or during low season, could capture last-minute bookings, as only 4.9% currently do.
- A 2-night minimum appears standard (48.8%). Consider this for weekends or peak periods.
- Explore offering discounts for stays of 30+ nights to attract the 39% of the market seeking extended stays.
- Adjust minimum nights based on seasonality – potentially shorter during low season and longer during peak demand periods in Saint-Philémon.
Saint-Philémon Airbnb Cancellation Policy Trends Analysis (2025)
Super Strict 30 Days
15 listings
37.5% of total
Moderate
4 listings
10% of total
Firm
7 listings
17.5% of total
Strict
14 listings
35% of total
Cancellation Policy Insights for Saint-Philémon
- The prevailing Airbnb cancellation policy trend in Saint-Philémon is Super Strict 30 Days, used by 37.5% of listings.
- A majority (52.5%) of hosts in Saint-Philémon utilize Firm or Strict policies, indicating a market where hosts prioritize booking security.
Recommendations for Hosts
- Consider adopting a Super Strict 30 Days policy to align with the 37.5% market standard in Saint-Philémon.
- With 35% using Strict terms, this is a viable option in Saint-Philémon, particularly for high-value properties or during peak demand periods.
- Regularly review your cancellation policy against competitors and market demand shifts in Saint-Philémon.
Saint-Philémon STR Booking Lead Time Analysis (2025)
Average Booking Lead Time by Month
Booking Lead Time Insights for Saint-Philémon
- The overall average booking lead time for vacation rentals in Saint-Philémon is 64 days.
- Guests book furthest in advance for stays during June (average 102 days), likely coinciding with peak travel demand or local events.
- The shortest booking windows occur for stays in November (average 47 days), indicating more last-minute travel plans during this time.
- Seasonally, Summer (86 days avg.) sees the longest lead times, while Fall (69 days avg.) has the shortest, reflecting typical travel planning cycles.
Recommendations for Hosts
- Use the overall average lead time (64 days) as a baseline for your pricing and availability strategy in Saint-Philémon.
- For June stays, consider implementing length-of-stay discounts or slightly higher rates for bookings made less than 102 days out to capitalize on advance planning.
- Target marketing efforts for the Summer season well in advance (at least 86 days) to capture early planners.
- Monitor your own booking lead times against these Saint-Philémon averages to identify opportunities for dynamic pricing adjustments.
Popular & Essential Airbnb Amenities in Saint-Philémon (2025)
Amenity Prevalence
No amenities with partial availability (less than 100%) were found to display in the chart. All essential amenities might be present in all listings. Check insights below.
Amenity Insights for Saint-Philémon
- Essential amenities in Saint-Philémon that guests expect include: Refrigerator, Coffee maker, Dryer, Wifi, Washer, Smoke alarm, TV, First aid kit, Free parking on premises, Heating. Lacking these (any) could significantly impact bookings.
Recommendations for Hosts
- Ensure your listing includes all essential amenities for Saint-Philémon: Refrigerator, Coffee maker, Dryer, Wifi, Washer, Smoke alarm, TV, First aid kit, Free parking on premises, Heating.
- Highlight unique or less common amenities you offer (e.g., hot tub, dedicated workspace, EV charger) in your listing description and photos.
- Regularly check competitor amenities in Saint-Philémon to stay competitive.
Saint-Philémon Airbnb Guest Demographics & Profile Analysis (2025)
Guest Profile Summary for Saint-Philémon
- The typical guest profile for Airbnb in Saint-Philémon consists of primarily domestic travelers (91%), often arriving from nearby Montreal, typically belonging to the Post-2000s (Gen Z/Alpha) group (50%), primarily speaking French or English.
- Domestic travelers account for 91.0% of guests.
- Key international markets include Canada (91%) and United States (5.3%).
- Top languages spoken are French (45.8%) followed by English (39.7%).
- A significant demographic segment is the Post-2000s (Gen Z/Alpha) group, representing 50% of guests.
Recommendations for Hosts
- Target domestic marketing efforts towards travelers from Montreal and Québec City.
- Tailor amenities and listing descriptions to appeal to the dominant Post-2000s (Gen Z/Alpha) demographic (e.g., highlight fast WiFi, smart home features, local guides).
- Highlight unique local experiences or amenities relevant to the primary guest profile.
- Consider seasonal promotions aligned with peak travel times for key origin markets.
Nearby Short-Term Rental Market Comparison
How does the Saint-Philémon Airbnb market stack up against its neighbors? Compare key performance metrics like average monthly revenue, ADR, and occupancy rates in surrounding areas to understand the broader regional STR landscape.
| Market | Active Properties | Monthly Revenue | Daily Rate | Avg. Occupancy |
|---|---|---|---|---|
| Shannon | 25 | $3,918 | $240.28 | 51% |
| Lac-Beauport | 56 | $3,512 | $213.74 | 52% |
| Taunton & Raynham Academy Grant | 12 | $3,503 | $337.93 | 52% |
| Saint-François-de-l'Île-d'Orléans | 12 | $3,291 | $336.24 | 39% |
| Saint-Basile | 12 | $3,221 | $180.24 | 52% |
| Les Éboulements | 137 | $3,141 | $227.50 | 42% |
| Bury | 10 | $3,020 | $233.18 | 46% |
| Val-des-Sources | 11 | $2,976 | $218.40 | 45% |
| Carrabassett Valley | 211 | $2,862 | $379.41 | 37% |
| Beaver Cove | 24 | $2,850 | $332.87 | 37% |