Saint-Jérôme Airbnb Market Analysis 2025: Short Term Rental Data & Vacation Rental Statistics in Quebec, Canada
Is Airbnb profitable in Saint-Jérôme in 2025? Explore comprehensive Airbnb analytics for Saint-Jérôme, Quebec, Canada to uncover income potential. This 2025 STR market report for Saint-Jérôme, based on AirROI data from April 2024 to March 2025, reveals key trends in the niche market of 18 active listings.
Whether you're considering an Airbnb investment in Saint-Jérôme, optimizing your existing vacation rental, or exploring rental arbitrage opportunities, understanding the Saint-Jérôme Airbnb data is crucial. Navigating the high regulation landscape is key to maximizing your short term rental income potential. Let's dive into the specifics.
Key Saint-Jérôme Airbnb Performance Metrics Overview
Monthly Airbnb Revenue Variations & Income Potential in Saint-Jérôme (2025)
Understanding the monthly revenue variations for Airbnb listings in Saint-Jérôme is key to maximizing your short term rental income potential. Seasonality significantly impacts earnings. Our analysis, based on data from the past 12 months, shows that the peak revenue month for STRs in Saint-Jérôme is typically May, while February often presents the lowest earnings, highlighting opportunities for strategic pricing adjustments during shoulder and low seasons. Explore the typical Airbnb income in Saint-Jérôme across different performance tiers:
- Best-in-class properties (Top 10%) achieve $4,198+ monthly, often utilizing dynamic pricing and superior guest experiences.
- Strong performing properties (Top 25%) earn $3,086 or more, indicating effective management and desirable locations/amenities.
- Typical properties (Median) generate around $1,848 per month, representing the average market performance.
- Entry-level properties (Bottom 25%) see earnings around $820, often with potential for optimization.
Average Monthly Airbnb Earnings Trend in Saint-Jérôme
Saint-Jérôme Airbnb Occupancy Rate Trends (2025)
Maximize your bookings by understanding the Saint-Jérôme STR occupancy trends. Seasonal demand shifts significantly influence how often properties are booked. Typically, Septembersees the highest demand (peak season occupancy), while March experiences the lowest (low season). Effective strategies, like adjusting minimum stays or offering promotions, can boost occupancy during slower periods. Here's how different property tiers perform in Saint-Jérôme:
- Best-in-class properties (Top 10%) achieve 87%+ occupancy, indicating high desirability and potentially optimized availability.
- Strong performing properties (Top 25%) maintain 75% or higher occupancy, suggesting good market fit and guest satisfaction.
- Typical properties (Median) have an occupancy rate around 51%.
- Entry-level properties (Bottom 25%) average 30% occupancy, potentially facing higher vacancy.
Average Monthly Occupancy Rate Trend in Saint-Jérôme
Average Daily Rate (ADR) Airbnb Trends in Saint-Jérôme (2025)
Effective short term rental pricing strategy in Saint-Jérôme involves understanding monthly ADR fluctuations. The Average Daily Rate (ADR) for Airbnb in Saint-Jérôme typically peaks in December and dips lowest during April. Leveraging Airbnb dynamic pricing tools or strategies based on this seasonality can significantly boost revenue. Here's a look at the typical nightly rates achieved:
- Best-in-class properties (Top 10%) command rates of $223+ per night, often due to premium features or locations.
- Strong performing properties (Top 25%) achieve nightly rates of $133 or more.
- Typical properties (Median) charge around $92 per night.
- Entry-level properties (Bottom 25%) earn around $60 per night.
Average Daily Rate (ADR) Trend by Month in Saint-Jérôme
Get Live Saint-Jérôme Market Intelligence 👇

Explore Real-time Analytics
Airbnb Seasonality Analysis & Trends in Saint-Jérôme (2025)
Peak Season (May, December, July)
- Revenue averages $2,803 per month
- Occupancy rates average 54.6%
- Daily rates average $116
Shoulder Season
- Revenue averages $2,147 per month
- Occupancy maintains around 54.7%
- Daily rates hold near $112
Low Season (February, March, November)
- Revenue drops to average $1,613 per month
- Occupancy decreases to average 45.3%
- Daily rates adjust to average $119
Seasonality Insights for Saint-Jérôme
- The Airbnb seasonality in Saint-Jérôme shows moderate seasonality with distinct peak and low periods. While the sections above show seasonal averages, it's also insightful to look at the extremes:
- During the high season, the absolute peak month showcases Saint-Jérôme's highest earning potential, with monthly revenues capable of climbing to $2,840, occupancy reaching a high of 65.9%, and ADRs peaking at $127.
- Conversely, the slowest single month of the year, typically falling within the low season, marks the market's lowest point. In this month, revenue might dip to $1,513, occupancy could drop to 32.9%, and ADRs may adjust down to $110.
- Understanding both the seasonal averages and these monthly peaks and troughs in revenue, occupancy, and ADR is crucial for maximizing your Airbnb profit potential in Saint-Jérôme.
Seasonal Strategies for Maximizing Profit
- Peak Season: Maximize revenue through premium pricing and potentially longer minimum stays. Ensure high availability.
- Low Season: Offer competitive pricing, special promotions (e.g., extended stay discounts), and flexible cancellation policies. Target off-season travelers like remote workers or budget-conscious guests.
- Shoulder Seasons: Implement dynamic pricing that balances peak and low rates. Target weekend travelers or specific events. Offer slightly more flexible terms than peak season.
- Regularly analyze your own performance against these Saint-Jérôme seasonality benchmarks and adjust your pricing and availability strategy accordingly.
Best Areas for Airbnb Investment in Saint-Jérôme (2025)
Exploring the top neighborhoods for short-term rentals in Saint-Jérôme? This section highlights key areas, outlining why they are attractive for hosts and guests, along with notable local attractions. Consider these locations based on your target guest profile and investment strategy.
| Neighborhood / Area | Why Host Here? (Target Guests & Appeal) | Key Attractions & Landmarks |
|---|---|---|
| Old Saint-Jérôme | Charming historical district with quaint streets, restaurants, and local shops. Great for tourists looking to experience local culture and history. | Saint-Jérôme Cathedral, The Art Gallery of Saint-Jérôme, Place de la Gare, Theaters and local cafes, Parc de la Rivière-du-Nord |
| Saint-Antoine | Quiet residential area that attracts families and couples looking for a peaceful getaway near nature. | Parc Simon-Napoléon-Fecteau, Bicycling trails, Nearby lakes for swimming, Serene parks for picnics, Proximity to the Laurentians |
| Laval | Just a short drive away, this area offers a mix of suburban comfort with access to urban amenities and parks, appealing to diverse travelers. | Centropolis, Laval Rocket games, The Cosmodome Space Science Centre, Laval Nature Centre |
| Les Écarts | Scenic area known for outdoor activities, perfect for adventure seekers and nature lovers. | Hiking trails, Camping sites, Kayaking and canoeing, Snowshoeing in winter |
| Saint-Jérôme Nord | Rapidly developing area attracting young professionals and families, promising growth and demand for rentals. | Shopping centers, Local dining options, Community events, Proximity to public transport |
| Val-des-Lacs | A beautiful natural area that is popular for retreat rentals, attracting guests looking for tranquility and nature. | Lakes for swimming and fishing, Hiking in the mountains, Winter sports facilities |
| Prévost | Nearby community with several attractions and close proximity to ski resorts, appealing to seasonal visitors and outdoor enthusiasts. | Mont Habitant ski resort, Prévost Nature Park, Art galleries, Local markets |
| La Rivière-du-Nord | An area known for its riverside properties and recreational activities, drawing guests interested in outdoor fun and scenic views. | Parc de la Rivière-du-Nord, Kayaking, Fishing, Cycle trails |
Understanding Airbnb License Requirements & STR Laws in Saint-Jérôme (2025)
Yes, Saint-Jérôme, Quebec, Canada enforces high STR regulations. Obtaining a license and ensuring compliance is almost certainly required according to current 2025 STR laws. Always verify the latest short term rental regulations and Airbnb license requirements directly with local government authorities for Saint-Jérôme to ensure full compliance before hosting.
(Source: AirROI data, 2025, based on 44% licensed listings)
Top Performing Airbnb Properties in Saint-Jérôme (2025)
Benchmark your potential! Explore examples of top-performing Airbnb properties in Saint-Jérômebased on Trailing Twelve Month (TTM) revenue. Analyze their characteristics, revenue, occupancy rate, and ADR to understand what drives success in this market.
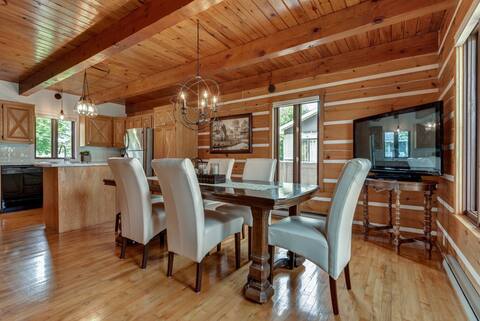
Charming and very spacious Canadian house
Entire Place • 4 bedrooms
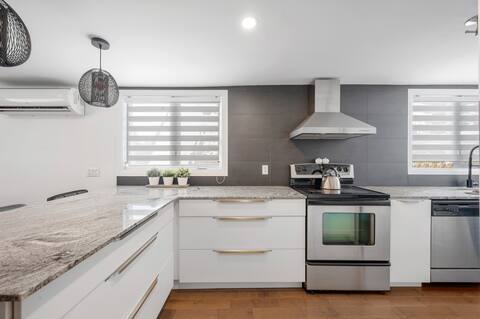
Big comfy house! Free parking, Fast Wi-Fi
Entire Place • 3 bedrooms
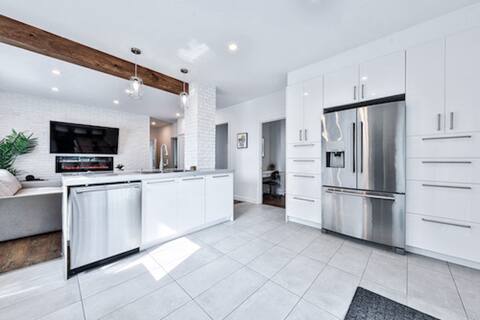
Theatre - Downtown
Entire Place • 3 bedrooms
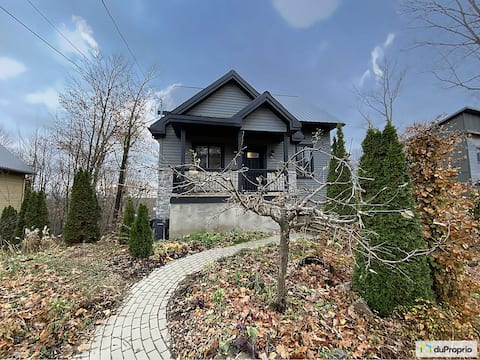
Industrial style-Highway canopy VIEW
Entire Place • 2 bedrooms
The glass balcony.
Entire Place • 1 bedroom

Cozy downtown Saint Jerome
Entire Place • 2 bedrooms
Note: Performance varies based on location, size, amenities, seasonality, and management quality. Data reflects the past 12 months.
Top Performing Airbnb Hosts in Saint-Jérôme (2025)
Learn from the best! This table showcases top-performing Airbnb hosts in Saint-Jérôme based on the number of properties managed and estimated total revenue over the past year. Analyze their scale and performance metrics.
| Host Name | Properties | Grossing Revenue | Stay Reviews | Avg Rating |
|---|---|---|---|---|
| Annie | 2 | $37,523 | 49 | 2.46/5.0 |
| Robert | 1 | $37,148 | 18 | 4.89/5.0 |
| Sébastien | 1 | $36,195 | 59 | 4.97/5.0 |
| Mireille | 1 | $25,981 | 50 | 4.52/5.0 |
| Nancy | 1 | $25,882 | 22 | 4.77/5.0 |
| Sandrine | 1 | $23,241 | 24 | 4.71/5.0 |
| Solo Location | 1 | $16,140 | 49 | 4.94/5.0 |
| Host #180416995 | 1 | $15,556 | 1 | 0.00/5.0 |
| Armelle | 1 | $12,242 | 29 | 4.48/5.0 |
| Host #529793623 | 1 | $10,684 | 14 | 4.71/5.0 |
Analyzing the strategies of top hosts, such as their property selection, pricing, and guest communication, can offer valuable lessons for optimizing your own Airbnb operations in Saint-Jérôme.
Dive Deeper: Advanced Saint-Jérôme STR Market Data (2025)
Ready to unlock more insights? AirROI provides access to advanced metrics and comprehensive Airbnb data for Saint-Jérôme. Explore detailed analytics beyond this report to refine your investment strategy, optimize pricing, and maximize your vacation rental profits.
Explore Advanced MetricsSaint-Jérôme Short-Term Rental Market Composition (2025): Property & Room Types
Room Type Distribution
Property Type Distribution
Market Composition Insights for Saint-Jérôme
- The Saint-Jérôme Airbnb market composition is heavily skewed towards Entire Home/Apt listings, which make up 100% of the 18 active rentals. This indicates strong guest preference for privacy and space.
- Looking at the property type distribution in Saint-Jérôme, House properties are the most common (50%), reflecting the local real estate landscape.
- Houses represent a significant 50% portion, catering likely to families or larger groups.
Saint-Jérôme Airbnb Room Capacity Analysis (2025): Bedroom Distribution
Distribution of Listings by Number of Bedrooms
Room Capacity Insights for Saint-Jérôme
- The dominant room capacity in Saint-Jérôme is 2 bedrooms listings, making up 38.9% of the market. This suggests a strong demand for properties suitable for couples or solo travelers.
- Together, 2 bedrooms and 1 bedroom properties represent 61.1% of the active Airbnb listings in Saint-Jérôme, indicating a high concentration in these sizes.
- A significant 33.4% of listings offer 3+ bedrooms, catering to larger groups and families seeking more space in Saint-Jérôme.
Saint-Jérôme Vacation Rental Guest Capacity Trends (2025)
Distribution of Listings by Guest Capacity
Guest Capacity Insights for Saint-Jérôme
- The most common guest capacity trend in Saint-Jérôme vacation rentals is listings accommodating 4 guests (44.4%). This suggests the primary traveler segment is likely small families or groups.
- Properties designed for 4 guests and 8+ guests dominate the Saint-Jérôme STR market, accounting for 61.1% of listings.
- 27.9% of properties accommodate 6+ guests, serving the market segment for larger families or group travel in Saint-Jérôme.
- On average, properties in Saint-Jérôme are equipped to host 4.9 guests.
Saint-Jérôme Airbnb Booking Patterns (2025): Available vs. Booked Days
Available Days Distribution
Booked Days Distribution
Booking Pattern Insights for Saint-Jérôme
- The most common availability pattern in Saint-Jérôme falls within the 271-366 days range, representing 44.4% of listings. This suggests many properties have significant open periods on their calendars.
- Approximately 66.6% of listings show high availability (181+ days open annually), indicating potential for increased bookings or specific owner usage patterns.
- For booked days, the 181-270 days range is most frequent in Saint-Jérôme (27.8%), reflecting common guest stay durations or potential owner blocking patterns.
- A notable 38.9% of properties secure long booking periods (181+ days booked per year), highlighting successful long-term rental strategies or significant owner usage.
Saint-Jérôme Airbnb Minimum Stay Requirements Analysis
Distribution of Listings by Minimum Night Requirement
2 Nights
4 listings
28.6% of total
4-6 Nights
1 listings
7.1% of total
7-29 Nights
1 listings
7.1% of total
30+ Nights
8 listings
57.1% of total
Key Insights
- The most prevalent minimum stay requirement in Saint-Jérôme is 30+ Nights, adopted by 57.1% of listings. This highlights the market's preference for longer commitments.
- A significant segment (57.1%) caters to monthly stays (30+ nights) in Saint-Jérôme, pointing to opportunities in the extended-stay market.
Recommendations
- Align with the market by considering a 30+ Nights minimum stay, as 57.1% of Saint-Jérôme hosts use this setting.
- Explore offering discounts for stays of 30+ nights to attract the 57.1% of the market seeking extended stays.
- Adjust minimum nights based on seasonality – potentially shorter during low season and longer during peak demand periods in Saint-Jérôme.
Saint-Jérôme Airbnb Cancellation Policy Trends Analysis (2025)
Flexible
3 listings
25% of total
Moderate
1 listings
8.3% of total
Firm
6 listings
50% of total
Strict
2 listings
16.7% of total
Cancellation Policy Insights for Saint-Jérôme
- The prevailing Airbnb cancellation policy trend in Saint-Jérôme is Firm, used by 50% of listings.
- A majority (66.7%) of hosts in Saint-Jérôme utilize Firm or Strict policies, indicating a market where hosts prioritize booking security.
Recommendations for Hosts
- Consider adopting a Firm policy to align with the 50% market standard in Saint-Jérôme.
- Regularly review your cancellation policy against competitors and market demand shifts in Saint-Jérôme.
Saint-Jérôme STR Booking Lead Time Analysis (2025)
Average Booking Lead Time by Month
Booking Lead Time Insights for Saint-Jérôme
- The overall average booking lead time for vacation rentals in Saint-Jérôme is 65 days.
- Guests book furthest in advance for stays during June (average 117 days), likely coinciding with peak travel demand or local events.
- The shortest booking windows occur for stays in February (average 35 days), indicating more last-minute travel plans during this time.
- Seasonally, Summer (80 days avg.) sees the longest lead times, while Winter (44 days avg.) has the shortest, reflecting typical travel planning cycles.
Recommendations for Hosts
- Use the overall average lead time (65 days) as a baseline for your pricing and availability strategy in Saint-Jérôme.
- For June stays, consider implementing length-of-stay discounts or slightly higher rates for bookings made less than 117 days out to capitalize on advance planning.
- Target marketing efforts for the Summer season well in advance (at least 80 days) to capture early planners.
- Monitor your own booking lead times against these Saint-Jérôme averages to identify opportunities for dynamic pricing adjustments.
Popular & Essential Airbnb Amenities in Saint-Jérôme (2025)
Amenity Prevalence
Amenity Insights for Saint-Jérôme
- Essential amenities in Saint-Jérôme that guests expect include: Refrigerator, Hangers, Wifi, TV, Dishes and silverware, Microwave, Hot water, Free parking on premises, Smoke alarm. Lacking these (any) could significantly impact bookings.
- Popular amenities like Air conditioning are common but not universal. Offering these can provide a competitive edge.
Recommendations for Hosts
- Ensure your listing includes all essential amenities for Saint-Jérôme: Refrigerator, Hangers, Wifi, TV, Dishes and silverware, Microwave, Hot water, Free parking on premises, Smoke alarm.
- Consider adding popular differentiators like Air conditioning to increase appeal.
- Highlight unique or less common amenities you offer (e.g., hot tub, dedicated workspace, EV charger) in your listing description and photos.
- Regularly check competitor amenities in Saint-Jérôme to stay competitive.
Saint-Jérôme Airbnb Guest Demographics & Profile Analysis (2025)
Guest Profile Summary for Saint-Jérôme
- The typical guest profile for Airbnb in Saint-Jérôme consists of a mix of domestic (65%) and international guests, often arriving from nearby Toronto, typically belonging to the Post-2000s (Gen Z/Alpha) group (50%), primarily speaking English or French.
- Domestic travelers account for 64.5% of guests.
- Key international markets include Canada (64.5%) and United States (13.6%).
- Top languages spoken are English (43.4%) followed by French (31%).
- A significant demographic segment is the Post-2000s (Gen Z/Alpha) group, representing 50% of guests.
Recommendations for Hosts
- Target domestic marketing efforts towards travelers from Toronto and Montreal.
- Tailor amenities and listing descriptions to appeal to the dominant Post-2000s (Gen Z/Alpha) demographic (e.g., highlight fast WiFi, smart home features, local guides).
- Highlight unique local experiences or amenities relevant to the primary guest profile.
- Consider seasonal promotions aligned with peak travel times for key origin markets.
Nearby Short-Term Rental Market Comparison
How does the Saint-Jérôme Airbnb market stack up against its neighbors? Compare key performance metrics like average monthly revenue, ADR, and occupancy rates in surrounding areas to understand the broader regional STR landscape.
| Market | Active Properties | Monthly Revenue | Daily Rate | Avg. Occupancy |
|---|---|---|---|---|
| Mille-Isles | 93 | $5,049 | $415.08 | 41% |
| Malletts Bay | 49 | $4,960 | $414.58 | 48% |
| Wilmington | 130 | $4,484 | $324.06 | 45% |
| Grenville-sur-la-Rouge | 32 | $4,226 | $362.40 | 41% |
| Middlebury | 52 | $4,128 | $288.39 | 54% |
| New Haven | 12 | $3,904 | $206.65 | 58% |
| South Burlington | 103 | $3,864 | $291.90 | 50% |
| La Conception | 172 | $3,846 | $290.12 | 42% |
| Town of North Elba | 249 | $3,765 | $395.96 | 41% |
| Cantley | 22 | $3,741 | $242.96 | 50% |