Saint-Georges Airbnb Market Analysis 2025: Short Term Rental Data & Vacation Rental Statistics in Quebec, Canada
Is Airbnb profitable in Saint-Georges in 2025? Explore comprehensive Airbnb analytics for Saint-Georges, Quebec, Canada to uncover income potential. This 2025 STR market report for Saint-Georges, based on AirROI data from April 2024 to March 2025, reveals key trends in the niche market of 24 active listings.
Whether you're considering an Airbnb investment in Saint-Georges, optimizing your existing vacation rental, or exploring rental arbitrage opportunities, understanding the Saint-Georges Airbnb data is crucial. Navigating the high regulation landscape is key to maximizing your short term rental income potential. Let's dive into the specifics.
Key Saint-Georges Airbnb Performance Metrics Overview
Monthly Airbnb Revenue Variations & Income Potential in Saint-Georges (2025)
Understanding the monthly revenue variations for Airbnb listings in Saint-Georges is key to maximizing your short term rental income potential. Seasonality significantly impacts earnings. Our analysis, based on data from the past 12 months, shows that the peak revenue month for STRs in Saint-Georges is typically June, while January often presents the lowest earnings, highlighting opportunities for strategic pricing adjustments during shoulder and low seasons. Explore the typical Airbnb income in Saint-Georges across different performance tiers:
- Best-in-class properties (Top 10%) achieve $2,411+ monthly, often utilizing dynamic pricing and superior guest experiences.
- Strong performing properties (Top 25%) earn $1,584 or more, indicating effective management and desirable locations/amenities.
- Typical properties (Median) generate around $838 per month, representing the average market performance.
- Entry-level properties (Bottom 25%) see earnings around $407, often with potential for optimization.
Average Monthly Airbnb Earnings Trend in Saint-Georges
Saint-Georges Airbnb Occupancy Rate Trends (2025)
Maximize your bookings by understanding the Saint-Georges STR occupancy trends. Seasonal demand shifts significantly influence how often properties are booked. Typically, Julysees the highest demand (peak season occupancy), while May experiences the lowest (low season). Effective strategies, like adjusting minimum stays or offering promotions, can boost occupancy during slower periods. Here's how different property tiers perform in Saint-Georges:
- Best-in-class properties (Top 10%) achieve 69%+ occupancy, indicating high desirability and potentially optimized availability.
- Strong performing properties (Top 25%) maintain 55% or higher occupancy, suggesting good market fit and guest satisfaction.
- Typical properties (Median) have an occupancy rate around 35%.
- Entry-level properties (Bottom 25%) average 21% occupancy, potentially facing higher vacancy.
Average Monthly Occupancy Rate Trend in Saint-Georges
Average Daily Rate (ADR) Airbnb Trends in Saint-Georges (2025)
Effective short term rental pricing strategy in Saint-Georges involves understanding monthly ADR fluctuations. The Average Daily Rate (ADR) for Airbnb in Saint-Georges typically peaks in November and dips lowest during May. Leveraging Airbnb dynamic pricing tools or strategies based on this seasonality can significantly boost revenue. Here's a look at the typical nightly rates achieved:
- Best-in-class properties (Top 10%) command rates of $153+ per night, often due to premium features or locations.
- Strong performing properties (Top 25%) achieve nightly rates of $110 or more.
- Typical properties (Median) charge around $70 per night.
- Entry-level properties (Bottom 25%) earn around $52 per night.
Average Daily Rate (ADR) Trend by Month in Saint-Georges
Get Live Saint-Georges Market Intelligence 👇

Explore Real-time Analytics
Airbnb Seasonality Analysis & Trends in Saint-Georges (2025)
Peak Season (June, July, August)
- Revenue averages $1,895 per month
- Occupancy rates average 49.7%
- Daily rates average $94
Shoulder Season
- Revenue averages $1,452 per month
- Occupancy maintains around 36.6%
- Daily rates hold near $96
Low Season (January, February, March)
- Revenue drops to average $1,060 per month
- Occupancy decreases to average 32.7%
- Daily rates adjust to average $98
Seasonality Insights for Saint-Georges
- The Airbnb seasonality in Saint-Georges shows highly seasonal trends requiring careful strategy. While the sections above show seasonal averages, it's also insightful to look at the extremes:
- During the high season, the absolute peak month showcases Saint-Georges's highest earning potential, with monthly revenues capable of climbing to $1,950, occupancy reaching a high of 50.5%, and ADRs peaking at $102.
- Conversely, the slowest single month of the year, typically falling within the low season, marks the market's lowest point. In this month, revenue might dip to $908, occupancy could drop to 22.6%, and ADRs may adjust down to $93.
- Understanding both the seasonal averages and these monthly peaks and troughs in revenue, occupancy, and ADR is crucial for maximizing your Airbnb profit potential in Saint-Georges.
Seasonal Strategies for Maximizing Profit
- Peak Season: Maximize revenue through premium pricing and potentially longer minimum stays. Ensure high availability.
- Low Season: Offer competitive pricing, special promotions (e.g., extended stay discounts), and flexible cancellation policies. Target off-season travelers like remote workers or budget-conscious guests.
- Shoulder Seasons: Implement dynamic pricing that balances peak and low rates. Target weekend travelers or specific events. Offer slightly more flexible terms than peak season.
- Regularly analyze your own performance against these Saint-Georges seasonality benchmarks and adjust your pricing and availability strategy accordingly.
Best Areas for Airbnb Investment in Saint-Georges (2025)
Exploring the top neighborhoods for short-term rentals in Saint-Georges? This section highlights key areas, outlining why they are attractive for hosts and guests, along with notable local attractions. Consider these locations based on your target guest profile and investment strategy.
| Neighborhood / Area | Why Host Here? (Target Guests & Appeal) | Key Attractions & Landmarks |
|---|---|---|
| Centre-ville de Saint-Georges | The vibrant downtown area features local shops, restaurants, and cultural venues. It's ideal for visitors looking to experience the community's local life and events. | Saint-Georges Museum, Cultural Centre of Saint-Georges, Local restaurants and cafes, Public market, Park of the Promenade |
| Parc de la Chute | A beautiful natural area that offers outdoor activities and scenic views, attractive to nature enthusiasts and families looking to relax in the green spaces. | Chute de la Rivière du Nord, Biking and walking trails, Picnic areas, Wildlife watching, Water activities |
| Saint-Georges de Beauce | Known for its picturesque landscapes and proximity to outdoor recreational activities. A great option for tourists seeking adventure sports like hiking and cycling. | Mount Sugar Loaf, Beauce Golf Club, Beauce River activities, Winter skiing and snow sports, Local farms and markets |
| Parc industriel de Saint-Georges | A growing area with businesses and corporate offices nearby. Attracts business travelers, especially for short stays during trade shows and meetings. | Proximity to corporate offices, Business amenities, Event centers, Logistics hubs, Nearby cafes |
| Saint-Georges Lake | A serene and scenic location for visitors looking to enjoy a peaceful retreat. It's perfect for fishing, boating, and lakeside relaxation. | Lakeside parks, Fishing spots, Canoeing and kayaking, Nature trails, Picnic spots |
| L'Isle-Verte | A charming village near Saint-Georges known for its hospitality and unique local culture. Great for visitors looking for an authentic Quebec experience. | Historic sites, Local festivals, Artisan markets, Nature trails, Culinary experiences |
| Route 173 | A popular route for travelers to stop and explore local attractions and businesses. Ideal for those looking for a convenient stay as they travel through Quebec. | Local eateries, Shopping centers, Scenic views, Cultural landmarks, Access to main highways |
| BeauceArt | An emerging neighborhood focusing on local arts and crafts, attracting visitors interested in cultural experiences and local artistry. | Art galleries, Craft shops, Local artisan workshops, Cultural events, Community festivals |
Understanding Airbnb License Requirements & STR Laws in Saint-Georges (2025)
Yes, Saint-Georges, Quebec, Canada enforces high STR regulations. Obtaining a license and ensuring compliance is almost certainly required according to current 2025 STR laws. Always verify the latest short term rental regulations and Airbnb license requirements directly with local government authorities for Saint-Georges to ensure full compliance before hosting.
(Source: AirROI data, 2025, based on 88% licensed listings)
Top Performing Airbnb Properties in Saint-Georges (2025)
Benchmark your potential! Explore examples of top-performing Airbnb properties in Saint-Georgesbased on Trailing Twelve Month (TTM) revenue. Analyze their characteristics, revenue, occupancy rate, and ADR to understand what drives success in this market.
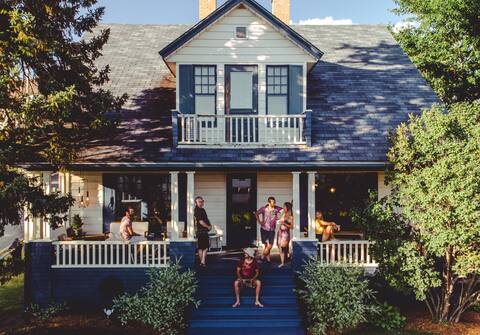
Great centennial house, downtown St-Georges
Entire Place • 7 bedrooms

Pull available
Entire Place • 3 bedrooms
Chez Jasmin *4-1/2
Entire Place • 2 bedrooms
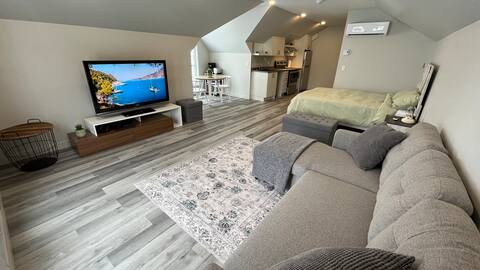
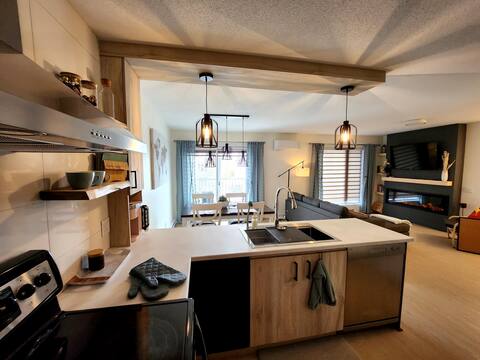
Lovely Loft with Jacuzzi and heated garage!
Entire Place • 1 bedroom
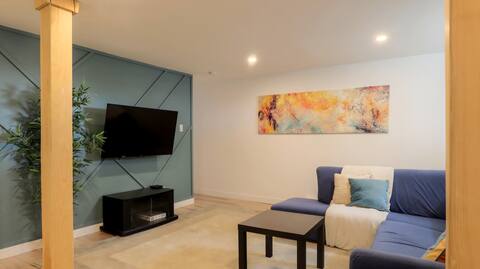
Beautiful apartment with parking, close to everything
Entire Place • 2 bedrooms
4 1/2 at Rosaire, Les Ôtres.
Entire Place • 2 bedrooms
Note: Performance varies based on location, size, amenities, seasonality, and management quality. Data reflects the past 12 months.
Top Performing Airbnb Hosts in Saint-Georges (2025)
Learn from the best! This table showcases top-performing Airbnb hosts in Saint-Georges based on the number of properties managed and estimated total revenue over the past year. Analyze their scale and performance metrics.
| Host Name | Properties | Grossing Revenue | Stay Reviews | Avg Rating |
|---|---|---|---|---|
| Maryse | 10 | $196,591 | 587 | 4.96/5.0 |
| Sandra | 2 | $38,743 | 16 | 5.00/5.0 |
| Maryane | 1 | $34,905 | 63 | 4.90/5.0 |
| Dominic | 1 | $18,903 | 84 | 4.96/5.0 |
| Charles | 1 | $18,523 | 110 | 4.85/5.0 |
| Carol | 4 | $17,426 | 218 | 4.93/5.0 |
| Brandon | 1 | $7,523 | 9 | 4.78/5.0 |
| Jeanne Mance | 2 | $5,455 | 97 | 4.78/5.0 |
| Steven | 1 | $1,523 | 3 | 3.67/5.0 |
| Jacques | 1 | $1,206 | 7 | 4.86/5.0 |
Analyzing the strategies of top hosts, such as their property selection, pricing, and guest communication, can offer valuable lessons for optimizing your own Airbnb operations in Saint-Georges.
Dive Deeper: Advanced Saint-Georges STR Market Data (2025)
Ready to unlock more insights? AirROI provides access to advanced metrics and comprehensive Airbnb data for Saint-Georges. Explore detailed analytics beyond this report to refine your investment strategy, optimize pricing, and maximize your vacation rental profits.
Explore Advanced MetricsSaint-Georges Short-Term Rental Market Composition (2025): Property & Room Types
Room Type Distribution
Property Type Distribution
Market Composition Insights for Saint-Georges
- The Saint-Georges Airbnb market composition is heavily skewed towards Entire Home/Apt listings, which make up 54.2% of the 24 active rentals. This indicates strong guest preference for privacy and space.
- However, a notable 45.8% share for Private Rooms suggests opportunities for budget-conscious travelers or hosts renting out spare rooms.
- Looking at the property type distribution in Saint-Georges, House properties are the most common (58.3%), reflecting the local real estate landscape.
- Houses represent a significant 58.3% portion, catering likely to families or larger groups.
Saint-Georges Airbnb Room Capacity Analysis (2025): Bedroom Distribution
Distribution of Listings by Number of Bedrooms
Room Capacity Insights for Saint-Georges
- The dominant room capacity in Saint-Georges is 2 bedrooms listings, making up 20.8% of the market. This suggests a strong demand for properties suitable for couples or solo travelers.
- Together, 2 bedrooms and 1 bedroom properties represent 41.6% of the active Airbnb listings in Saint-Georges, indicating a high concentration in these sizes.
Saint-Georges Vacation Rental Guest Capacity Trends (2025)
Distribution of Listings by Guest Capacity
Guest Capacity Insights for Saint-Georges
- The most common guest capacity trend in Saint-Georges vacation rentals is listings accommodating 4 guests (25%). This suggests the primary traveler segment is likely small families or groups.
- Properties designed for 4 guests and 2 guests dominate the Saint-Georges STR market, accounting for 33.3% of listings.
- 12.5% of properties accommodate 6+ guests, serving the market segment for larger families or group travel in Saint-Georges.
- On average, properties in Saint-Georges are equipped to host 2.2 guests.
Saint-Georges Airbnb Booking Patterns (2025): Available vs. Booked Days
Available Days Distribution
Booked Days Distribution
Booking Pattern Insights for Saint-Georges
- The most common availability pattern in Saint-Georges falls within the 181-270 days range, representing 50% of listings. This suggests many properties have significant open periods on their calendars.
- Approximately 79.2% of listings show high availability (181+ days open annually), indicating potential for increased bookings or specific owner usage patterns.
- For booked days, the 91-180 days range is most frequent in Saint-Georges (50%), reflecting common guest stay durations or potential owner blocking patterns.
- A notable 20.8% of properties secure long booking periods (181+ days booked per year), highlighting successful long-term rental strategies or significant owner usage.
Saint-Georges Airbnb Minimum Stay Requirements Analysis
Distribution of Listings by Minimum Night Requirement
1 Night
13 listings
54.2% of total
2 Nights
2 listings
8.3% of total
7-29 Nights
2 listings
8.3% of total
30+ Nights
7 listings
29.2% of total
Key Insights
- The most prevalent minimum stay requirement in Saint-Georges is 1 Night, adopted by 54.2% of listings. This highlights the market's preference for shorter, flexible bookings.
- A strong majority (62.5%) of the Saint-Georges Airbnb data shows acceptance of very short stays (1-2 nights), indicating a dynamic, high-turnover market.
- A significant segment (29.2%) caters to monthly stays (30+ nights) in Saint-Georges, pointing to opportunities in the extended-stay market.
Recommendations
- Align with the market by considering a 1 Night minimum stay, as 54.2% of Saint-Georges hosts use this setting.
- Explore offering discounts for stays of 30+ nights to attract the 29.2% of the market seeking extended stays.
- Adjust minimum nights based on seasonality – potentially shorter during low season and longer during peak demand periods in Saint-Georges.
Saint-Georges Airbnb Cancellation Policy Trends Analysis (2025)
Flexible
10 listings
41.7% of total
Moderate
5 listings
20.8% of total
Firm
3 listings
12.5% of total
Strict
6 listings
25% of total
Cancellation Policy Insights for Saint-Georges
- The prevailing Airbnb cancellation policy trend in Saint-Georges is Flexible, used by 41.7% of listings.
- There's a relatively balanced mix between guest-friendly (62.5%) and stricter (37.5%) policies, offering choices for different guest needs.
Recommendations for Hosts
- Consider adopting a Flexible policy to align with the 41.7% market standard in Saint-Georges.
- Regularly review your cancellation policy against competitors and market demand shifts in Saint-Georges.
Saint-Georges STR Booking Lead Time Analysis (2025)
Average Booking Lead Time by Month
Booking Lead Time Insights for Saint-Georges
- The overall average booking lead time for vacation rentals in Saint-Georges is 24 days.
- Guests book furthest in advance for stays during April (average 46 days), likely coinciding with peak travel demand or local events.
- The shortest booking windows occur for stays in March (average 14 days), indicating more last-minute travel plans during this time.
- Seasonally, Summer (30 days avg.) sees the longest lead times, while Winter (20 days avg.) has the shortest, reflecting typical travel planning cycles.
Recommendations for Hosts
- Use the overall average lead time (24 days) as a baseline for your pricing and availability strategy in Saint-Georges.
- For April stays, consider implementing length-of-stay discounts or slightly higher rates for bookings made less than 46 days out to capitalize on advance planning.
- During March, focus on last-minute booking availability and promotions, as guests book with very short notice (14 days avg.).
- Target marketing efforts for the Summer season well in advance (at least 30 days) to capture early planners.
- Monitor your own booking lead times against these Saint-Georges averages to identify opportunities for dynamic pricing adjustments.
Popular & Essential Airbnb Amenities in Saint-Georges (2025)
Amenity Prevalence
Amenity Insights for Saint-Georges
- Essential amenities in Saint-Georges that guests expect include: Wifi, Smoke alarm, Hot water, Free parking on premises, Heating, Hangers, Kitchen, Bed linens, Dishes and silverware, Cooking basics. Lacking these (any) could significantly impact bookings.
Recommendations for Hosts
- Ensure your listing includes all essential amenities for Saint-Georges: Wifi, Smoke alarm, Hot water, Free parking on premises, Heating, Hangers, Kitchen, Bed linens, Dishes and silverware, Cooking basics.
- Prioritize adding missing essentials: Bed linens, Dishes and silverware, Cooking basics.
- Highlight unique or less common amenities you offer (e.g., hot tub, dedicated workspace, EV charger) in your listing description and photos.
- Regularly check competitor amenities in Saint-Georges to stay competitive.
Saint-Georges Airbnb Guest Demographics & Profile Analysis (2025)
Guest Profile Summary for Saint-Georges
- The typical guest profile for Airbnb in Saint-Georges consists of primarily domestic travelers (77%), often arriving from nearby Montreal, typically belonging to the Post-2000s (Gen Z/Alpha) group (50%), primarily speaking French or English.
- Domestic travelers account for 77.4% of guests.
- Key international markets include Canada (77.4%) and United States (12.8%).
- Top languages spoken are French (47.9%) followed by English (41.5%).
- A significant demographic segment is the Post-2000s (Gen Z/Alpha) group, representing 50% of guests.
Recommendations for Hosts
- Target domestic marketing efforts towards travelers from Montreal and Saint-Georges.
- Tailor amenities and listing descriptions to appeal to the dominant Post-2000s (Gen Z/Alpha) demographic (e.g., highlight fast WiFi, smart home features, local guides).
- Highlight unique local experiences or amenities relevant to the primary guest profile.
- Consider seasonal promotions aligned with peak travel times for key origin markets.
Nearby Short-Term Rental Market Comparison
How does the Saint-Georges Airbnb market stack up against its neighbors? Compare key performance metrics like average monthly revenue, ADR, and occupancy rates in surrounding areas to understand the broader regional STR landscape.
| Market | Active Properties | Monthly Revenue | Daily Rate | Avg. Occupancy |
|---|---|---|---|---|
| Shannon | 25 | $3,918 | $240.28 | 51% |
| Lac-Beauport | 56 | $3,512 | $213.74 | 52% |
| Taunton & Raynham Academy Grant | 12 | $3,503 | $337.93 | 52% |
| Saint-François-de-l'Île-d'Orléans | 12 | $3,291 | $336.24 | 39% |
| Saint-Basile | 12 | $3,221 | $180.24 | 52% |
| Les Éboulements | 137 | $3,141 | $227.50 | 42% |
| Bury | 10 | $3,020 | $233.18 | 46% |
| Val-des-Sources | 11 | $2,976 | $218.40 | 45% |
| Carrabassett Valley | 211 | $2,862 | $379.41 | 37% |
| Beaver Cove | 24 | $2,850 | $332.87 | 37% |