Saint-Félicien Airbnb Market Analysis 2025: Short Term Rental Data & Vacation Rental Statistics in Quebec, Canada
Is Airbnb profitable in Saint-Félicien in 2025? Explore comprehensive Airbnb analytics for Saint-Félicien, Quebec, Canada to uncover income potential. This 2025 STR market report for Saint-Félicien, based on AirROI data from April 2024 to March 2025, reveals key trends in the niche market of 25 active listings.
Whether you're considering an Airbnb investment in Saint-Félicien, optimizing your existing vacation rental, or exploring rental arbitrage opportunities, understanding the Saint-Félicien Airbnb data is crucial. Navigating the high regulation landscape is key to maximizing your short term rental income potential. Let's dive into the specifics.
Key Saint-Félicien Airbnb Performance Metrics Overview
Monthly Airbnb Revenue Variations & Income Potential in Saint-Félicien (2025)
Understanding the monthly revenue variations for Airbnb listings in Saint-Félicien is key to maximizing your short term rental income potential. Seasonality significantly impacts earnings. Our analysis, based on data from the past 12 months, shows that the peak revenue month for STRs in Saint-Félicien is typically July, while February often presents the lowest earnings, highlighting opportunities for strategic pricing adjustments during shoulder and low seasons. Explore the typical Airbnb income in Saint-Félicien across different performance tiers:
- Best-in-class properties (Top 10%) achieve $3,235+ monthly, often utilizing dynamic pricing and superior guest experiences.
- Strong performing properties (Top 25%) earn $2,328 or more, indicating effective management and desirable locations/amenities.
- Typical properties (Median) generate around $1,411 per month, representing the average market performance.
- Entry-level properties (Bottom 25%) see earnings around $725, often with potential for optimization.
Average Monthly Airbnb Earnings Trend in Saint-Félicien
Saint-Félicien Airbnb Occupancy Rate Trends (2025)
Maximize your bookings by understanding the Saint-Félicien STR occupancy trends. Seasonal demand shifts significantly influence how often properties are booked. Typically, Julysees the highest demand (peak season occupancy), while February experiences the lowest (low season). Effective strategies, like adjusting minimum stays or offering promotions, can boost occupancy during slower periods. Here's how different property tiers perform in Saint-Félicien:
- Best-in-class properties (Top 10%) achieve 66%+ occupancy, indicating high desirability and potentially optimized availability.
- Strong performing properties (Top 25%) maintain 55% or higher occupancy, suggesting good market fit and guest satisfaction.
- Typical properties (Median) have an occupancy rate around 40%.
- Entry-level properties (Bottom 25%) average 22% occupancy, potentially facing higher vacancy.
Average Monthly Occupancy Rate Trend in Saint-Félicien
Average Daily Rate (ADR) Airbnb Trends in Saint-Félicien (2025)
Effective short term rental pricing strategy in Saint-Félicien involves understanding monthly ADR fluctuations. The Average Daily Rate (ADR) for Airbnb in Saint-Félicien typically peaks in August and dips lowest during November. Leveraging Airbnb dynamic pricing tools or strategies based on this seasonality can significantly boost revenue. Here's a look at the typical nightly rates achieved:
- Best-in-class properties (Top 10%) command rates of $173+ per night, often due to premium features or locations.
- Strong performing properties (Top 25%) achieve nightly rates of $146 or more.
- Typical properties (Median) charge around $113 per night.
- Entry-level properties (Bottom 25%) earn around $70 per night.
Average Daily Rate (ADR) Trend by Month in Saint-Félicien
Get Live Saint-Félicien Market Intelligence 👇
Explore Real-time Analytics
Airbnb Seasonality Analysis & Trends in Saint-Félicien (2025)
Peak Season (July, August, May)
- Revenue averages $2,579 per month
- Occupancy rates average 61.1%
- Daily rates average $120
Shoulder Season
- Revenue averages $1,597 per month
- Occupancy maintains around 37.9%
- Daily rates hold near $115
Low Season (January, February, November)
- Revenue drops to average $889 per month
- Occupancy decreases to average 23.9%
- Daily rates adjust to average $107
Seasonality Insights for Saint-Félicien
- The Airbnb seasonality in Saint-Félicien shows highly seasonal trends requiring careful strategy. While the sections above show seasonal averages, it's also insightful to look at the extremes:
- During the high season, the absolute peak month showcases Saint-Félicien's highest earning potential, with monthly revenues capable of climbing to $3,065, occupancy reaching a high of 70.1%, and ADRs peaking at $122.
- Conversely, the slowest single month of the year, typically falling within the low season, marks the market's lowest point. In this month, revenue might dip to $681, occupancy could drop to 17.8%, and ADRs may adjust down to $105.
- Understanding both the seasonal averages and these monthly peaks and troughs in revenue, occupancy, and ADR is crucial for maximizing your Airbnb profit potential in Saint-Félicien.
Seasonal Strategies for Maximizing Profit
- Peak Season: Maximize revenue through premium pricing and potentially longer minimum stays. Ensure high availability.
- Low Season: Offer competitive pricing, special promotions (e.g., extended stay discounts), and flexible cancellation policies. Target off-season travelers like remote workers or budget-conscious guests.
- Shoulder Seasons: Implement dynamic pricing that balances peak and low rates. Target weekend travelers or specific events. Offer slightly more flexible terms than peak season.
- Regularly analyze your own performance against these Saint-Félicien seasonality benchmarks and adjust your pricing and availability strategy accordingly.
Best Areas for Airbnb Investment in Saint-Félicien (2025)
Exploring the top neighborhoods for short-term rentals in Saint-Félicien? This section highlights key areas, outlining why they are attractive for hosts and guests, along with notable local attractions. Consider these locations based on your target guest profile and investment strategy.
| Neighborhood / Area | Why Host Here? (Target Guests & Appeal) | Key Attractions & Landmarks |
|---|---|---|
| Parc national de la Mauricie | A beautiful national park known for its stunning natural landscapes, hiking trails, and wildlife, making it a popular destination for outdoor enthusiasts and nature lovers. | Hiking trails, Lakes for canoeing, Wildlife watching, Beautiful scenery, Camping options |
| Club de golf Saint-Félicien | A picturesque golf course located in Saint-Félicien, attracting golf enthusiasts looking for a serene environment to enjoy their game. | Golfing, Scenic views of the course, Clubhouse amenities |
| Vieux Saint-Félicien | The charming old town area filled with historical buildings, local shops, and restaurants, providing a quaint atmosphere for vacationers. | Historic architecture, Local boutiques, Cafés and eateries, Weekly farmers market |
| Parc du Réservoir Beaudet | A recreational park offering various activities such as fishing, picnicking, and walking trails, ideal for families and local gatherings. | Walking trails, Picnic areas, Fishing spots |
| Musée de la Nature | A nature museum that showcases local wildlife and ecosystems, great for families and educational visits. | Nature exhibits, Interactive displays, Workshops for kids |
| La Petite Maison | A local bakery and café known for its baked goods and friendly atmosphere, attracting visitors looking for a cozy place to relax. | Artisan breads, Pastries, Café environment |
| Festival de la Moustache | A unique local festival celebrating moustaches and local culture, attracting visitors and tourists looking for a fun and quirky experience. | Festive events, Local entertainment, Food stalls |
| Routes des Vins | Wine routes in the region that offer tours and tastings, perfect for wine lovers looking for a charming getaway. | Vineyards, Wine tastings, Scenic drives |
Understanding Airbnb License Requirements & STR Laws in Saint-Félicien (2025)
Yes, Saint-Félicien, Quebec, Canada enforces high STR regulations. Obtaining a license and ensuring compliance is almost certainly required according to current 2025 STR laws. Always verify the latest short term rental regulations and Airbnb license requirements directly with local government authorities for Saint-Félicien to ensure full compliance before hosting.
(Source: AirROI data, 2025, based on 92% licensed listings)
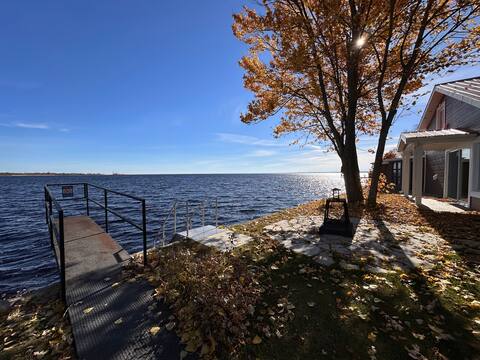
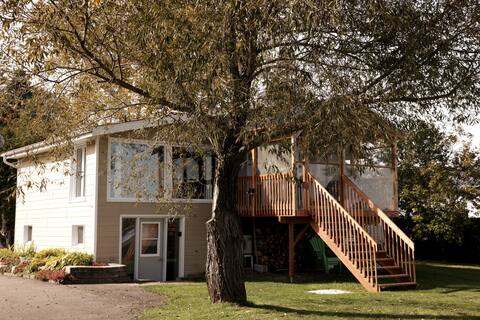
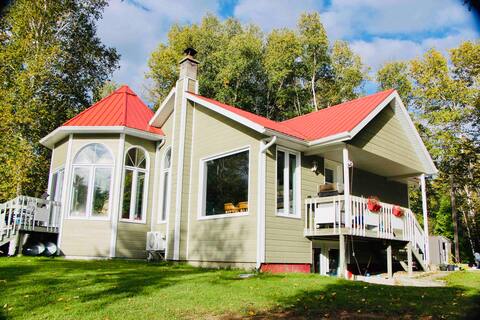
Top Performing Airbnb Properties in Saint-Félicien (2025)
Benchmark your potential! Explore examples of top-performing Airbnb properties in Saint-Félicienbased on Trailing Twelve Month (TTM) revenue. Analyze their characteristics, revenue, occupancy rate, and ADR to understand what drives success in this market.

In Ashuap's Paradise
Entire Place • 3 bedrooms
Hotel at home - Sure Doré
Entire Place • 3 bedrooms
Hotel at home - La Dorée with private beach
Entire Place • 3 bedrooms

Chalet style house
Entire Place • 3 bedrooms
Zen chalet in the heart of nature
Entire Place • 2 bedrooms

Chalet des Trois Bouleaux
Entire Place • 3 bedrooms
Note: Performance varies based on location, size, amenities, seasonality, and management quality. Data reflects the past 12 months.
Top Performing Airbnb Hosts in Saint-Félicien (2025)
Learn from the best! This table showcases top-performing Airbnb hosts in Saint-Félicien based on the number of properties managed and estimated total revenue over the past year. Analyze their scale and performance metrics.
| Host Name | Properties | Grossing Revenue | Stay Reviews | Avg Rating |
|---|---|---|---|---|
| Hôtel À La Maison | 2 | $67,095 | 41 | 4.38/5.0 |
| Émilie Et Charles | 1 | $37,521 | 169 | 4.95/5.0 |
| Anne | 1 | $23,902 | 193 | 4.75/5.0 |
| Claudie | 1 | $21,587 | 27 | 4.96/5.0 |
| Rudy | 1 | $21,318 | 38 | 4.89/5.0 |
| Jean-Sebastien | 1 | $21,249 | 158 | 4.63/5.0 |
| Helene | 1 | $20,469 | 75 | 4.91/5.0 |
| Jean | 1 | $17,818 | 39 | 4.85/5.0 |
| Julie | 1 | $17,735 | 262 | 4.80/5.0 |
| ChaletsConfort | 1 | $17,426 | 7 | 4.71/5.0 |
Analyzing the strategies of top hosts, such as their property selection, pricing, and guest communication, can offer valuable lessons for optimizing your own Airbnb operations in Saint-Félicien.
Dive Deeper: Advanced Saint-Félicien STR Market Data (2025)
Ready to unlock more insights? AirROI provides access to advanced metrics and comprehensive Airbnb data for Saint-Félicien. Explore detailed analytics beyond this report to refine your investment strategy, optimize pricing, and maximize your vacation rental profits.
Explore Advanced MetricsSaint-Félicien Short-Term Rental Market Composition (2025): Property & Room Types
Room Type Distribution
Property Type Distribution
Market Composition Insights for Saint-Félicien
- The Saint-Félicien Airbnb market composition is heavily skewed towards Entire Home/Apt listings, which make up 80% of the 25 active rentals. This indicates strong guest preference for privacy and space.
- Looking at the property type distribution in Saint-Félicien, House properties are the most common (88%), reflecting the local real estate landscape.
- Houses represent a significant 88% portion, catering likely to families or larger groups.
Saint-Félicien Airbnb Room Capacity Analysis (2025): Bedroom Distribution
Distribution of Listings by Number of Bedrooms
Room Capacity Insights for Saint-Félicien
- The dominant room capacity in Saint-Félicien is 2 bedrooms listings, making up 32% of the market. This suggests a strong demand for properties suitable for couples or solo travelers.
- Together, 2 bedrooms and 3 bedrooms properties represent 60.0% of the active Airbnb listings in Saint-Félicien, indicating a high concentration in these sizes.
- A significant 36.0% of listings offer 3+ bedrooms, catering to larger groups and families seeking more space in Saint-Félicien.
Saint-Félicien Vacation Rental Guest Capacity Trends (2025)
Distribution of Listings by Guest Capacity
Guest Capacity Insights for Saint-Félicien
- The most common guest capacity trend in Saint-Félicien vacation rentals is listings accommodating 4 guests (24%). This suggests the primary traveler segment is likely small families or groups.
- Properties designed for 4 guests and 8+ guests dominate the Saint-Félicien STR market, accounting for 48.0% of listings.
- 40.0% of properties accommodate 6+ guests, serving the market segment for larger families or group travel in Saint-Félicien.
- On average, properties in Saint-Félicien are equipped to host 4.4 guests.
Saint-Félicien Airbnb Booking Patterns (2025): Available vs. Booked Days
Available Days Distribution
Booked Days Distribution
Booking Pattern Insights for Saint-Félicien
- The most common availability pattern in Saint-Félicien falls within the 181-270 days range, representing 44% of listings. This suggests many properties have significant open periods on their calendars.
- Approximately 84.0% of listings show high availability (181+ days open annually), indicating potential for increased bookings or specific owner usage patterns.
- For booked days, the 91-180 days range is most frequent in Saint-Félicien (44%), reflecting common guest stay durations or potential owner blocking patterns.
- A notable 16.0% of properties secure long booking periods (181+ days booked per year), highlighting successful long-term rental strategies or significant owner usage.
Saint-Félicien Airbnb Minimum Stay Requirements Analysis
Distribution of Listings by Minimum Night Requirement
1 Night
5 listings
20% of total
2 Nights
8 listings
32% of total
3 Nights
1 listings
4% of total
7-29 Nights
2 listings
8% of total
30+ Nights
9 listings
36% of total
Key Insights
- The most prevalent minimum stay requirement in Saint-Félicien is 30+ Nights, adopted by 36% of listings. This highlights the market's preference for longer commitments.
- A significant segment (36%) caters to monthly stays (30+ nights) in Saint-Félicien, pointing to opportunities in the extended-stay market.
Recommendations
- Align with the market by considering a 30+ Nights minimum stay, as 36% of Saint-Félicien hosts use this setting.
- If feasible, allowing 1-night stays, especially midweek or during low season, could capture last-minute bookings, as only 20% currently do.
- Explore offering discounts for stays of 30+ nights to attract the 36% of the market seeking extended stays.
- Adjust minimum nights based on seasonality – potentially shorter during low season and longer during peak demand periods in Saint-Félicien.
Saint-Félicien Airbnb Cancellation Policy Trends Analysis (2025)
Super Strict 30 Days
1 listings
4.2% of total
Flexible
6 listings
25% of total
Moderate
6 listings
25% of total
Firm
2 listings
8.3% of total
Strict
9 listings
37.5% of total
Cancellation Policy Insights for Saint-Félicien
- The prevailing Airbnb cancellation policy trend in Saint-Félicien is Strict, used by 37.5% of listings.
- There's a relatively balanced mix between guest-friendly (50.0%) and stricter (45.8%) policies, offering choices for different guest needs.
Recommendations for Hosts
- Consider adopting a Strict policy to align with the 37.5% market standard in Saint-Félicien.
- With 37.5% using Strict terms, this is a viable option in Saint-Félicien, particularly for high-value properties or during peak demand periods.
- Regularly review your cancellation policy against competitors and market demand shifts in Saint-Félicien.
Saint-Félicien STR Booking Lead Time Analysis (2025)
Average Booking Lead Time by Month
Booking Lead Time Insights for Saint-Félicien
- The overall average booking lead time for vacation rentals in Saint-Félicien is 70 days.
- Guests book furthest in advance for stays during July (average 125 days), likely coinciding with peak travel demand or local events.
- The shortest booking windows occur for stays in March (average 29 days), indicating more last-minute travel plans during this time.
- Seasonally, Summer (109 days avg.) sees the longest lead times, while Winter (47 days avg.) has the shortest, reflecting typical travel planning cycles.
Recommendations for Hosts
- Use the overall average lead time (70 days) as a baseline for your pricing and availability strategy in Saint-Félicien.
- For July stays, consider implementing length-of-stay discounts or slightly higher rates for bookings made less than 125 days out to capitalize on advance planning.
- Target marketing efforts for the Summer season well in advance (at least 109 days) to capture early planners.
- Monitor your own booking lead times against these Saint-Félicien averages to identify opportunities for dynamic pricing adjustments.
Popular & Essential Airbnb Amenities in Saint-Félicien (2025)
Amenity Prevalence
Amenity Insights for Saint-Félicien
- Essential amenities in Saint-Félicien that guests expect include: Free parking on premises, Wifi, Smoke alarm, Heating. Lacking these (any) could significantly impact bookings.
- Popular amenities like Hot water, Kitchen, Essentials are common but not universal. Offering these can provide a competitive edge.
Recommendations for Hosts
- Ensure your listing includes all essential amenities for Saint-Félicien: Free parking on premises, Wifi, Smoke alarm, Heating.
- Prioritize adding missing essentials: Heating.
- Consider adding popular differentiators like Hot water or Kitchen to increase appeal.
- Highlight unique or less common amenities you offer (e.g., hot tub, dedicated workspace, EV charger) in your listing description and photos.
- Regularly check competitor amenities in Saint-Félicien to stay competitive.
Saint-Félicien Airbnb Guest Demographics & Profile Analysis (2025)
Guest Profile Summary for Saint-Félicien
- The typical guest profile for Airbnb in Saint-Félicien consists of a mix of domestic (52%) and international guests, often arriving from nearby Montreal, typically belonging to the Post-2000s (Gen Z/Alpha) group (50%), primarily speaking French or English.
- Domestic travelers account for 52.2% of guests.
- Key international markets include Canada (52.2%) and France (39.3%).
- Top languages spoken are French (50.5%) followed by English (38%).
- A significant demographic segment is the Post-2000s (Gen Z/Alpha) group, representing 50% of guests.
Recommendations for Hosts
- Balance marketing efforts between domestic and international channels based on the guest mix.
- Tailor amenities and listing descriptions to appeal to the dominant Post-2000s (Gen Z/Alpha) demographic (e.g., highlight fast WiFi, smart home features, local guides).
- Highlight unique local experiences or amenities relevant to the primary guest profile.
- Consider seasonal promotions aligned with peak travel times for key origin markets.
Nearby Short-Term Rental Market Comparison
How does the Saint-Félicien Airbnb market stack up against its neighbors? Compare key performance metrics like average monthly revenue, ADR, and occupancy rates in surrounding areas to understand the broader regional STR landscape.
| Market | Active Properties | Monthly Revenue | Daily Rate | Avg. Occupancy |
|---|---|---|---|---|
| Sainte-Brigitte-de-Laval | 59 | $2,652 | $185.69 | 49% |
| Hébertville | 11 | $2,476 | $188.05 | 45% |
| Stoneham-et-Tewkesbury | 191 | $2,401 | $331.79 | 32% |
| Roberval | 24 | $2,263 | $138.52 | 60% |
| Saint-Gédéon | 16 | $1,829 | $152.79 | 49% |
| Métabetchouan–Lac-à-la-Croix | 12 | $1,650 | $159.50 | 40% |
| Saint-Henri-de-Taillon | 16 | $1,632 | $149.39 | 45% |
| Péribonka | 10 | $1,588 | $154.02 | 42% |
| Chambord | 19 | $1,526 | $137.51 | 45% |
| Alma | 55 | $1,484 | $121.53 | 52% |