Saint-Ferdinand Airbnb Market Analysis 2025: Short Term Rental Data & Vacation Rental Statistics in Quebec, Canada
Is Airbnb profitable in Saint-Ferdinand in 2025? Explore comprehensive Airbnb analytics for Saint-Ferdinand, Quebec, Canada to uncover income potential. This 2025 STR market report for Saint-Ferdinand, based on AirROI data from April 2024 to March 2025, reveals key trends in the niche market of 17 active listings.
Whether you're considering an Airbnb investment in Saint-Ferdinand, optimizing your existing vacation rental, or exploring rental arbitrage opportunities, understanding the Saint-Ferdinand Airbnb data is crucial. Navigating the high regulation landscape is key to maximizing your short term rental income potential. Let's dive into the specifics.
Key Saint-Ferdinand Airbnb Performance Metrics Overview
Monthly Airbnb Revenue Variations & Income Potential in Saint-Ferdinand (2025)
Understanding the monthly revenue variations for Airbnb listings in Saint-Ferdinand is key to maximizing your short term rental income potential. Seasonality significantly impacts earnings. Our analysis, based on data from the past 12 months, shows that the peak revenue month for STRs in Saint-Ferdinand is typically July, while February often presents the lowest earnings, highlighting opportunities for strategic pricing adjustments during shoulder and low seasons. Explore the typical Airbnb income in Saint-Ferdinand across different performance tiers:
- Best-in-class properties (Top 10%) achieve $5,303+ monthly, often utilizing dynamic pricing and superior guest experiences.
- Strong performing properties (Top 25%) earn $3,908 or more, indicating effective management and desirable locations/amenities.
- Typical properties (Median) generate around $1,991 per month, representing the average market performance.
- Entry-level properties (Bottom 25%) see earnings around $1,016, often with potential for optimization.
Average Monthly Airbnb Earnings Trend in Saint-Ferdinand
Saint-Ferdinand Airbnb Occupancy Rate Trends (2025)
Maximize your bookings by understanding the Saint-Ferdinand STR occupancy trends. Seasonal demand shifts significantly influence how often properties are booked. Typically, Julysees the highest demand (peak season occupancy), while May experiences the lowest (low season). Effective strategies, like adjusting minimum stays or offering promotions, can boost occupancy during slower periods. Here's how different property tiers perform in Saint-Ferdinand:
- Best-in-class properties (Top 10%) achieve 69%+ occupancy, indicating high desirability and potentially optimized availability.
- Strong performing properties (Top 25%) maintain 55% or higher occupancy, suggesting good market fit and guest satisfaction.
- Typical properties (Median) have an occupancy rate around 35%.
- Entry-level properties (Bottom 25%) average 21% occupancy, potentially facing higher vacancy.
Average Monthly Occupancy Rate Trend in Saint-Ferdinand
Average Daily Rate (ADR) Airbnb Trends in Saint-Ferdinand (2025)
Effective short term rental pricing strategy in Saint-Ferdinand involves understanding monthly ADR fluctuations. The Average Daily Rate (ADR) for Airbnb in Saint-Ferdinand typically peaks in August and dips lowest during March. Leveraging Airbnb dynamic pricing tools or strategies based on this seasonality can significantly boost revenue. Here's a look at the typical nightly rates achieved:
- Best-in-class properties (Top 10%) command rates of $291+ per night, often due to premium features or locations.
- Strong performing properties (Top 25%) achieve nightly rates of $245 or more.
- Typical properties (Median) charge around $171 per night.
- Entry-level properties (Bottom 25%) earn around $107 per night.
Average Daily Rate (ADR) Trend by Month in Saint-Ferdinand
Get Live Saint-Ferdinand Market Intelligence 👇

Explore Real-time Analytics
Airbnb Seasonality Analysis & Trends in Saint-Ferdinand (2025)
Peak Season (July, August, June)
- Revenue averages $3,683 per month
- Occupancy rates average 53.6%
- Daily rates average $209
Shoulder Season
- Revenue averages $2,343 per month
- Occupancy maintains around 33.6%
- Daily rates hold near $185
Low Season (February, September, November)
- Revenue drops to average $1,925 per month
- Occupancy decreases to average 36.5%
- Daily rates adjust to average $181
Seasonality Insights for Saint-Ferdinand
- The Airbnb seasonality in Saint-Ferdinand shows highly seasonal trends requiring careful strategy. While the sections above show seasonal averages, it's also insightful to look at the extremes:
- During the high season, the absolute peak month showcases Saint-Ferdinand's highest earning potential, with monthly revenues capable of climbing to $4,153, occupancy reaching a high of 67.7%, and ADRs peaking at $211.
- Conversely, the slowest single month of the year, typically falling within the low season, marks the market's lowest point. In this month, revenue might dip to $1,899, occupancy could drop to 28.0%, and ADRs may adjust down to $165.
- Understanding both the seasonal averages and these monthly peaks and troughs in revenue, occupancy, and ADR is crucial for maximizing your Airbnb profit potential in Saint-Ferdinand.
Seasonal Strategies for Maximizing Profit
- Peak Season: Maximize revenue through premium pricing and potentially longer minimum stays. Ensure high availability.
- Low Season: Offer competitive pricing, special promotions (e.g., extended stay discounts), and flexible cancellation policies. Target off-season travelers like remote workers or budget-conscious guests.
- Shoulder Seasons: Implement dynamic pricing that balances peak and low rates. Target weekend travelers or specific events. Offer slightly more flexible terms than peak season.
- Regularly analyze your own performance against these Saint-Ferdinand seasonality benchmarks and adjust your pricing and availability strategy accordingly.
Best Areas for Airbnb Investment in Saint-Ferdinand (2025)
Exploring the top neighborhoods for short-term rentals in Saint-Ferdinand? This section highlights key areas, outlining why they are attractive for hosts and guests, along with notable local attractions. Consider these locations based on your target guest profile and investment strategy.
| Neighborhood / Area | Why Host Here? (Target Guests & Appeal) | Key Attractions & Landmarks |
|---|---|---|
| Saint-Ferdinand Village | Charming village atmosphere with access to outdoor activities like hiking and fishing. Attracts nature lovers and families looking for a peaceful getaway. | Parc des Chutes de la Petite Rivière Bostonnais, Local artisan shops, Fishing and boating on local lakes, Nature trails, Community events |
| Lac William | A beautiful lake destination perfect for summer and winter activities. Ideal for tourists looking for recreation and relaxation by the water. | Swimming and boating activities, Lac William beach, Hiking trails around the lake, Ice fishing in winter, Local restaurants with lakeside views |
| Montagne du Diable | Stunning mountain views and outdoor sports opportunities make this area popular with adventure seekers and those wanting to experience nature. | Hiking trails, Skiing and snowboarding in winter, Camping, Wildlife observation, Scenic lookout points |
| Saint-Ferdinand Farmer's Market | A local market that showcases the region's food and craft products, attracting both locals and visitors who appreciate fresh produce and handmade goods. | Fresh local produce, Artisan crafts, Food stalls, Live music events, Community gatherings |
| Municipal Beach | A family-friendly beach area offering a range of water sports and leisure activities, making it popular during the summer months. | Swimming, Kayaking, Picnic areas, Playground for children, Beach volleyball |
| Historic Church of Saint-Ferdinand | A culturally significant landmark that attracts visitors interested in history and architecture, adding charm to the local area. | Architectural tours, Local history displays, Community events, Photogenic sites |
| Nature Parks | Various parks in the vicinity provide beautiful natural settings for walking, biking, and enjoying the outdoors, perfect for health-conscious travelers. | Walking and biking trails, Picnic areas, Birdwatching spots, Nature interpretation centers, Outdoor fitness stations |
| Local Festivals | Seasonal festivals celebrate the culture and traditions of the region, attracting tourists and enhancing the community spirit. | Music and arts festivals, Food fairs, Craft workshops, Cultural performances, Local heritage events |
Understanding Airbnb License Requirements & STR Laws in Saint-Ferdinand (2025)
Yes, Saint-Ferdinand, Quebec, Canada enforces high STR regulations. Obtaining a license and ensuring compliance is almost certainly required according to current 2025 STR laws. Always verify the latest short term rental regulations and Airbnb license requirements directly with local government authorities for Saint-Ferdinand to ensure full compliance before hosting.
(Source: AirROI data, 2025, based on 76% licensed listings)
Top Performing Airbnb Properties in Saint-Ferdinand (2025)
Benchmark your potential! Explore examples of top-performing Airbnb properties in Saint-Ferdinandbased on Trailing Twelve Month (TTM) revenue. Analyze their characteristics, revenue, occupancy rate, and ADR to understand what drives success in this market.
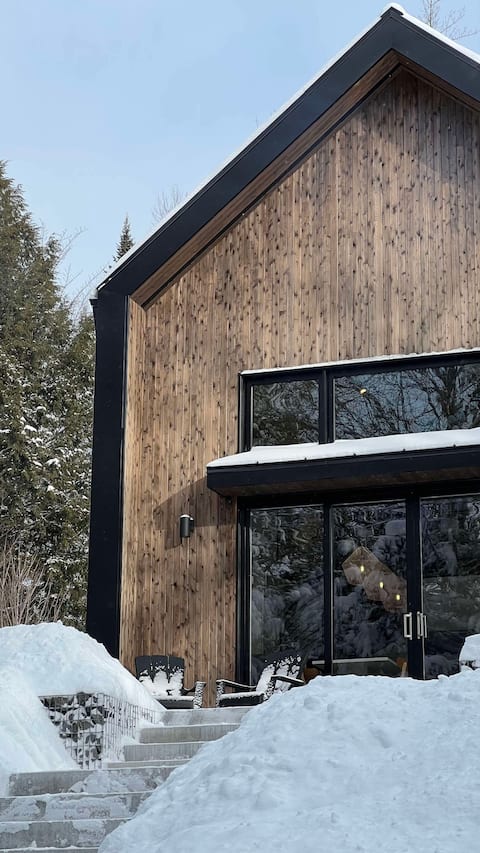
Nature and peace at the edge of the water
Entire Place • 2 bedrooms
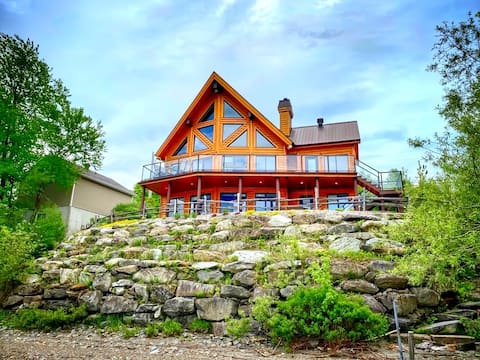
ALPINE - Beautiful cottage by Lake William
Entire Place • 5 bedrooms

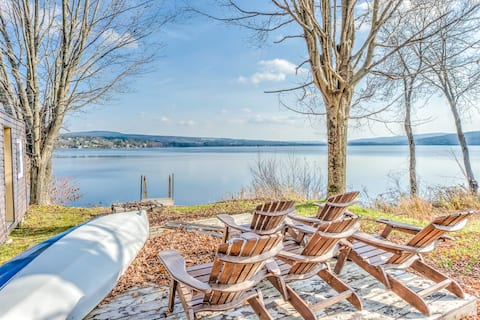
*New* Chalet Lake View and Spa
Entire Place • 5 bedrooms
Le Gingo Shack, Saint-Ferdinand
Entire Place • 4 bedrooms

Sir'Eau d 'Erable
Entire Place • 3 bedrooms

Hillside&Beach with beach and SPA
Entire Place • 2 bedrooms
Note: Performance varies based on location, size, amenities, seasonality, and management quality. Data reflects the past 12 months.
Top Performing Airbnb Hosts in Saint-Ferdinand (2025)
Learn from the best! This table showcases top-performing Airbnb hosts in Saint-Ferdinand based on the number of properties managed and estimated total revenue over the past year. Analyze their scale and performance metrics.
| Host Name | Properties | Grossing Revenue | Stay Reviews | Avg Rating |
|---|---|---|---|---|
| Kim | 2 | $76,761 | 216 | 4.89/5.0 |
| Sarah | 1 | $65,779 | 15 | 5.00/5.0 |
| Virginie Et Julien | 1 | $54,929 | 125 | 4.90/5.0 |
| ChaletsConfort | 1 | $42,340 | 11 | 4.55/5.0 |
| Stéphanie | 1 | $37,003 | 49 | 4.92/5.0 |
| Chalets Garou | 2 | $29,871 | 86 | 4.88/5.0 |
| Marie Soleil | 1 | $28,195 | 5 | 5.00/5.0 |
| Host #398980083 | 1 | $21,884 | 46 | 5.00/5.0 |
| Host #110951437 | 1 | $18,860 | 33 | 5.00/5.0 |
| Joel | 1 | $13,399 | 111 | 4.93/5.0 |
Analyzing the strategies of top hosts, such as their property selection, pricing, and guest communication, can offer valuable lessons for optimizing your own Airbnb operations in Saint-Ferdinand.
Dive Deeper: Advanced Saint-Ferdinand STR Market Data (2025)
Ready to unlock more insights? AirROI provides access to advanced metrics and comprehensive Airbnb data for Saint-Ferdinand. Explore detailed analytics beyond this report to refine your investment strategy, optimize pricing, and maximize your vacation rental profits.
Explore Advanced MetricsSaint-Ferdinand Short-Term Rental Market Composition (2025): Property & Room Types
Room Type Distribution
Property Type Distribution
Market Composition Insights for Saint-Ferdinand
- The Saint-Ferdinand Airbnb market composition is heavily skewed towards Entire Home/Apt listings, which make up 94.1% of the 17 active rentals. This indicates strong guest preference for privacy and space.
- Looking at the property type distribution in Saint-Ferdinand, House properties are the most common (88.2%), reflecting the local real estate landscape.
- Houses represent a significant 88.2% portion, catering likely to families or larger groups.
Saint-Ferdinand Airbnb Room Capacity Analysis (2025): Bedroom Distribution
Distribution of Listings by Number of Bedrooms
Room Capacity Insights for Saint-Ferdinand
- The dominant room capacity in Saint-Ferdinand is 3 bedrooms listings, making up 35.3% of the market. This suggests a strong demand for properties suitable for families or small groups.
- Together, 3 bedrooms and 2 bedrooms properties represent 52.9% of the active Airbnb listings in Saint-Ferdinand, indicating a high concentration in these sizes.
- A significant 64.7% of listings offer 3+ bedrooms, catering to larger groups and families seeking more space in Saint-Ferdinand.
Saint-Ferdinand Vacation Rental Guest Capacity Trends (2025)
Distribution of Listings by Guest Capacity
Guest Capacity Insights for Saint-Ferdinand
- The most common guest capacity trend in Saint-Ferdinand vacation rentals is listings accommodating 8+ guests (58.8%). This suggests the primary traveler segment is likely larger groups.
- Properties designed for 8+ guests and 4 guests dominate the Saint-Ferdinand STR market, accounting for 70.6% of listings.
- 76.5% of properties accommodate 6+ guests, serving the market segment for larger families or group travel in Saint-Ferdinand.
- On average, properties in Saint-Ferdinand are equipped to host 6.4 guests.
Saint-Ferdinand Airbnb Booking Patterns (2025): Available vs. Booked Days
Available Days Distribution
Booked Days Distribution
Booking Pattern Insights for Saint-Ferdinand
- The most common availability pattern in Saint-Ferdinand falls within the 181-270 days range, representing 41.2% of listings. This suggests many properties have significant open periods on their calendars.
- Approximately 76.5% of listings show high availability (181+ days open annually), indicating potential for increased bookings or specific owner usage patterns.
- For booked days, the 91-180 days range is most frequent in Saint-Ferdinand (41.2%), reflecting common guest stay durations or potential owner blocking patterns.
- A notable 23.5% of properties secure long booking periods (181+ days booked per year), highlighting successful long-term rental strategies or significant owner usage.
Saint-Ferdinand Airbnb Minimum Stay Requirements Analysis
Distribution of Listings by Minimum Night Requirement
1 Night
1 listings
7.1% of total
2 Nights
7 listings
50% of total
3 Nights
1 listings
7.1% of total
7-29 Nights
2 listings
14.3% of total
30+ Nights
3 listings
21.4% of total
Key Insights
- The most prevalent minimum stay requirement in Saint-Ferdinand is 2 Nights, adopted by 50% of listings. This highlights the market's preference for shorter, flexible bookings.
- A significant segment (21.4%) caters to monthly stays (30+ nights) in Saint-Ferdinand, pointing to opportunities in the extended-stay market.
Recommendations
- Align with the market by considering a 2 Nights minimum stay, as 50% of Saint-Ferdinand hosts use this setting.
- If feasible, allowing 1-night stays, especially midweek or during low season, could capture last-minute bookings, as only 7.1% currently do.
- A 2-night minimum appears standard (50%). Consider this for weekends or peak periods.
- Explore offering discounts for stays of 30+ nights to attract the 21.4% of the market seeking extended stays.
- Adjust minimum nights based on seasonality – potentially shorter during low season and longer during peak demand periods in Saint-Ferdinand.
Saint-Ferdinand Airbnb Cancellation Policy Trends Analysis (2025)
Super Strict 30 Days
1 listings
6.7% of total
Flexible
2 listings
13.3% of total
Firm
3 listings
20% of total
Strict
9 listings
60% of total
Cancellation Policy Insights for Saint-Ferdinand
- The prevailing Airbnb cancellation policy trend in Saint-Ferdinand is Strict, used by 60% of listings.
- A majority (80.0%) of hosts in Saint-Ferdinand utilize Firm or Strict policies, indicating a market where hosts prioritize booking security.
Recommendations for Hosts
- Consider adopting a Strict policy to align with the 60% market standard in Saint-Ferdinand.
- With 60% using Strict terms, this is a viable option in Saint-Ferdinand, particularly for high-value properties or during peak demand periods.
- Regularly review your cancellation policy against competitors and market demand shifts in Saint-Ferdinand.
Saint-Ferdinand STR Booking Lead Time Analysis (2025)
Average Booking Lead Time by Month
Booking Lead Time Insights for Saint-Ferdinand
- The overall average booking lead time for vacation rentals in Saint-Ferdinand is 60 days.
- Guests book furthest in advance for stays during May (average 108 days), likely coinciding with peak travel demand or local events.
- The shortest booking windows occur for stays in September (average 30 days), indicating more last-minute travel plans during this time.
- Seasonally, Summer (83 days avg.) sees the longest lead times, while Fall (42 days avg.) has the shortest, reflecting typical travel planning cycles.
Recommendations for Hosts
- Use the overall average lead time (60 days) as a baseline for your pricing and availability strategy in Saint-Ferdinand.
- For May stays, consider implementing length-of-stay discounts or slightly higher rates for bookings made less than 108 days out to capitalize on advance planning.
- Target marketing efforts for the Summer season well in advance (at least 83 days) to capture early planners.
- Monitor your own booking lead times against these Saint-Ferdinand averages to identify opportunities for dynamic pricing adjustments.
Popular & Essential Airbnb Amenities in Saint-Ferdinand (2025)
Amenity Prevalence
No amenities with partial availability (less than 100%) were found to display in the chart. All essential amenities might be present in all listings. Check insights below.
Amenity Insights for Saint-Ferdinand
- Essential amenities in Saint-Ferdinand that guests expect include: Coffee maker, Smoke alarm, Essentials, Bed linens, Oven, Cooking basics, Refrigerator, TV, Dishes and silverware, Microwave. Lacking these (any) could significantly impact bookings.
Recommendations for Hosts
- Ensure your listing includes all essential amenities for Saint-Ferdinand: Coffee maker, Smoke alarm, Essentials, Bed linens, Oven, Cooking basics, Refrigerator, TV, Dishes and silverware, Microwave.
- Highlight unique or less common amenities you offer (e.g., hot tub, dedicated workspace, EV charger) in your listing description and photos.
- Regularly check competitor amenities in Saint-Ferdinand to stay competitive.
Saint-Ferdinand Airbnb Guest Demographics & Profile Analysis (2025)
Guest Profile Summary for Saint-Ferdinand
- The typical guest profile for Airbnb in Saint-Ferdinand consists of primarily domestic travelers (86%), often arriving from nearby Montreal, typically belonging to the Post-2000s (Gen Z/Alpha) group (50%), primarily speaking French or English.
- Domestic travelers account for 86.4% of guests.
- Key international markets include Canada (86.4%) and United States (7.1%).
- Top languages spoken are French (50.7%) followed by English (33.8%).
- A significant demographic segment is the Post-2000s (Gen Z/Alpha) group, representing 50% of guests.
Recommendations for Hosts
- Target domestic marketing efforts towards travelers from Montreal and Quebec City.
- Tailor amenities and listing descriptions to appeal to the dominant Post-2000s (Gen Z/Alpha) demographic (e.g., highlight fast WiFi, smart home features, local guides).
- Highlight unique local experiences or amenities relevant to the primary guest profile.
- Consider seasonal promotions aligned with peak travel times for key origin markets.
Nearby Short-Term Rental Market Comparison
How does the Saint-Ferdinand Airbnb market stack up against its neighbors? Compare key performance metrics like average monthly revenue, ADR, and occupancy rates in surrounding areas to understand the broader regional STR landscape.
| Market | Active Properties | Monthly Revenue | Daily Rate | Avg. Occupancy |
|---|---|---|---|---|
| Saint-Denis-de-Brompton | 28 | $4,459 | $383.13 | 34% |
| Waterloo | 11 | $4,092 | $357.06 | 37% |
| Shannon | 25 | $3,918 | $240.28 | 51% |
| Shefford | 26 | $3,538 | $254.63 | 43% |
| Lac-Beauport | 56 | $3,512 | $213.74 | 52% |
| Stanstead (Canton) | 40 | $3,462 | $234.29 | 46% |
| Saint-François-de-l'Île-d'Orléans | 12 | $3,291 | $336.24 | 39% |
| Saint-Basile | 12 | $3,221 | $180.24 | 52% |
| Les Éboulements | 137 | $3,141 | $227.50 | 42% |
| Saint-Roch-de-Mékinac | 11 | $3,108 | $314.58 | 41% |