Saint-Denis-de-Brompton Airbnb Market Analysis 2025: Short Term Rental Data & Vacation Rental Statistics in Quebec, Canada
Is Airbnb profitable in Saint-Denis-de-Brompton in 2025? Explore comprehensive Airbnb analytics for Saint-Denis-de-Brompton, Quebec, Canada to uncover income potential. This 2025 STR market report for Saint-Denis-de-Brompton, based on AirROI data from April 2024 to March 2025, reveals key trends in the niche market of 28 active listings.
Whether you're considering an Airbnb investment in Saint-Denis-de-Brompton, optimizing your existing vacation rental, or exploring rental arbitrage opportunities, understanding the Saint-Denis-de-Brompton Airbnb data is crucial. Navigating the high regulation landscape is key to maximizing your short term rental income potential. Let's dive into the specifics.
Key Saint-Denis-de-Brompton Airbnb Performance Metrics Overview
Monthly Airbnb Revenue Variations & Income Potential in Saint-Denis-de-Brompton (2025)
Understanding the monthly revenue variations for Airbnb listings in Saint-Denis-de-Brompton is key to maximizing your short term rental income potential. Seasonality significantly impacts earnings. Our analysis, based on data from the past 12 months, shows that the peak revenue month for STRs in Saint-Denis-de-Brompton is typically June, while November often presents the lowest earnings, highlighting opportunities for strategic pricing adjustments during shoulder and low seasons. Explore the typical Airbnb income in Saint-Denis-de-Brompton across different performance tiers:
- Best-in-class properties (Top 10%) achieve $15,806+ monthly, often utilizing dynamic pricing and superior guest experiences.
- Strong performing properties (Top 25%) earn $8,083 or more, indicating effective management and desirable locations/amenities.
- Typical properties (Median) generate around $4,210 per month, representing the average market performance.
- Entry-level properties (Bottom 25%) see earnings around $1,744, often with potential for optimization.
Average Monthly Airbnb Earnings Trend in Saint-Denis-de-Brompton
Saint-Denis-de-Brompton Airbnb Occupancy Rate Trends (2025)
Maximize your bookings by understanding the Saint-Denis-de-Brompton STR occupancy trends. Seasonal demand shifts significantly influence how often properties are booked. Typically, Augustsees the highest demand (peak season occupancy), while January experiences the lowest (low season). Effective strategies, like adjusting minimum stays or offering promotions, can boost occupancy during slower periods. Here's how different property tiers perform in Saint-Denis-de-Brompton:
- Best-in-class properties (Top 10%) achieve 67%+ occupancy, indicating high desirability and potentially optimized availability.
- Strong performing properties (Top 25%) maintain 51% or higher occupancy, suggesting good market fit and guest satisfaction.
- Typical properties (Median) have an occupancy rate around 29%.
- Entry-level properties (Bottom 25%) average 18% occupancy, potentially facing higher vacancy.
Average Monthly Occupancy Rate Trend in Saint-Denis-de-Brompton
Average Daily Rate (ADR) Airbnb Trends in Saint-Denis-de-Brompton (2025)
Effective short term rental pricing strategy in Saint-Denis-de-Brompton involves understanding monthly ADR fluctuations. The Average Daily Rate (ADR) for Airbnb in Saint-Denis-de-Brompton typically peaks in July and dips lowest during March. Leveraging Airbnb dynamic pricing tools or strategies based on this seasonality can significantly boost revenue. Here's a look at the typical nightly rates achieved:
- Best-in-class properties (Top 10%) command rates of $858+ per night, often due to premium features or locations.
- Strong performing properties (Top 25%) achieve nightly rates of $498 or more.
- Typical properties (Median) charge around $219 per night.
- Entry-level properties (Bottom 25%) earn around $125 per night.
Average Daily Rate (ADR) Trend by Month in Saint-Denis-de-Brompton
Get Live Saint-Denis-de-Brompton Market Intelligence 👇

Explore Real-time Analytics
Airbnb Seasonality Analysis & Trends in Saint-Denis-de-Brompton (2025)
Peak Season (June, May, April)
- Revenue averages $9,472 per month
- Occupancy rates average 40.0%
- Daily rates average $363
Shoulder Season
- Revenue averages $5,482 per month
- Occupancy maintains around 38.0%
- Daily rates hold near $366
Low Season (March, October, November)
- Revenue drops to average $3,352 per month
- Occupancy decreases to average 27.4%
- Daily rates adjust to average $341
Seasonality Insights for Saint-Denis-de-Brompton
- The Airbnb seasonality in Saint-Denis-de-Brompton shows highly seasonal trends requiring careful strategy. While the sections above show seasonal averages, it's also insightful to look at the extremes:
- During the high season, the absolute peak month showcases Saint-Denis-de-Brompton's highest earning potential, with monthly revenues capable of climbing to $10,704, occupancy reaching a high of 53.0%, and ADRs peaking at $391.
- Conversely, the slowest single month of the year, typically falling within the low season, marks the market's lowest point. In this month, revenue might dip to $3,229, occupancy could drop to 27.1%, and ADRs may adjust down to $328.
- Understanding both the seasonal averages and these monthly peaks and troughs in revenue, occupancy, and ADR is crucial for maximizing your Airbnb profit potential in Saint-Denis-de-Brompton.
Seasonal Strategies for Maximizing Profit
- Peak Season: Maximize revenue through premium pricing and potentially longer minimum stays. Ensure high availability.
- Low Season: Offer competitive pricing, special promotions (e.g., extended stay discounts), and flexible cancellation policies. Target off-season travelers like remote workers or budget-conscious guests.
- Shoulder Seasons: Implement dynamic pricing that balances peak and low rates. Target weekend travelers or specific events. Offer slightly more flexible terms than peak season.
- Regularly analyze your own performance against these Saint-Denis-de-Brompton seasonality benchmarks and adjust your pricing and availability strategy accordingly.
Best Areas for Airbnb Investment in Saint-Denis-de-Brompton (2025)
Exploring the top neighborhoods for short-term rentals in Saint-Denis-de-Brompton? This section highlights key areas, outlining why they are attractive for hosts and guests, along with notable local attractions. Consider these locations based on your target guest profile and investment strategy.
| Neighborhood / Area | Why Host Here? (Target Guests & Appeal) | Key Attractions & Landmarks |
|---|---|---|
| Lake Magog | A beautiful lake area known for its stunning views and outdoor activities. Great for guests looking for a relaxing lakeside vacation with access to water sports and hiking. | Lake Magog, Parc de la Gatineau, Mont Brompton, Kayaking and paddleboarding, Hiking trails |
| Parc National du Mont-Orford | A popular national park featuring mountains, lakes, and extensive hiking trails. Ideal for those who enjoy nature and outdoor adventures all year round. | Mont-Orford Peak, Lake Fraser, Hiking and biking trails, Ski resorts, Picnic areas |
| Golf de la Vallée de La Rouge | A scenic golf course area that attracts golf enthusiasts and travelers looking for relaxation and recreational activities. | Golf course, Lush green landscapes, Clubhouse dining, Outdoor events, Nature walks |
| Saint-Denis Village | A charming village atmosphere with local shops and cafes. A peaceful spot for those wishing to experience the local lifestyle. | Local cafés, Artisan shops, Community events, Natural landscapes, Family-friendly parks |
| Les Jardins de l'Utopie | A unique garden area known for its vibrant flora and relaxation spaces, appealing to nature lovers and those seeking tranquility. | Botanical gardens, Scenic walking paths, Community gardening events, Workshops, Nature retreats |
| Montée des Érables | A rural area with picturesque views and a strong sense of community, perfect for those seeking a serene getaway. | Scenic views, Hiking trails, Fall foliage, Local farm visits, Community markets |
| Centrale de Brompton | This central location offers easy access to local amenities and is great for those looking to experience the cultural aspects of Saint-Denis-de-Brompton. | Cultural events, Local markets, Dining options, Accessibility to main roads, Festivals and fairs |
| Chemin de la Rivière | A peaceful riverside area ideal for those seeking relaxation and outdoor activities such as fishing and hiking. | River access, Fishing spots, Nature trails, Picnic areas, Wildlife watching |
Understanding Airbnb License Requirements & STR Laws in Saint-Denis-de-Brompton (2025)
Yes, Saint-Denis-de-Brompton, Quebec, Canada enforces high STR regulations. Obtaining a license and ensuring compliance is almost certainly required according to current 2025 STR laws. Always verify the latest short term rental regulations and Airbnb license requirements directly with local government authorities for Saint-Denis-de-Brompton to ensure full compliance before hosting.
(Source: AirROI data, 2025, based on 82% licensed listings)
Top Performing Airbnb Properties in Saint-Denis-de-Brompton (2025)
Benchmark your potential! Explore examples of top-performing Airbnb properties in Saint-Denis-de-Bromptonbased on Trailing Twelve Month (TTM) revenue. Analyze their characteristics, revenue, occupancy rate, and ADR to understand what drives success in this market.
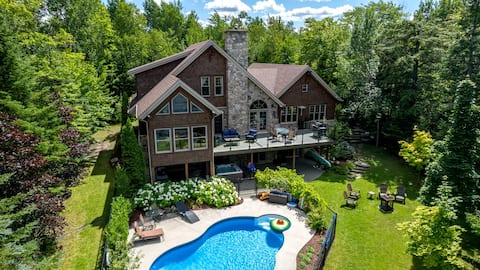
*Villa du Grand Lac * ON LAKE BROMPTON, SPA, BEACH
Entire Place • 7 bedrooms
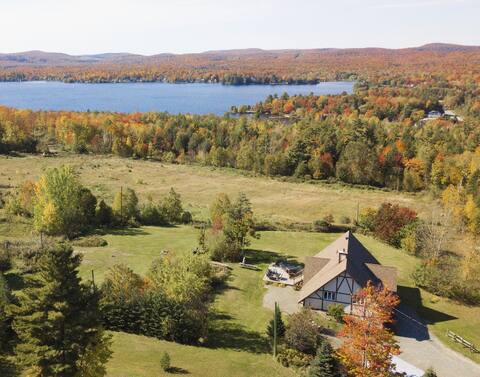
Chalet Domaine - 26 people
Entire Place • 6 bedrooms
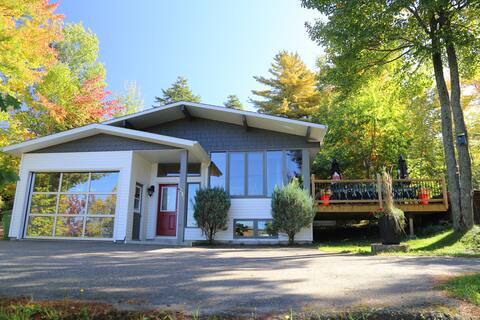
Chalet Robert - 22 people
Entire Place • 8 bedrooms
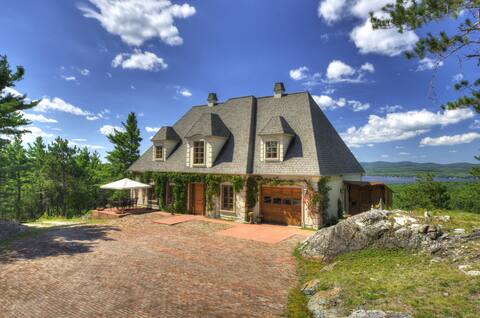
Le Domaine 360 -spa and sauna- 33 people
Entire Place • 8 bedrooms

Le Maritime sur le lac et spa -28p.
Entire Place • 8 bedrooms

Chalet "Le Rassembleur"
Entire Place • 5 bedrooms
Note: Performance varies based on location, size, amenities, seasonality, and management quality. Data reflects the past 12 months.
Top Performing Airbnb Hosts in Saint-Denis-de-Brompton (2025)
Learn from the best! This table showcases top-performing Airbnb hosts in Saint-Denis-de-Brompton based on the number of properties managed and estimated total revenue over the past year. Analyze their scale and performance metrics.
| Host Name | Properties | Grossing Revenue | Stay Reviews | Avg Rating |
|---|---|---|---|---|
| Domaine Lac Brompton | 7 | $672,400 | 43 | 4.96/5.0 |
| Gabrielle | 3 | $223,741 | 233 | 4.67/5.0 |
| Yanick & Claudia | 1 | $201,631 | 129 | 4.95/5.0 |
| Louis-Philip | 1 | $83,340 | 44 | 4.68/5.0 |
| Nancy | 1 | $69,235 | 124 | 4.73/5.0 |
| Yannick De Flex Immobilier | 1 | $61,232 | 45 | 4.93/5.0 |
| Jean-Sebastien | 1 | $47,176 | 140 | 4.89/5.0 |
| Host #488111335 | 1 | $37,797 | 0 | 0.00/5.0 |
| Michelle | 1 | $34,289 | 197 | 4.84/5.0 |
| Josianne | 4 | $16,833 | 160 | 4.58/5.0 |
Analyzing the strategies of top hosts, such as their property selection, pricing, and guest communication, can offer valuable lessons for optimizing your own Airbnb operations in Saint-Denis-de-Brompton.
Dive Deeper: Advanced Saint-Denis-de-Brompton STR Market Data (2025)
Ready to unlock more insights? AirROI provides access to advanced metrics and comprehensive Airbnb data for Saint-Denis-de-Brompton. Explore detailed analytics beyond this report to refine your investment strategy, optimize pricing, and maximize your vacation rental profits.
Explore Advanced MetricsSaint-Denis-de-Brompton Short-Term Rental Market Composition (2025): Property & Room Types
Room Type Distribution
Property Type Distribution
Market Composition Insights for Saint-Denis-de-Brompton
- The Saint-Denis-de-Brompton Airbnb market composition is heavily skewed towards Entire Home/Apt listings, which make up 96.4% of the 28 active rentals. This indicates strong guest preference for privacy and space.
- Looking at the property type distribution in Saint-Denis-de-Brompton, House properties are the most common (89.3%), reflecting the local real estate landscape.
- Houses represent a significant 89.3% portion, catering likely to families or larger groups.
- Smaller segments like hotel/boutique (combined 3.6%) offer potential for unique stay experiences.
Saint-Denis-de-Brompton Airbnb Room Capacity Analysis (2025): Bedroom Distribution
Distribution of Listings by Number of Bedrooms
Room Capacity Insights for Saint-Denis-de-Brompton
- The dominant room capacity in Saint-Denis-de-Brompton is 5+ bedrooms listings, making up 32.1% of the market. This suggests a strong demand for properties suitable for families or small groups.
- Together, 5+ bedrooms and 3 bedrooms properties represent 57.1% of the active Airbnb listings in Saint-Denis-de-Brompton, indicating a high concentration in these sizes.
- A significant 67.8% of listings offer 3+ bedrooms, catering to larger groups and families seeking more space in Saint-Denis-de-Brompton.
Saint-Denis-de-Brompton Vacation Rental Guest Capacity Trends (2025)
Distribution of Listings by Guest Capacity
Guest Capacity Insights for Saint-Denis-de-Brompton
- The most common guest capacity trend in Saint-Denis-de-Brompton vacation rentals is listings accommodating 8+ guests (60.7%). This suggests the primary traveler segment is likely larger groups.
- Properties designed for 8+ guests and 4 guests dominate the Saint-Denis-de-Brompton STR market, accounting for 82.1% of listings.
- 78.6% of properties accommodate 6+ guests, serving the market segment for larger families or group travel in Saint-Denis-de-Brompton.
- On average, properties in Saint-Denis-de-Brompton are equipped to host 6.8 guests.
Saint-Denis-de-Brompton Airbnb Booking Patterns (2025): Available vs. Booked Days
Available Days Distribution
Booked Days Distribution
Booking Pattern Insights for Saint-Denis-de-Brompton
- The most common availability pattern in Saint-Denis-de-Brompton falls within the 271-366 days range, representing 46.4% of listings. This suggests many properties have significant open periods on their calendars.
- Approximately 78.5% of listings show high availability (181+ days open annually), indicating potential for increased bookings or specific owner usage patterns.
- For booked days, the 91-180 days range is most frequent in Saint-Denis-de-Brompton (39.3%), reflecting common guest stay durations or potential owner blocking patterns.
- A notable 21.4% of properties secure long booking periods (181+ days booked per year), highlighting successful long-term rental strategies or significant owner usage.
Saint-Denis-de-Brompton Airbnb Minimum Stay Requirements Analysis
Distribution of Listings by Minimum Night Requirement
1 Night
2 listings
7.1% of total
2 Nights
14 listings
50% of total
7-29 Nights
4 listings
14.3% of total
30+ Nights
8 listings
28.6% of total
Key Insights
- The most prevalent minimum stay requirement in Saint-Denis-de-Brompton is 2 Nights, adopted by 50% of listings. This highlights the market's preference for shorter, flexible bookings.
- A significant segment (28.6%) caters to monthly stays (30+ nights) in Saint-Denis-de-Brompton, pointing to opportunities in the extended-stay market.
Recommendations
- Align with the market by considering a 2 Nights minimum stay, as 50% of Saint-Denis-de-Brompton hosts use this setting.
- If feasible, allowing 1-night stays, especially midweek or during low season, could capture last-minute bookings, as only 7.1% currently do.
- A 2-night minimum appears standard (50%). Consider this for weekends or peak periods.
- Explore offering discounts for stays of 30+ nights to attract the 28.6% of the market seeking extended stays.
- Adjust minimum nights based on seasonality – potentially shorter during low season and longer during peak demand periods in Saint-Denis-de-Brompton.
Saint-Denis-de-Brompton Airbnb Cancellation Policy Trends Analysis (2025)
Super Strict 30 Days
1 listings
4% of total
Flexible
3 listings
12% of total
Moderate
2 listings
8% of total
Firm
6 listings
24% of total
Strict
13 listings
52% of total
Cancellation Policy Insights for Saint-Denis-de-Brompton
- The prevailing Airbnb cancellation policy trend in Saint-Denis-de-Brompton is Strict, used by 52% of listings.
- A majority (76.0%) of hosts in Saint-Denis-de-Brompton utilize Firm or Strict policies, indicating a market where hosts prioritize booking security.
Recommendations for Hosts
- Consider adopting a Strict policy to align with the 52% market standard in Saint-Denis-de-Brompton.
- With 52% using Strict terms, this is a viable option in Saint-Denis-de-Brompton, particularly for high-value properties or during peak demand periods.
- Regularly review your cancellation policy against competitors and market demand shifts in Saint-Denis-de-Brompton.
Saint-Denis-de-Brompton STR Booking Lead Time Analysis (2025)
Average Booking Lead Time by Month
Booking Lead Time Insights for Saint-Denis-de-Brompton
- The overall average booking lead time for vacation rentals in Saint-Denis-de-Brompton is 51 days.
- Guests book furthest in advance for stays during July (average 108 days), likely coinciding with peak travel demand or local events.
- The shortest booking windows occur for stays in March (average 31 days), indicating more last-minute travel plans during this time.
- Seasonally, Summer (79 days avg.) sees the longest lead times, while Fall (42 days avg.) has the shortest, reflecting typical travel planning cycles.
Recommendations for Hosts
- Use the overall average lead time (51 days) as a baseline for your pricing and availability strategy in Saint-Denis-de-Brompton.
- For July stays, consider implementing length-of-stay discounts or slightly higher rates for bookings made less than 108 days out to capitalize on advance planning.
- Target marketing efforts for the Summer season well in advance (at least 79 days) to capture early planners.
- Monitor your own booking lead times against these Saint-Denis-de-Brompton averages to identify opportunities for dynamic pricing adjustments.
Popular & Essential Airbnb Amenities in Saint-Denis-de-Brompton (2025)
Amenity Prevalence
Amenity Insights for Saint-Denis-de-Brompton
- Essential amenities in Saint-Denis-de-Brompton that guests expect include: Wifi, TV, Free parking on premises, Kitchen, Heating, Smoke alarm. Lacking these (any) could significantly impact bookings.
- Popular amenities like Outdoor dining area, Coffee maker, Dishes and silverware are common but not universal. Offering these can provide a competitive edge.
Recommendations for Hosts
- Ensure your listing includes all essential amenities for Saint-Denis-de-Brompton: Wifi, TV, Free parking on premises, Kitchen, Heating, Smoke alarm.
- Prioritize adding missing essentials: Kitchen, Heating, Smoke alarm.
- Consider adding popular differentiators like Outdoor dining area or Coffee maker to increase appeal.
- Highlight unique or less common amenities you offer (e.g., hot tub, dedicated workspace, EV charger) in your listing description and photos.
- Regularly check competitor amenities in Saint-Denis-de-Brompton to stay competitive.
Saint-Denis-de-Brompton Airbnb Guest Demographics & Profile Analysis (2025)
Guest Profile Summary for Saint-Denis-de-Brompton
- The typical guest profile for Airbnb in Saint-Denis-de-Brompton consists of primarily domestic travelers (76%), often arriving from nearby Montreal, typically belonging to the Post-2000s (Gen Z/Alpha) group (50%), primarily speaking English or French.
- Domestic travelers account for 76.4% of guests.
- Key international markets include Canada (76.4%) and United States (14.9%).
- Top languages spoken are English (44%) followed by French (39.8%).
- A significant demographic segment is the Post-2000s (Gen Z/Alpha) group, representing 50% of guests.
Recommendations for Hosts
- Target domestic marketing efforts towards travelers from Montreal and Sherbrooke.
- Tailor amenities and listing descriptions to appeal to the dominant Post-2000s (Gen Z/Alpha) demographic (e.g., highlight fast WiFi, smart home features, local guides).
- Highlight unique local experiences or amenities relevant to the primary guest profile.
- Consider seasonal promotions aligned with peak travel times for key origin markets.
Nearby Short-Term Rental Market Comparison
How does the Saint-Denis-de-Brompton Airbnb market stack up against its neighbors? Compare key performance metrics like average monthly revenue, ADR, and occupancy rates in surrounding areas to understand the broader regional STR landscape.
| Market | Active Properties | Monthly Revenue | Daily Rate | Avg. Occupancy |
|---|---|---|---|---|
| Jefferson | 28 | $5,920 | $432.83 | 50% |
| Malletts Bay | 49 | $4,960 | $414.58 | 48% |
| Stowe | 842 | $4,757 | $474.92 | 41% |
| Wilmington | 130 | $4,484 | $324.06 | 45% |
| Dalton | 13 | $4,397 | $359.89 | 45% |
| Calais | 16 | $4,320 | $299.79 | 49% |
| Middlebury | 52 | $4,128 | $288.39 | 54% |
| Waterloo | 11 | $4,092 | $357.06 | 37% |
| Topsham | 13 | $3,952 | $265.51 | 50% |
| Jericho | 23 | $3,945 | $309.71 | 54% |