Saint-Alphonse-Rodriguez Airbnb Market Analysis 2025: Short Term Rental Data & Vacation Rental Statistics in Quebec, Canada
Is Airbnb profitable in Saint-Alphonse-Rodriguez in 2025? Explore comprehensive Airbnb analytics for Saint-Alphonse-Rodriguez, Quebec, Canada to uncover income potential. This 2025 STR market report for Saint-Alphonse-Rodriguez, based on AirROI data from April 2024 to March 2025, reveals key trends in the niche market of 36 active listings.
Whether you're considering an Airbnb investment in Saint-Alphonse-Rodriguez, optimizing your existing vacation rental, or exploring rental arbitrage opportunities, understanding the Saint-Alphonse-Rodriguez Airbnb data is crucial. Navigating the high regulation landscape is key to maximizing your short term rental income potential. Let's dive into the specifics.
Key Saint-Alphonse-Rodriguez Airbnb Performance Metrics Overview
Monthly Airbnb Revenue Variations & Income Potential in Saint-Alphonse-Rodriguez (2025)
Understanding the monthly revenue variations for Airbnb listings in Saint-Alphonse-Rodriguez is key to maximizing your short term rental income potential. Seasonality significantly impacts earnings. Our analysis, based on data from the past 12 months, shows that the peak revenue month for STRs in Saint-Alphonse-Rodriguez is typically July, while November often presents the lowest earnings, highlighting opportunities for strategic pricing adjustments during shoulder and low seasons. Explore the typical Airbnb income in Saint-Alphonse-Rodriguez across different performance tiers:
- Best-in-class properties (Top 10%) achieve $5,433+ monthly, often utilizing dynamic pricing and superior guest experiences.
- Strong performing properties (Top 25%) earn $4,228 or more, indicating effective management and desirable locations/amenities.
- Typical properties (Median) generate around $2,648 per month, representing the average market performance.
- Entry-level properties (Bottom 25%) see earnings around $1,578, often with potential for optimization.
Average Monthly Airbnb Earnings Trend in Saint-Alphonse-Rodriguez
Saint-Alphonse-Rodriguez Airbnb Occupancy Rate Trends (2025)
Maximize your bookings by understanding the Saint-Alphonse-Rodriguez STR occupancy trends. Seasonal demand shifts significantly influence how often properties are booked. Typically, Julysees the highest demand (peak season occupancy), while April experiences the lowest (low season). Effective strategies, like adjusting minimum stays or offering promotions, can boost occupancy during slower periods. Here's how different property tiers perform in Saint-Alphonse-Rodriguez:
- Best-in-class properties (Top 10%) achieve 76%+ occupancy, indicating high desirability and potentially optimized availability.
- Strong performing properties (Top 25%) maintain 61% or higher occupancy, suggesting good market fit and guest satisfaction.
- Typical properties (Median) have an occupancy rate around 44%.
- Entry-level properties (Bottom 25%) average 25% occupancy, potentially facing higher vacancy.
Average Monthly Occupancy Rate Trend in Saint-Alphonse-Rodriguez
Average Daily Rate (ADR) Airbnb Trends in Saint-Alphonse-Rodriguez (2025)
Effective short term rental pricing strategy in Saint-Alphonse-Rodriguez involves understanding monthly ADR fluctuations. The Average Daily Rate (ADR) for Airbnb in Saint-Alphonse-Rodriguez typically peaks in December and dips lowest during November. Leveraging Airbnb dynamic pricing tools or strategies based on this seasonality can significantly boost revenue. Here's a look at the typical nightly rates achieved:
- Best-in-class properties (Top 10%) command rates of $289+ per night, often due to premium features or locations.
- Strong performing properties (Top 25%) achieve nightly rates of $220 or more.
- Typical properties (Median) charge around $170 per night.
- Entry-level properties (Bottom 25%) earn around $124 per night.
Average Daily Rate (ADR) Trend by Month in Saint-Alphonse-Rodriguez
Get Live Saint-Alphonse-Rodriguez Market Intelligence 👇

Explore Real-time Analytics
Airbnb Seasonality Analysis & Trends in Saint-Alphonse-Rodriguez (2025)
Peak Season (July, December, June)
- Revenue averages $3,944 per month
- Occupancy rates average 51.9%
- Daily rates average $191
Shoulder Season
- Revenue averages $3,077 per month
- Occupancy maintains around 43.6%
- Daily rates hold near $176
Low Season (September, October, November)
- Revenue drops to average $2,055 per month
- Occupancy decreases to average 39.3%
- Daily rates adjust to average $166
Seasonality Insights for Saint-Alphonse-Rodriguez
- The Airbnb seasonality in Saint-Alphonse-Rodriguez shows highly seasonal trends requiring careful strategy. While the sections above show seasonal averages, it's also insightful to look at the extremes:
- During the high season, the absolute peak month showcases Saint-Alphonse-Rodriguez's highest earning potential, with monthly revenues capable of climbing to $4,011, occupancy reaching a high of 66.8%, and ADRs peaking at $209.
- Conversely, the slowest single month of the year, typically falling within the low season, marks the market's lowest point. In this month, revenue might dip to $1,813, occupancy could drop to 29.1%, and ADRs may adjust down to $161.
- Understanding both the seasonal averages and these monthly peaks and troughs in revenue, occupancy, and ADR is crucial for maximizing your Airbnb profit potential in Saint-Alphonse-Rodriguez.
Seasonal Strategies for Maximizing Profit
- Peak Season: Maximize revenue through premium pricing and potentially longer minimum stays. Ensure high availability.
- Low Season: Offer competitive pricing, special promotions (e.g., extended stay discounts), and flexible cancellation policies. Target off-season travelers like remote workers or budget-conscious guests.
- Shoulder Seasons: Implement dynamic pricing that balances peak and low rates. Target weekend travelers or specific events. Offer slightly more flexible terms than peak season.
- Regularly analyze your own performance against these Saint-Alphonse-Rodriguez seasonality benchmarks and adjust your pricing and availability strategy accordingly.
Best Areas for Airbnb Investment in Saint-Alphonse-Rodriguez (2025)
Exploring the top neighborhoods for short-term rentals in Saint-Alphonse-Rodriguez? This section highlights key areas, outlining why they are attractive for hosts and guests, along with notable local attractions. Consider these locations based on your target guest profile and investment strategy.
| Neighborhood / Area | Why Host Here? (Target Guests & Appeal) | Key Attractions & Landmarks |
|---|---|---|
| Lac Saint-Alphonse | A picturesque lake area perfect for nature lovers and families looking for a peaceful retreat. Ideal for summer vacations and winter sports enthusiasts with activities year-round. | Lac Saint-Alphonse, Chalets on the lake, Fishing spots, Water sports, Swim areas, Nature trails |
| Parc Regional des Chutes Montmorency | A stunning natural park featuring beautiful waterfalls and hiking trails. Attracts outdoor enthusiasts and families looking for adventure and scenic views. | Montmorency Falls, Hiking trails, Picnic areas, Observation decks, Cable car rides |
| Sentier des Pionniers | A popular trail for hiking and biking, surrounded by nature. Great for those seeking outdoor activities and beautiful landscapes. | Hiking trails, Biking paths, Scenic viewpoints, Wildlife watching |
| Village de Saint-Alphonse-Rodriguez | The charming village center provides a local experience with shops and restaurants. Attracts visitors looking to explore the local culture and community. | Local shops, Cultural festivals, Restaurants, Community events |
| Lac Plaisant | Another beautiful lake in the area, ideal for summer getaways with opportunities for recreation and relaxation. | Swimming, Boating, Picnic areas, Nature exploration, Cottages and cabins |
| Montagne du Diable | A mountain offering various outdoor activities, attractions for hikers, and beautiful vistas. Appeals to those who enjoy challenging hikes and natural beauty. | Hiking, Stunning panoramas, Wildflowers, Camping |
| Les Sentiers de l’Estrie | A trail network that attracts hikers and bike riders, offering a chance to connect with nature. Perfect for those looking for active vacations. | Hiking routes, Biking trails, Scenic landscapes |
| Chalet rentals near the lakes | Chalet accommodations provide a cozy and private experience for travelers. Very popular for those seeking a home-like atmosphere in nature. | Lakeside campsites, Chalet facilities, Outdoor grilling, Fire pits, Family-friendly environments |
Understanding Airbnb License Requirements & STR Laws in Saint-Alphonse-Rodriguez (2025)
Yes, Saint-Alphonse-Rodriguez, Quebec, Canada enforces high STR regulations. Obtaining a license and ensuring compliance is almost certainly required according to current 2025 STR laws. Always verify the latest short term rental regulations and Airbnb license requirements directly with local government authorities for Saint-Alphonse-Rodriguez to ensure full compliance before hosting.
(Source: AirROI data, 2025, based on 81% licensed listings)
Top Performing Airbnb Properties in Saint-Alphonse-Rodriguez (2025)
Benchmark your potential! Explore examples of top-performing Airbnb properties in Saint-Alphonse-Rodriguezbased on Trailing Twelve Month (TTM) revenue. Analyze their characteristics, revenue, occupancy rate, and ADR to understand what drives success in this market.

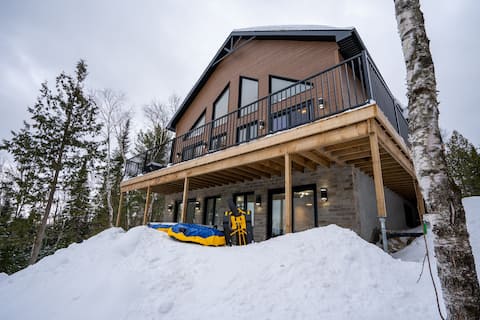
The LoveShack |Hot Tub | Lake | Private Beach
Entire Place • 3 bedrooms
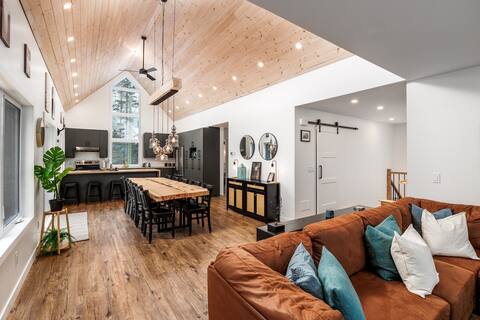
Eli's Sanctuary
Entire Place • 5 bedrooms
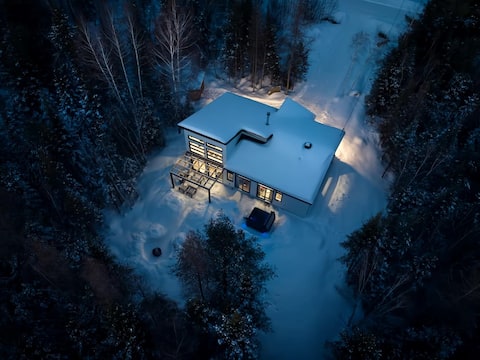
1 Hour Montreal~BBQ~A/C~Game Room~King Bed~Arcades
Entire Place • 4 bedrooms
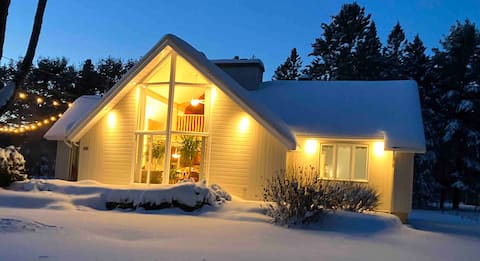
Agathe’s Cottage, safe haven only 1h from Montreal
Entire Place • 4 bedrooms

Stop at the river
Entire Place • 2 bedrooms
Le Serenité (Sauna and Spa)
Entire Place • 3 bedrooms
Note: Performance varies based on location, size, amenities, seasonality, and management quality. Data reflects the past 12 months.
Top Performing Airbnb Hosts in Saint-Alphonse-Rodriguez (2025)
Learn from the best! This table showcases top-performing Airbnb hosts in Saint-Alphonse-Rodriguez based on the number of properties managed and estimated total revenue over the past year. Analyze their scale and performance metrics.
| Host Name | Properties | Grossing Revenue | Stay Reviews | Avg Rating |
|---|---|---|---|---|
| Mathieu | 1 | $78,523 | 74 | 4.97/5.0 |
| Guy | 1 | $77,788 | 27 | 4.85/5.0 |
| Angeline | 2 | $65,710 | 189 | 4.78/5.0 |
| Frank | 1 | $57,365 | 48 | 4.98/5.0 |
| Charles-André | 1 | $57,352 | 81 | 4.96/5.0 |
| Marie-Pier | 1 | $55,982 | 74 | 5.00/5.0 |
| Eric | 1 | $52,244 | 101 | 4.92/5.0 |
| Marie | 1 | $49,520 | 33 | 4.94/5.0 |
| Michelle | 1 | $47,532 | 61 | 4.79/5.0 |
| Angela | 1 | $42,402 | 137 | 4.93/5.0 |
Analyzing the strategies of top hosts, such as their property selection, pricing, and guest communication, can offer valuable lessons for optimizing your own Airbnb operations in Saint-Alphonse-Rodriguez.
Dive Deeper: Advanced Saint-Alphonse-Rodriguez STR Market Data (2025)
Ready to unlock more insights? AirROI provides access to advanced metrics and comprehensive Airbnb data for Saint-Alphonse-Rodriguez. Explore detailed analytics beyond this report to refine your investment strategy, optimize pricing, and maximize your vacation rental profits.
Explore Advanced MetricsSaint-Alphonse-Rodriguez Short-Term Rental Market Composition (2025): Property & Room Types
Room Type Distribution
Property Type Distribution
Market Composition Insights for Saint-Alphonse-Rodriguez
- The Saint-Alphonse-Rodriguez Airbnb market composition is heavily skewed towards Entire Home/Apt listings, which make up 100% of the 36 active rentals. This indicates strong guest preference for privacy and space.
- Looking at the property type distribution in Saint-Alphonse-Rodriguez, House properties are the most common (97.2%), reflecting the local real estate landscape.
- Houses represent a significant 97.2% portion, catering likely to families or larger groups.
- Smaller segments like outdoor/unique (combined 2.8%) offer potential for unique stay experiences.
Saint-Alphonse-Rodriguez Airbnb Room Capacity Analysis (2025): Bedroom Distribution
Distribution of Listings by Number of Bedrooms
Room Capacity Insights for Saint-Alphonse-Rodriguez
- The dominant room capacity in Saint-Alphonse-Rodriguez is 3 bedrooms listings, making up 41.7% of the market. This suggests a strong demand for properties suitable for families or small groups.
- Together, 3 bedrooms and 2 bedrooms properties represent 69.5% of the active Airbnb listings in Saint-Alphonse-Rodriguez, indicating a high concentration in these sizes.
- A significant 69.5% of listings offer 3+ bedrooms, catering to larger groups and families seeking more space in Saint-Alphonse-Rodriguez.
Saint-Alphonse-Rodriguez Vacation Rental Guest Capacity Trends (2025)
Distribution of Listings by Guest Capacity
Guest Capacity Insights for Saint-Alphonse-Rodriguez
- The most common guest capacity trend in Saint-Alphonse-Rodriguez vacation rentals is listings accommodating 8+ guests (47.2%). This suggests the primary traveler segment is likely larger groups.
- Properties designed for 8+ guests and 6 guests dominate the Saint-Alphonse-Rodriguez STR market, accounting for 80.5% of listings.
- 86.1% of properties accommodate 6+ guests, serving the market segment for larger families or group travel in Saint-Alphonse-Rodriguez.
- On average, properties in Saint-Alphonse-Rodriguez are equipped to host 6.8 guests.
Saint-Alphonse-Rodriguez Airbnb Booking Patterns (2025): Available vs. Booked Days
Available Days Distribution
Booked Days Distribution
Booking Pattern Insights for Saint-Alphonse-Rodriguez
- The most common availability pattern in Saint-Alphonse-Rodriguez falls within the 271-366 days range, representing 33.3% of listings. This suggests many properties have significant open periods on their calendars.
- Approximately 61.1% of listings show high availability (181+ days open annually), indicating potential for increased bookings or specific owner usage patterns.
- For booked days, the 91-180 days range is most frequent in Saint-Alphonse-Rodriguez (33.3%), reflecting common guest stay durations or potential owner blocking patterns.
- A notable 38.9% of properties secure long booking periods (181+ days booked per year), highlighting successful long-term rental strategies or significant owner usage.
Saint-Alphonse-Rodriguez Airbnb Minimum Stay Requirements Analysis
Distribution of Listings by Minimum Night Requirement
1 Night
2 listings
5.9% of total
2 Nights
16 listings
47.1% of total
3 Nights
2 listings
5.9% of total
4-6 Nights
2 listings
5.9% of total
7-29 Nights
3 listings
8.8% of total
30+ Nights
9 listings
26.5% of total
Key Insights
- The most prevalent minimum stay requirement in Saint-Alphonse-Rodriguez is 2 Nights, adopted by 47.1% of listings. This highlights the market's preference for shorter, flexible bookings.
- A significant segment (26.5%) caters to monthly stays (30+ nights) in Saint-Alphonse-Rodriguez, pointing to opportunities in the extended-stay market.
Recommendations
- Align with the market by considering a 2 Nights minimum stay, as 47.1% of Saint-Alphonse-Rodriguez hosts use this setting.
- If feasible, allowing 1-night stays, especially midweek or during low season, could capture last-minute bookings, as only 5.9% currently do.
- A 2-night minimum appears standard (47.1%). Consider this for weekends or peak periods.
- Explore offering discounts for stays of 30+ nights to attract the 26.5% of the market seeking extended stays.
- Adjust minimum nights based on seasonality – potentially shorter during low season and longer during peak demand periods in Saint-Alphonse-Rodriguez.
Saint-Alphonse-Rodriguez Airbnb Cancellation Policy Trends Analysis (2025)
Super Strict 30 Days
1 listings
3.3% of total
Flexible
3 listings
10% of total
Moderate
6 listings
20% of total
Firm
14 listings
46.7% of total
Strict
6 listings
20% of total
Cancellation Policy Insights for Saint-Alphonse-Rodriguez
- The prevailing Airbnb cancellation policy trend in Saint-Alphonse-Rodriguez is Firm, used by 46.7% of listings.
- A majority (66.7%) of hosts in Saint-Alphonse-Rodriguez utilize Firm or Strict policies, indicating a market where hosts prioritize booking security.
Recommendations for Hosts
- Consider adopting a Firm policy to align with the 46.7% market standard in Saint-Alphonse-Rodriguez.
- Regularly review your cancellation policy against competitors and market demand shifts in Saint-Alphonse-Rodriguez.
Saint-Alphonse-Rodriguez STR Booking Lead Time Analysis (2025)
Average Booking Lead Time by Month
Booking Lead Time Insights for Saint-Alphonse-Rodriguez
- The overall average booking lead time for vacation rentals in Saint-Alphonse-Rodriguez is 32 days.
- Guests book furthest in advance for stays during July (average 63 days), likely coinciding with peak travel demand or local events.
- The shortest booking windows occur for stays in November (average 20 days), indicating more last-minute travel plans during this time.
- Seasonally, Summer (47 days avg.) sees the longest lead times, while Spring (31 days avg.) has the shortest, reflecting typical travel planning cycles.
Recommendations for Hosts
- Use the overall average lead time (32 days) as a baseline for your pricing and availability strategy in Saint-Alphonse-Rodriguez.
- For July stays, consider implementing length-of-stay discounts or slightly higher rates for bookings made less than 63 days out to capitalize on advance planning.
- Target marketing efforts for the Summer season well in advance (at least 47 days) to capture early planners.
- Monitor your own booking lead times against these Saint-Alphonse-Rodriguez averages to identify opportunities for dynamic pricing adjustments.
Popular & Essential Airbnb Amenities in Saint-Alphonse-Rodriguez (2025)
Amenity Prevalence
Amenity Insights for Saint-Alphonse-Rodriguez
- Essential amenities in Saint-Alphonse-Rodriguez that guests expect include: Smoke alarm, Washer, Free parking on premises, Wifi, Kitchen, Dryer, Hot water. Lacking these (any) could significantly impact bookings.
- Popular amenities like Heating, Coffee maker, BBQ grill are common but not universal. Offering these can provide a competitive edge.
Recommendations for Hosts
- Ensure your listing includes all essential amenities for Saint-Alphonse-Rodriguez: Smoke alarm, Washer, Free parking on premises, Wifi, Kitchen, Dryer, Hot water.
- Prioritize adding missing essentials: Kitchen, Dryer, Hot water.
- Consider adding popular differentiators like Heating or Coffee maker to increase appeal.
- Highlight unique or less common amenities you offer (e.g., hot tub, dedicated workspace, EV charger) in your listing description and photos.
- Regularly check competitor amenities in Saint-Alphonse-Rodriguez to stay competitive.
Saint-Alphonse-Rodriguez Airbnb Guest Demographics & Profile Analysis (2025)
Guest Profile Summary for Saint-Alphonse-Rodriguez
- The typical guest profile for Airbnb in Saint-Alphonse-Rodriguez consists of primarily domestic travelers (86%), often arriving from nearby Montreal, typically belonging to the Post-2000s (Gen Z/Alpha) group (50%), primarily speaking English or French.
- Domestic travelers account for 85.6% of guests.
- Key international markets include Canada (85.6%) and United States (6.7%).
- Top languages spoken are English (42.2%) followed by French (41.3%).
- A significant demographic segment is the Post-2000s (Gen Z/Alpha) group, representing 50% of guests.
Recommendations for Hosts
- Target domestic marketing efforts towards travelers from Montreal and Laval.
- Tailor amenities and listing descriptions to appeal to the dominant Post-2000s (Gen Z/Alpha) demographic (e.g., highlight fast WiFi, smart home features, local guides).
- Highlight unique local experiences or amenities relevant to the primary guest profile.
- Consider seasonal promotions aligned with peak travel times for key origin markets.
Nearby Short-Term Rental Market Comparison
How does the Saint-Alphonse-Rodriguez Airbnb market stack up against its neighbors? Compare key performance metrics like average monthly revenue, ADR, and occupancy rates in surrounding areas to understand the broader regional STR landscape.
| Market | Active Properties | Monthly Revenue | Daily Rate | Avg. Occupancy |
|---|---|---|---|---|
| Mille-Isles | 93 | $5,049 | $415.08 | 41% |
| Saint-Denis-de-Brompton | 28 | $4,459 | $383.13 | 34% |
| Grenville-sur-la-Rouge | 32 | $4,226 | $362.40 | 41% |
| Waterloo | 11 | $4,092 | $357.06 | 37% |
| La Conception | 172 | $3,846 | $290.12 | 42% |
| Shefford | 26 | $3,538 | $254.63 | 43% |
| Stanstead (Canton) | 40 | $3,462 | $234.29 | 46% |
| Venise-en-Québec | 22 | $3,336 | $297.53 | 36% |
| Saint-Paulin | 14 | $3,163 | $490.55 | 33% |
| Saint-Roch-de-Mékinac | 11 | $3,108 | $314.58 | 41% |