Piedmont Airbnb Market Analysis 2025: Short Term Rental Data & Vacation Rental Statistics in Quebec, Canada
Is Airbnb profitable in Piedmont in 2025? Explore comprehensive Airbnb analytics for Piedmont, Quebec, Canada to uncover income potential. This 2025 STR market report for Piedmont, based on AirROI data from April 2024 to March 2025, reveals key trends in the niche market of 17 active listings.
Whether you're considering an Airbnb investment in Piedmont, optimizing your existing vacation rental, or exploring rental arbitrage opportunities, understanding the Piedmont Airbnb data is crucial. Navigating the high regulation landscape is key to maximizing your short term rental income potential. Let's dive into the specifics.
Key Piedmont Airbnb Performance Metrics Overview
Monthly Airbnb Revenue Variations & Income Potential in Piedmont (2025)
Understanding the monthly revenue variations for Airbnb listings in Piedmont is key to maximizing your short term rental income potential. Seasonality significantly impacts earnings. Our analysis, based on data from the past 12 months, shows that the peak revenue month for STRs in Piedmont is typically May, while November often presents the lowest earnings, highlighting opportunities for strategic pricing adjustments during shoulder and low seasons. Explore the typical Airbnb income in Piedmont across different performance tiers:
- Best-in-class properties (Top 10%) achieve $2,142+ monthly, often utilizing dynamic pricing and superior guest experiences.
- Strong performing properties (Top 25%) earn $1,638 or more, indicating effective management and desirable locations/amenities.
- Typical properties (Median) generate around $1,120 per month, representing the average market performance.
- Entry-level properties (Bottom 25%) see earnings around $700, often with potential for optimization.
Average Monthly Airbnb Earnings Trend in Piedmont
Piedmont Airbnb Occupancy Rate Trends (2025)
Maximize your bookings by understanding the Piedmont STR occupancy trends. Seasonal demand shifts significantly influence how often properties are booked. Typically, Augustsees the highest demand (peak season occupancy), while January experiences the lowest (low season). Effective strategies, like adjusting minimum stays or offering promotions, can boost occupancy during slower periods. Here's how different property tiers perform in Piedmont:
- Best-in-class properties (Top 10%) achieve 72%+ occupancy, indicating high desirability and potentially optimized availability.
- Strong performing properties (Top 25%) maintain 56% or higher occupancy, suggesting good market fit and guest satisfaction.
- Typical properties (Median) have an occupancy rate around 36%.
- Entry-level properties (Bottom 25%) average 23% occupancy, potentially facing higher vacancy.
Average Monthly Occupancy Rate Trend in Piedmont
Average Daily Rate (ADR) Airbnb Trends in Piedmont (2025)
Effective short term rental pricing strategy in Piedmont involves understanding monthly ADR fluctuations. The Average Daily Rate (ADR) for Airbnb in Piedmont typically peaks in July and dips lowest during November. Leveraging Airbnb dynamic pricing tools or strategies based on this seasonality can significantly boost revenue. Here's a look at the typical nightly rates achieved:
- Best-in-class properties (Top 10%) command rates of $186+ per night, often due to premium features or locations.
- Strong performing properties (Top 25%) achieve nightly rates of $137 or more.
- Typical properties (Median) charge around $99 per night.
- Entry-level properties (Bottom 25%) earn around $74 per night.
Average Daily Rate (ADR) Trend by Month in Piedmont
Get Live Piedmont Market Intelligence 👇

Explore Real-time Analytics
Airbnb Seasonality Analysis & Trends in Piedmont (2025)
Peak Season (May, December, August)
- Revenue averages $1,533 per month
- Occupancy rates average 50.0%
- Daily rates average $121
Shoulder Season
- Revenue averages $1,290 per month
- Occupancy maintains around 41.1%
- Daily rates hold near $120
Low Season (January, April, November)
- Revenue drops to average $869 per month
- Occupancy decreases to average 31.1%
- Daily rates adjust to average $106
Seasonality Insights for Piedmont
- The Airbnb seasonality in Piedmont shows moderate seasonality with distinct peak and low periods. While the sections above show seasonal averages, it's also insightful to look at the extremes:
- During the high season, the absolute peak month showcases Piedmont's highest earning potential, with monthly revenues capable of climbing to $1,603, occupancy reaching a high of 55.8%, and ADRs peaking at $134.
- Conversely, the slowest single month of the year, typically falling within the low season, marks the market's lowest point. In this month, revenue might dip to $769, occupancy could drop to 26.6%, and ADRs may adjust down to $88.
- Understanding both the seasonal averages and these monthly peaks and troughs in revenue, occupancy, and ADR is crucial for maximizing your Airbnb profit potential in Piedmont.
Seasonal Strategies for Maximizing Profit
- Peak Season: Maximize revenue through premium pricing and potentially longer minimum stays. Ensure high availability.
- Low Season: Offer competitive pricing, special promotions (e.g., extended stay discounts), and flexible cancellation policies. Target off-season travelers like remote workers or budget-conscious guests.
- Shoulder Seasons: Implement dynamic pricing that balances peak and low rates. Target weekend travelers or specific events. Offer slightly more flexible terms than peak season.
- Regularly analyze your own performance against these Piedmont seasonality benchmarks and adjust your pricing and availability strategy accordingly.
Best Areas for Airbnb Investment in Piedmont (2025)
Exploring the top neighborhoods for short-term rentals in Piedmont? This section highlights key areas, outlining why they are attractive for hosts and guests, along with notable local attractions. Consider these locations based on your target guest profile and investment strategy.
| Neighborhood / Area | Why Host Here? (Target Guests & Appeal) | Key Attractions & Landmarks |
|---|---|---|
| Mont-Tremblant | A world-renowned ski resort town that attracts visitors year-round for skiing, golfing, and outdoor adventures. Mont-Tremblant is perfect for both winter and summer tourism, making it a lucrative location for Airbnb hosting. | Mont-Tremblant Ski Resort, Parc national du Mont-Tremblant, Tremblant Village, Casino de Mont-Tremblant, Pedestrian village, Lac Tremblant |
| Laval | Located just north of Montreal, Laval is a bustling suburb with a mix of residential and commercial areas. Its proximity to Montreal makes it an attractive location for business travelers and families visiting the city. | Cosmodome, Centropolis, Laval Zoo, SkyVenture, Musee Armand-Frappier, Quartier Laval |
| Quebec City | A historic and picturesque city that attracts millions of tourists each year. The Old Quebec area is especially appealing, with its charming architecture and rich history, making it a prime spot for Airbnb rentals. | Old Quebec, Château Frontenac, Plains of Abraham, Montmorency Falls, Quebec City Citadel, Petit Champlain |
| Sherbrooke | As a major urban center in the Eastern Townships, Sherbrooke offers a vibrant downtown and access to outdoor activities. Its universities attract students and visitors, creating opportunities for short-term rentals. | Parc Jacques-Cartier, La Halte Mariale de Beauvoir, Sherbrooke Museum of Fine Arts, Bishop's University, La plage de la Pointe - Parc de la Rivière |
| Gatineau | Located across the river from Ottawa, Gatineau is known for its parks and cultural sites. It offers great potential for Airbnb hosts looking to attract visitors to the National Capital Region. | Gatineau Park, Canadian Museum of History, Jacques-Cartier Park, Morrison Park, Parc de la Baie |
| Montreal Plateau | The Plateau Mont-Royal neighborhood is known for its vibrant culture, arts scene, and distinct architecture. It's a hotspot for tourists looking for an authentic Montreal experience. | Mount Royal Park, St. Joseph's Oratory, Lachine Canal, St. Laurent Boulevard, Plateau Mont-Royal |
| Val-d'Or | An important mining town that attracts workers and tourists alike, especially during the annual Val-d'Or fair. It's a unique destination for those seeking to explore the Abitibi-Témiscamingue region. | The Site of the Historic Gold Mines, Parc Park, Musee de l'Abitibi-Témiscamingue, Val-d'Or Fair, Cité de l'Or |
| Magog | Located by Lake Memphremagog, Magog is a charming town that draws visitors for its lake activities and natural beauty. Ideal for tourists looking for a relaxed getaway in the Eastern Townships. | Parc de la Baie-de-Magog, Lake Memphremagog, Magog Village, Mont Orford National Park, Vignoble La Senteurs |
Understanding Airbnb License Requirements & STR Laws in Piedmont (2025)
Yes, Piedmont, Quebec, Canada enforces high STR regulations. Obtaining a license and ensuring compliance is almost certainly required according to current 2025 STR laws. Always verify the latest short term rental regulations and Airbnb license requirements directly with local government authorities for Piedmont to ensure full compliance before hosting.
(Source: AirROI data, 2025, based on 71% licensed listings)
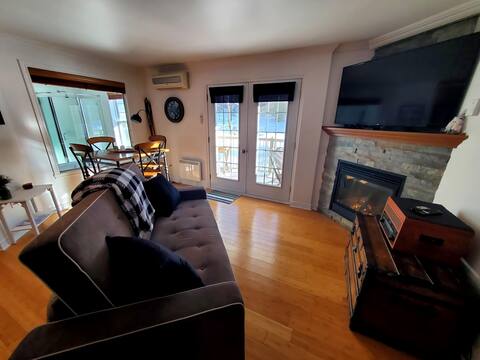
Top Performing Airbnb Properties in Piedmont (2025)
Benchmark your potential! Explore examples of top-performing Airbnb properties in Piedmontbased on Trailing Twelve Month (TTM) revenue. Analyze their characteristics, revenue, occupancy rate, and ADR to understand what drives success in this market.

The Zen Haven
Entire Place • 1 bedroom
Studio Rustico Chic Nearby Piedmont's Hotspots!
Entire Place • N/A

Cozy Loft in the Heart of Saint-Sauveur Village
Entire Place • 1 bedroom

Le petit Refuge
Entire Place • N/A

Koselig Refuge
Entire Place • 1 bedroom

Cozy& Modern Loft: the Heart of St Sauveur Village
Entire Place • 1 bedroom
Note: Performance varies based on location, size, amenities, seasonality, and management quality. Data reflects the past 12 months.
Top Performing Airbnb Hosts in Piedmont (2025)
Learn from the best! This table showcases top-performing Airbnb hosts in Piedmont based on the number of properties managed and estimated total revenue over the past year. Analyze their scale and performance metrics.
| Host Name | Properties | Grossing Revenue | Stay Reviews | Avg Rating |
|---|---|---|---|---|
| Kōzē Stays | 4 | $54,086 | 105 | 4.65/5.0 |
| Anouk | 2 | $31,136 | 192 | 4.96/5.0 |
| Rouba | 1 | $25,001 | 35 | 4.89/5.0 |
| Mish | 1 | $18,450 | 74 | 4.89/5.0 |
| David | 3 | $14,850 | 14 | 2.94/5.0 |
| Costa | 1 | $10,405 | 345 | 4.87/5.0 |
| Linfei | 1 | $9,950 | 139 | 4.88/5.0 |
| Bruno | 1 | $9,750 | 162 | 4.95/5.0 |
| Mathieu | 1 | $8,598 | 8 | 4.75/5.0 |
| Christelle | 1 | $7,134 | 30 | 4.67/5.0 |
Analyzing the strategies of top hosts, such as their property selection, pricing, and guest communication, can offer valuable lessons for optimizing your own Airbnb operations in Piedmont.
Dive Deeper: Advanced Piedmont STR Market Data (2025)
Ready to unlock more insights? AirROI provides access to advanced metrics and comprehensive Airbnb data for Piedmont. Explore detailed analytics beyond this report to refine your investment strategy, optimize pricing, and maximize your vacation rental profits.
Explore Advanced MetricsPiedmont Short-Term Rental Market Composition (2025): Property & Room Types
Room Type Distribution
Property Type Distribution
Market Composition Insights for Piedmont
- The Piedmont Airbnb market composition is heavily skewed towards Entire Home/Apt listings, which make up 100% of the 17 active rentals. This indicates strong guest preference for privacy and space.
- Looking at the property type distribution in Piedmont, Apartment/Condo properties are the most common (88.2%), reflecting the local real estate landscape.
Piedmont Airbnb Room Capacity Analysis (2025): Bedroom Distribution
Distribution of Listings by Number of Bedrooms
Room Capacity Insights for Piedmont
- The dominant room capacity in Piedmont is 1 bedroom listings, making up 76.5% of the market. This suggests a strong demand for properties suitable for couples or solo travelers.
- Together, 1 bedroom and 4 bedrooms properties represent 82.4% of the active Airbnb listings in Piedmont, indicating a high concentration in these sizes.
- With over half the market (76.5%) consisting of studios or 1-bedroom units, Piedmont is particularly well-suited for individuals or couples.
Piedmont Vacation Rental Guest Capacity Trends (2025)
Distribution of Listings by Guest Capacity
Guest Capacity Insights for Piedmont
- The most common guest capacity trend in Piedmont vacation rentals is listings accommodating 4 guests (35.3%). This suggests the primary traveler segment is likely small families or groups.
- Properties designed for 4 guests and 2 guests dominate the Piedmont STR market, accounting for 70.6% of listings.
- 11.8% of properties accommodate 6+ guests, serving the market segment for larger families or group travel in Piedmont.
- On average, properties in Piedmont are equipped to host 3.5 guests.
Piedmont Airbnb Booking Patterns (2025): Available vs. Booked Days
Available Days Distribution
Booked Days Distribution
Booking Pattern Insights for Piedmont
- The most common availability pattern in Piedmont falls within the 181-270 days range, representing 41.2% of listings. This suggests many properties have significant open periods on their calendars.
- Approximately 70.6% of listings show high availability (181+ days open annually), indicating potential for increased bookings or specific owner usage patterns.
- For booked days, the 91-180 days range is most frequent in Piedmont (41.2%), reflecting common guest stay durations or potential owner blocking patterns.
- A notable 29.4% of properties secure long booking periods (181+ days booked per year), highlighting successful long-term rental strategies or significant owner usage.
Piedmont Airbnb Minimum Stay Requirements Analysis
Distribution of Listings by Minimum Night Requirement
1 Night
2 listings
11.8% of total
2 Nights
6 listings
35.3% of total
3 Nights
1 listings
5.9% of total
4-6 Nights
1 listings
5.9% of total
7-29 Nights
1 listings
5.9% of total
30+ Nights
6 listings
35.3% of total
Key Insights
- The most prevalent minimum stay requirement in Piedmont is 2 Nights, adopted by 35.3% of listings. This highlights the market's preference for shorter, flexible bookings.
- A significant segment (35.3%) caters to monthly stays (30+ nights) in Piedmont, pointing to opportunities in the extended-stay market.
Recommendations
- Align with the market by considering a 2 Nights minimum stay, as 35.3% of Piedmont hosts use this setting.
- If feasible, allowing 1-night stays, especially midweek or during low season, could capture last-minute bookings, as only 11.8% currently do.
- A 2-night minimum appears standard (35.3%). Consider this for weekends or peak periods.
- Explore offering discounts for stays of 30+ nights to attract the 35.3% of the market seeking extended stays.
- Adjust minimum nights based on seasonality – potentially shorter during low season and longer during peak demand periods in Piedmont.
Piedmont Airbnb Cancellation Policy Trends Analysis (2025)
Flexible
4 listings
25% of total
Moderate
5 listings
31.3% of total
Firm
1 listings
6.3% of total
Strict
6 listings
37.5% of total
Cancellation Policy Insights for Piedmont
- The prevailing Airbnb cancellation policy trend in Piedmont is Strict, used by 37.5% of listings.
- There's a relatively balanced mix between guest-friendly (56.3%) and stricter (43.8%) policies, offering choices for different guest needs.
Recommendations for Hosts
- Consider adopting a Strict policy to align with the 37.5% market standard in Piedmont.
- With 37.5% using Strict terms, this is a viable option in Piedmont, particularly for high-value properties or during peak demand periods.
- Regularly review your cancellation policy against competitors and market demand shifts in Piedmont.
Piedmont STR Booking Lead Time Analysis (2025)
Average Booking Lead Time by Month
Booking Lead Time Insights for Piedmont
- The overall average booking lead time for vacation rentals in Piedmont is 32 days.
- Guests book furthest in advance for stays during January (average 59 days), likely coinciding with peak travel demand or local events.
- The shortest booking windows occur for stays in August (average 13 days), indicating more last-minute travel plans during this time.
- Seasonally, Winter (44 days avg.) sees the longest lead times, while Spring (22 days avg.) has the shortest, reflecting typical travel planning cycles.
Recommendations for Hosts
- Use the overall average lead time (32 days) as a baseline for your pricing and availability strategy in Piedmont.
- For January stays, consider implementing length-of-stay discounts or slightly higher rates for bookings made less than 59 days out to capitalize on advance planning.
- During August, focus on last-minute booking availability and promotions, as guests book with very short notice (13 days avg.).
- Target marketing efforts for the Winter season well in advance (at least 44 days) to capture early planners.
- Monitor your own booking lead times against these Piedmont averages to identify opportunities for dynamic pricing adjustments.
Popular & Essential Airbnb Amenities in Piedmont (2025)
Amenity Prevalence
Amenity Insights for Piedmont
- Essential amenities in Piedmont that guests expect include: Indoor fireplace, Smoke alarm, Heating, Wifi, Free parking on premises, Dishes and silverware. Lacking these (any) could significantly impact bookings.
- Popular amenities like Kitchen, Hot water, TV are common but not universal. Offering these can provide a competitive edge.
Recommendations for Hosts
- Ensure your listing includes all essential amenities for Piedmont: Indoor fireplace, Smoke alarm, Heating, Wifi, Free parking on premises, Dishes and silverware.
- Consider adding popular differentiators like Kitchen or Hot water to increase appeal.
- Highlight unique or less common amenities you offer (e.g., hot tub, dedicated workspace, EV charger) in your listing description and photos.
- Regularly check competitor amenities in Piedmont to stay competitive.
Piedmont Airbnb Guest Demographics & Profile Analysis (2025)
Guest Profile Summary for Piedmont
- The typical guest profile for Airbnb in Piedmont consists of primarily domestic travelers (78%), often arriving from nearby Montreal, typically belonging to the Post-2000s (Gen Z/Alpha) group (50%), primarily speaking English or French.
- Domestic travelers account for 77.7% of guests.
- Key international markets include Canada (77.7%) and United States (10.1%).
- Top languages spoken are English (43.9%) followed by French (38.5%).
- A significant demographic segment is the Post-2000s (Gen Z/Alpha) group, representing 50% of guests.
Recommendations for Hosts
- Target domestic marketing efforts towards travelers from Montreal and Toronto.
- Tailor amenities and listing descriptions to appeal to the dominant Post-2000s (Gen Z/Alpha) demographic (e.g., highlight fast WiFi, smart home features, local guides).
- Highlight unique local experiences or amenities relevant to the primary guest profile.
- Consider seasonal promotions aligned with peak travel times for key origin markets.
Nearby Short-Term Rental Market Comparison
How does the Piedmont Airbnb market stack up against its neighbors? Compare key performance metrics like average monthly revenue, ADR, and occupancy rates in surrounding areas to understand the broader regional STR landscape.
| Market | Active Properties | Monthly Revenue | Daily Rate | Avg. Occupancy |
|---|---|---|---|---|
| Mille-Isles | 93 | $5,049 | $415.08 | 41% |
| Malletts Bay | 49 | $4,960 | $414.58 | 48% |
| Wilmington | 130 | $4,484 | $324.06 | 45% |
| Grenville-sur-la-Rouge | 32 | $4,226 | $362.40 | 41% |
| Middlebury | 52 | $4,128 | $288.39 | 54% |
| New Haven | 12 | $3,904 | $206.65 | 58% |
| South Burlington | 103 | $3,864 | $291.90 | 50% |
| La Conception | 172 | $3,846 | $290.12 | 42% |
| Town of North Elba | 249 | $3,765 | $395.96 | 41% |
| Cantley | 22 | $3,741 | $242.96 | 50% |