Notre-Dame-de-Pontmain Airbnb Market Analysis 2025: Short Term Rental Data & Vacation Rental Statistics in Quebec, Canada
Is Airbnb profitable in Notre-Dame-de-Pontmain in 2025? Explore comprehensive Airbnb analytics for Notre-Dame-de-Pontmain, Quebec, Canada to uncover income potential. This 2025 STR market report for Notre-Dame-de-Pontmain, based on AirROI data from April 2024 to March 2025, reveals key trends in the niche market of 19 active listings.
Whether you're considering an Airbnb investment in Notre-Dame-de-Pontmain, optimizing your existing vacation rental, or exploring rental arbitrage opportunities, understanding the Notre-Dame-de-Pontmain Airbnb data is crucial. Navigating the high regulation landscape is key to maximizing your short term rental income potential. Let's dive into the specifics.
Key Notre-Dame-de-Pontmain Airbnb Performance Metrics Overview
Monthly Airbnb Revenue Variations & Income Potential in Notre-Dame-de-Pontmain (2025)
Understanding the monthly revenue variations for Airbnb listings in Notre-Dame-de-Pontmain is key to maximizing your short term rental income potential. Seasonality significantly impacts earnings. Our analysis, based on data from the past 12 months, shows that the peak revenue month for STRs in Notre-Dame-de-Pontmain is typically August, while February often presents the lowest earnings, highlighting opportunities for strategic pricing adjustments during shoulder and low seasons. Explore the typical Airbnb income in Notre-Dame-de-Pontmain across different performance tiers:
- Best-in-class properties (Top 10%) achieve $6,211+ monthly, often utilizing dynamic pricing and superior guest experiences.
- Strong performing properties (Top 25%) earn $3,606 or more, indicating effective management and desirable locations/amenities.
- Typical properties (Median) generate around $2,113 per month, representing the average market performance.
- Entry-level properties (Bottom 25%) see earnings around $1,327, often with potential for optimization.
Average Monthly Airbnb Earnings Trend in Notre-Dame-de-Pontmain
Notre-Dame-de-Pontmain Airbnb Occupancy Rate Trends (2025)
Maximize your bookings by understanding the Notre-Dame-de-Pontmain STR occupancy trends. Seasonal demand shifts significantly influence how often properties are booked. Typically, Julysees the highest demand (peak season occupancy), while October experiences the lowest (low season). Effective strategies, like adjusting minimum stays or offering promotions, can boost occupancy during slower periods. Here's how different property tiers perform in Notre-Dame-de-Pontmain:
- Best-in-class properties (Top 10%) achieve 69%+ occupancy, indicating high desirability and potentially optimized availability.
- Strong performing properties (Top 25%) maintain 52% or higher occupancy, suggesting good market fit and guest satisfaction.
- Typical properties (Median) have an occupancy rate around 31%.
- Entry-level properties (Bottom 25%) average 21% occupancy, potentially facing higher vacancy.
Average Monthly Occupancy Rate Trend in Notre-Dame-de-Pontmain
Average Daily Rate (ADR) Airbnb Trends in Notre-Dame-de-Pontmain (2025)
Effective short term rental pricing strategy in Notre-Dame-de-Pontmain involves understanding monthly ADR fluctuations. The Average Daily Rate (ADR) for Airbnb in Notre-Dame-de-Pontmain typically peaks in August and dips lowest during February. Leveraging Airbnb dynamic pricing tools or strategies based on this seasonality can significantly boost revenue. Here's a look at the typical nightly rates achieved:
- Best-in-class properties (Top 10%) command rates of $332+ per night, often due to premium features or locations.
- Strong performing properties (Top 25%) achieve nightly rates of $243 or more.
- Typical properties (Median) charge around $175 per night.
- Entry-level properties (Bottom 25%) earn around $143 per night.
Average Daily Rate (ADR) Trend by Month in Notre-Dame-de-Pontmain
Get Live Notre-Dame-de-Pontmain Market Intelligence 👇

Explore Real-time Analytics
Airbnb Seasonality Analysis & Trends in Notre-Dame-de-Pontmain (2025)
Peak Season (August, July, June)
- Revenue averages $4,828 per month
- Occupancy rates average 58.0%
- Daily rates average $220
Shoulder Season
- Revenue averages $2,480 per month
- Occupancy maintains around 32.8%
- Daily rates hold near $204
Low Season (January, February, March)
- Revenue drops to average $1,557 per month
- Occupancy decreases to average 27.9%
- Daily rates adjust to average $192
Seasonality Insights for Notre-Dame-de-Pontmain
- The Airbnb seasonality in Notre-Dame-de-Pontmain shows highly seasonal trends requiring careful strategy. While the sections above show seasonal averages, it's also insightful to look at the extremes:
- During the high season, the absolute peak month showcases Notre-Dame-de-Pontmain's highest earning potential, with monthly revenues capable of climbing to $5,535, occupancy reaching a high of 68.0%, and ADRs peaking at $226.
- Conversely, the slowest single month of the year, typically falling within the low season, marks the market's lowest point. In this month, revenue might dip to $1,483, occupancy could drop to 23.9%, and ADRs may adjust down to $190.
- Understanding both the seasonal averages and these monthly peaks and troughs in revenue, occupancy, and ADR is crucial for maximizing your Airbnb profit potential in Notre-Dame-de-Pontmain.
Seasonal Strategies for Maximizing Profit
- Peak Season: Maximize revenue through premium pricing and potentially longer minimum stays. Ensure high availability.
- Low Season: Offer competitive pricing, special promotions (e.g., extended stay discounts), and flexible cancellation policies. Target off-season travelers like remote workers or budget-conscious guests.
- Shoulder Seasons: Implement dynamic pricing that balances peak and low rates. Target weekend travelers or specific events. Offer slightly more flexible terms than peak season.
- Regularly analyze your own performance against these Notre-Dame-de-Pontmain seasonality benchmarks and adjust your pricing and availability strategy accordingly.
Best Areas for Airbnb Investment in Notre-Dame-de-Pontmain (2025)
Exploring the top neighborhoods for short-term rentals in Notre-Dame-de-Pontmain? This section highlights key areas, outlining why they are attractive for hosts and guests, along with notable local attractions. Consider these locations based on your target guest profile and investment strategy.
| Neighborhood / Area | Why Host Here? (Target Guests & Appeal) | Key Attractions & Landmarks |
|---|---|---|
| Centre-ville de Pontmain | Centrally located, this area is close to shops and restaurants, appealing to tourists seeking convenience and accessibility. Ideal for travelers who want a taste of local life while being near attractions. | Local shops, Dining options, Cultural events, Public parks, Nearby historical sites |
| Parc régional de la rivière du Sud | A natural escape perfect for outdoor enthusiasts, offering stunning views and recreational activities. It attracts nature lovers looking for a peaceful retreat. | Hiking trails, Fishing spots, Picnic areas, Wildlife viewing, Scenic viewpoints |
| Lac de l'Île-Bouchard | This serene lake area is great for relaxation and leisure activities. Ideal for families and groups seeking a tranquil getaway with opportunities for water sports and family fun. | Swimming, Kayaking, Fishing, Beach area, Picnic spots |
| Vallée de la Beaver | Known for its beautiful landscapes and outdoor activities, this area is ideal for adventure seekers and those looking to explore nature. | Hiking trails, Mountain biking, Bird watching, Scenic overlooks, Nature photography spots |
| Église de Notre-Dame-de-Pontmain | A cultural and historical focal point, attracting visitors interested in history and architecture. It's a spiritual and cultural hub. | Historical church, Cultural events, Architecture tours, Local festivals |
| Circuit des Jardins | A garden route known for its beautiful landscapes and gardens, appealing to those interested in horticulture and scenic views. Attracts garden enthusiasts and photographers. | Botanical gardens, Floral exhibitions, Photography opportunities, Walking paths, Relaxing spaces |
| Station de ski de Val Saint-Côme | A ski resort attracting winter sports enthusiasts looking to enjoy skiing and snowboarding in a picturesque setting. Ideal for winter travelers. | Skiing & snowboarding, Snowshoeing, Winter festivals, Scenic chairlifts |
| Sentiers de la nature | Dedicated to walking and hiking trails, this area draws those who appreciate leisurely walks in nature and discovering local wildlife. | Walking trails, Guided nature tours, Wildlife observation, Photography spots, Scenic overlooks |
Understanding Airbnb License Requirements & STR Laws in Notre-Dame-de-Pontmain (2025)
Yes, Notre-Dame-de-Pontmain, Quebec, Canada enforces high STR regulations. Obtaining a license and ensuring compliance is almost certainly required according to current 2025 STR laws. Always verify the latest short term rental regulations and Airbnb license requirements directly with local government authorities for Notre-Dame-de-Pontmain to ensure full compliance before hosting.
(Source: AirROI data, 2025, based on 89% licensed listings)
Top Performing Airbnb Properties in Notre-Dame-de-Pontmain (2025)
Benchmark your potential! Explore examples of top-performing Airbnb properties in Notre-Dame-de-Pontmainbased on Trailing Twelve Month (TTM) revenue. Analyze their characteristics, revenue, occupancy rate, and ADR to understand what drives success in this market.
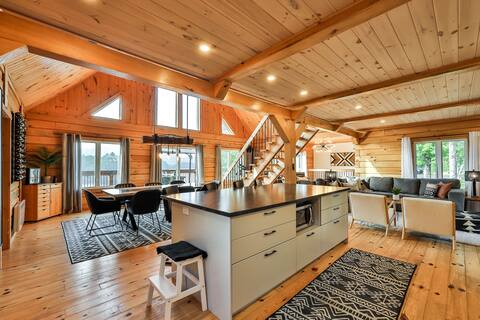
Rustik hideout
Entire Place • 4 bedrooms
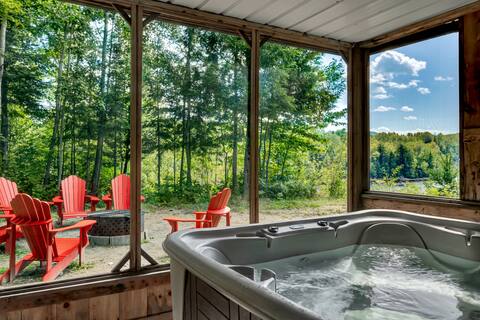
Heaven 47 - Cottage with Hot Tub & Huge Games Room
Entire Place • 3 bedrooms

Riverbank Oasis
Entire Place • 3 bedrooms
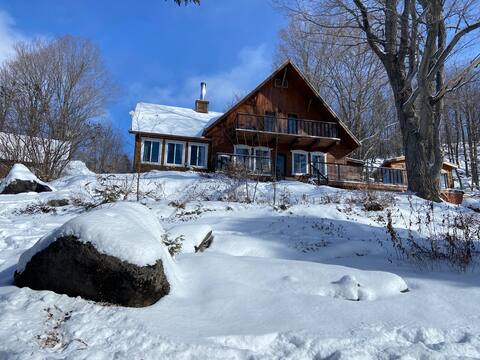
Chalet Ladouceur du Lac
Entire Place • 2 bedrooms
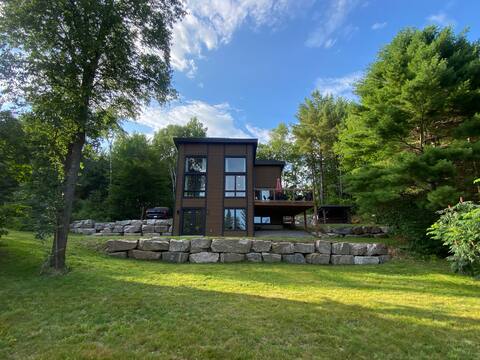
Mimozä: Contemporary, Beach & Spa
Entire Place • 3 bedrooms
2. Beautiful Chalet with spa on the waterfront
Entire Place • 3 bedrooms
Note: Performance varies based on location, size, amenities, seasonality, and management quality. Data reflects the past 12 months.
Top Performing Airbnb Hosts in Notre-Dame-de-Pontmain (2025)
Learn from the best! This table showcases top-performing Airbnb hosts in Notre-Dame-de-Pontmain based on the number of properties managed and estimated total revenue over the past year. Analyze their scale and performance metrics.
| Host Name | Properties | Grossing Revenue | Stay Reviews | Avg Rating |
|---|---|---|---|---|
| Solo Location | 2 | $96,605 | 24 | 2.44/5.0 |
| Gregg | 1 | $69,330 | 41 | 5.00/5.0 |
| David | 2 | $46,221 | 111 | 4.86/5.0 |
| Ram | 1 | $41,798 | 17 | 4.94/5.0 |
| Chloe | 1 | $37,633 | 12 | 4.92/5.0 |
| Valerie | 1 | $33,989 | 34 | 5.00/5.0 |
| Steven | 1 | $28,277 | 95 | 4.92/5.0 |
| Vincent | 1 | $27,190 | 59 | 4.83/5.0 |
| Karine | 1 | $25,188 | 99 | 4.91/5.0 |
| Jenny | 1 | $23,348 | 7 | 5.00/5.0 |
Analyzing the strategies of top hosts, such as their property selection, pricing, and guest communication, can offer valuable lessons for optimizing your own Airbnb operations in Notre-Dame-de-Pontmain.
Dive Deeper: Advanced Notre-Dame-de-Pontmain STR Market Data (2025)
Ready to unlock more insights? AirROI provides access to advanced metrics and comprehensive Airbnb data for Notre-Dame-de-Pontmain. Explore detailed analytics beyond this report to refine your investment strategy, optimize pricing, and maximize your vacation rental profits.
Explore Advanced MetricsNotre-Dame-de-Pontmain Short-Term Rental Market Composition (2025): Property & Room Types
Room Type Distribution
Property Type Distribution
Market Composition Insights for Notre-Dame-de-Pontmain
- The Notre-Dame-de-Pontmain Airbnb market composition is heavily skewed towards Entire Home/Apt listings, which make up 100% of the 19 active rentals. This indicates strong guest preference for privacy and space.
- Looking at the property type distribution in Notre-Dame-de-Pontmain, House properties are the most common (73.7%), reflecting the local real estate landscape.
- Houses represent a significant 73.7% portion, catering likely to families or larger groups.
Notre-Dame-de-Pontmain Airbnb Room Capacity Analysis (2025): Bedroom Distribution
Distribution of Listings by Number of Bedrooms
Room Capacity Insights for Notre-Dame-de-Pontmain
- The dominant room capacity in Notre-Dame-de-Pontmain is 3 bedrooms listings, making up 47.4% of the market. This suggests a strong demand for properties suitable for families or small groups.
- Together, 3 bedrooms and 2 bedrooms properties represent 68.5% of the active Airbnb listings in Notre-Dame-de-Pontmain, indicating a high concentration in these sizes.
- A significant 73.8% of listings offer 3+ bedrooms, catering to larger groups and families seeking more space in Notre-Dame-de-Pontmain.
Notre-Dame-de-Pontmain Vacation Rental Guest Capacity Trends (2025)
Distribution of Listings by Guest Capacity
Guest Capacity Insights for Notre-Dame-de-Pontmain
- The most common guest capacity trend in Notre-Dame-de-Pontmain vacation rentals is listings accommodating 8+ guests (57.9%). This suggests the primary traveler segment is likely larger groups.
- Properties designed for 8+ guests and 6 guests dominate the Notre-Dame-de-Pontmain STR market, accounting for 84.2% of listings.
- 89.5% of properties accommodate 6+ guests, serving the market segment for larger families or group travel in Notre-Dame-de-Pontmain.
- On average, properties in Notre-Dame-de-Pontmain are equipped to host 7.1 guests.
Notre-Dame-de-Pontmain Airbnb Booking Patterns (2025): Available vs. Booked Days
Available Days Distribution
Booked Days Distribution
Booking Pattern Insights for Notre-Dame-de-Pontmain
- The most common availability pattern in Notre-Dame-de-Pontmain falls within the 181-270 days range, representing 42.1% of listings. This suggests many properties have significant open periods on their calendars.
- Approximately 78.9% of listings show high availability (181+ days open annually), indicating potential for increased bookings or specific owner usage patterns.
- For booked days, the 91-180 days range is most frequent in Notre-Dame-de-Pontmain (42.1%), reflecting common guest stay durations or potential owner blocking patterns.
- A notable 26.3% of properties secure long booking periods (181+ days booked per year), highlighting successful long-term rental strategies or significant owner usage.
Notre-Dame-de-Pontmain Airbnb Minimum Stay Requirements Analysis
Distribution of Listings by Minimum Night Requirement
1 Night
1 listings
5.3% of total
2 Nights
10 listings
52.6% of total
3 Nights
2 listings
10.5% of total
7-29 Nights
1 listings
5.3% of total
30+ Nights
5 listings
26.3% of total
Key Insights
- The most prevalent minimum stay requirement in Notre-Dame-de-Pontmain is 2 Nights, adopted by 52.6% of listings. This highlights the market's preference for shorter, flexible bookings.
- A significant segment (26.3%) caters to monthly stays (30+ nights) in Notre-Dame-de-Pontmain, pointing to opportunities in the extended-stay market.
Recommendations
- Align with the market by considering a 2 Nights minimum stay, as 52.6% of Notre-Dame-de-Pontmain hosts use this setting.
- If feasible, allowing 1-night stays, especially midweek or during low season, could capture last-minute bookings, as only 5.3% currently do.
- A 2-night minimum appears standard (52.6%). Consider this for weekends or peak periods.
- Explore offering discounts for stays of 30+ nights to attract the 26.3% of the market seeking extended stays.
- Adjust minimum nights based on seasonality – potentially shorter during low season and longer during peak demand periods in Notre-Dame-de-Pontmain.
Notre-Dame-de-Pontmain Airbnb Cancellation Policy Trends Analysis (2025)
Flexible
4 listings
23.5% of total
Moderate
2 listings
11.8% of total
Firm
7 listings
41.2% of total
Strict
4 listings
23.5% of total
Cancellation Policy Insights for Notre-Dame-de-Pontmain
- The prevailing Airbnb cancellation policy trend in Notre-Dame-de-Pontmain is Firm, used by 41.2% of listings.
- A majority (64.7%) of hosts in Notre-Dame-de-Pontmain utilize Firm or Strict policies, indicating a market where hosts prioritize booking security.
Recommendations for Hosts
- Consider adopting a Firm policy to align with the 41.2% market standard in Notre-Dame-de-Pontmain.
- Regularly review your cancellation policy against competitors and market demand shifts in Notre-Dame-de-Pontmain.
Notre-Dame-de-Pontmain STR Booking Lead Time Analysis (2025)
Average Booking Lead Time by Month
Booking Lead Time Insights for Notre-Dame-de-Pontmain
- The overall average booking lead time for vacation rentals in Notre-Dame-de-Pontmain is 44 days.
- Guests book furthest in advance for stays during July (average 130 days), likely coinciding with peak travel demand or local events.
- The shortest booking windows occur for stays in May (average 16 days), indicating more last-minute travel plans during this time.
- Seasonally, Summer (93 days avg.) sees the longest lead times, while Spring (27 days avg.) has the shortest, reflecting typical travel planning cycles.
Recommendations for Hosts
- Use the overall average lead time (44 days) as a baseline for your pricing and availability strategy in Notre-Dame-de-Pontmain.
- For July stays, consider implementing length-of-stay discounts or slightly higher rates for bookings made less than 130 days out to capitalize on advance planning.
- Target marketing efforts for the Summer season well in advance (at least 93 days) to capture early planners.
- Monitor your own booking lead times against these Notre-Dame-de-Pontmain averages to identify opportunities for dynamic pricing adjustments.
Popular & Essential Airbnb Amenities in Notre-Dame-de-Pontmain (2025)
Amenity Prevalence
No amenities with partial availability (less than 100%) were found to display in the chart. All essential amenities might be present in all listings. Check insights below.
Amenity Insights for Notre-Dame-de-Pontmain
- Essential amenities in Notre-Dame-de-Pontmain that guests expect include: Oven, Kitchen, TV, Free parking on premises, Hot water, Bed linens, Dishes and silverware, BBQ grill, Heating, Refrigerator. Lacking these (any) could significantly impact bookings.
Recommendations for Hosts
- Ensure your listing includes all essential amenities for Notre-Dame-de-Pontmain: Oven, Kitchen, TV, Free parking on premises, Hot water, Bed linens, Dishes and silverware, BBQ grill, Heating, Refrigerator.
- Highlight unique or less common amenities you offer (e.g., hot tub, dedicated workspace, EV charger) in your listing description and photos.
- Regularly check competitor amenities in Notre-Dame-de-Pontmain to stay competitive.
Notre-Dame-de-Pontmain Airbnb Guest Demographics & Profile Analysis (2025)
Guest Profile Summary for Notre-Dame-de-Pontmain
- The typical guest profile for Airbnb in Notre-Dame-de-Pontmain consists of primarily domestic travelers (88%), often arriving from nearby Ottawa, typically belonging to the Post-2000s (Gen Z/Alpha) group (50%), primarily speaking English or French.
- Domestic travelers account for 87.6% of guests.
- Key international markets include Canada (87.6%) and France (3.3%).
- Top languages spoken are English (50%) followed by French (32%).
- A significant demographic segment is the Post-2000s (Gen Z/Alpha) group, representing 50% of guests.
Recommendations for Hosts
- Target domestic marketing efforts towards travelers from Ottawa and Gatineau.
- Tailor amenities and listing descriptions to appeal to the dominant Post-2000s (Gen Z/Alpha) demographic (e.g., highlight fast WiFi, smart home features, local guides).
- Highlight unique local experiences or amenities relevant to the primary guest profile.
- Consider seasonal promotions aligned with peak travel times for key origin markets.
Nearby Short-Term Rental Market Comparison
How does the Notre-Dame-de-Pontmain Airbnb market stack up against its neighbors? Compare key performance metrics like average monthly revenue, ADR, and occupancy rates in surrounding areas to understand the broader regional STR landscape.
| Market | Active Properties | Monthly Revenue | Daily Rate | Avg. Occupancy |
|---|---|---|---|---|
| Mille-Isles | 93 | $5,049 | $415.08 | 41% |
| Grenville-sur-la-Rouge | 32 | $4,226 | $362.40 | 41% |
| La Conception | 172 | $3,846 | $290.12 | 42% |
| Cantley | 22 | $3,741 | $242.96 | 50% |
| Sainte-Marguerite-du-Lac-Masson | 33 | $3,077 | $282.02 | 39% |
| Sainte-Anne-des-Lacs | 40 | $3,011 | $257.51 | 42% |
| Saint-Émile-de-Suffolk | 17 | $2,988 | $295.03 | 38% |
| Amherst | 103 | $2,957 | $249.33 | 39% |
| Entrelacs | 65 | $2,953 | $204.07 | 46% |
| Val-des-Monts | 120 | $2,907 | $234.15 | 47% |