North Hatley Airbnb Market Analysis 2025: Short Term Rental Data & Vacation Rental Statistics in Quebec, Canada
Is Airbnb profitable in North Hatley in 2025? Explore comprehensive Airbnb analytics for North Hatley, Quebec, Canada to uncover income potential. This 2025 STR market report for North Hatley, based on AirROI data from April 2024 to March 2025, reveals key trends in the niche market of 24 active listings.
Whether you're considering an Airbnb investment in North Hatley, optimizing your existing vacation rental, or exploring rental arbitrage opportunities, understanding the North Hatley Airbnb data is crucial. Navigating the high regulation landscape is key to maximizing your short term rental income potential. Let's dive into the specifics.
Key North Hatley Airbnb Performance Metrics Overview
Monthly Airbnb Revenue Variations & Income Potential in North Hatley (2025)
Understanding the monthly revenue variations for Airbnb listings in North Hatley is key to maximizing your short term rental income potential. Seasonality significantly impacts earnings. Our analysis, based on data from the past 12 months, shows that the peak revenue month for STRs in North Hatley is typically July, while May often presents the lowest earnings, highlighting opportunities for strategic pricing adjustments during shoulder and low seasons. Explore the typical Airbnb income in North Hatley across different performance tiers:
- Best-in-class properties (Top 10%) achieve $7,000+ monthly, often utilizing dynamic pricing and superior guest experiences.
- Strong performing properties (Top 25%) earn $3,821 or more, indicating effective management and desirable locations/amenities.
- Typical properties (Median) generate around $1,957 per month, representing the average market performance.
- Entry-level properties (Bottom 25%) see earnings around $1,256, often with potential for optimization.
Average Monthly Airbnb Earnings Trend in North Hatley
North Hatley Airbnb Occupancy Rate Trends (2025)
Maximize your bookings by understanding the North Hatley STR occupancy trends. Seasonal demand shifts significantly influence how often properties are booked. Typically, Julysees the highest demand (peak season occupancy), while January experiences the lowest (low season). Effective strategies, like adjusting minimum stays or offering promotions, can boost occupancy during slower periods. Here's how different property tiers perform in North Hatley:
- Best-in-class properties (Top 10%) achieve 74%+ occupancy, indicating high desirability and potentially optimized availability.
- Strong performing properties (Top 25%) maintain 61% or higher occupancy, suggesting good market fit and guest satisfaction.
- Typical properties (Median) have an occupancy rate around 46%.
- Entry-level properties (Bottom 25%) average 27% occupancy, potentially facing higher vacancy.
Average Monthly Occupancy Rate Trend in North Hatley
Average Daily Rate (ADR) Airbnb Trends in North Hatley (2025)
Effective short term rental pricing strategy in North Hatley involves understanding monthly ADR fluctuations. The Average Daily Rate (ADR) for Airbnb in North Hatley typically peaks in July and dips lowest during February. Leveraging Airbnb dynamic pricing tools or strategies based on this seasonality can significantly boost revenue. Here's a look at the typical nightly rates achieved:
- Best-in-class properties (Top 10%) command rates of $513+ per night, often due to premium features or locations.
- Strong performing properties (Top 25%) achieve nightly rates of $244 or more.
- Typical properties (Median) charge around $150 per night.
- Entry-level properties (Bottom 25%) earn around $115 per night.
Average Daily Rate (ADR) Trend by Month in North Hatley
Get Live North Hatley Market Intelligence 👇

Explore Real-time Analytics
Airbnb Seasonality Analysis & Trends in North Hatley (2025)
Peak Season (July, August, June)
- Revenue averages $4,603 per month
- Occupancy rates average 60.4%
- Daily rates average $230
Shoulder Season
- Revenue averages $2,695 per month
- Occupancy maintains around 41.4%
- Daily rates hold near $209
Low Season (February, May, November)
- Revenue drops to average $2,233 per month
- Occupancy decreases to average 36.1%
- Daily rates adjust to average $205
Seasonality Insights for North Hatley
- The Airbnb seasonality in North Hatley shows highly seasonal trends requiring careful strategy. While the sections above show seasonal averages, it's also insightful to look at the extremes:
- During the high season, the absolute peak month showcases North Hatley's highest earning potential, with monthly revenues capable of climbing to $5,052, occupancy reaching a high of 69.4%, and ADRs peaking at $235.
- Conversely, the slowest single month of the year, typically falling within the low season, marks the market's lowest point. In this month, revenue might dip to $2,212, occupancy could drop to 31.8%, and ADRs may adjust down to $192.
- Understanding both the seasonal averages and these monthly peaks and troughs in revenue, occupancy, and ADR is crucial for maximizing your Airbnb profit potential in North Hatley.
Seasonal Strategies for Maximizing Profit
- Peak Season: Maximize revenue through premium pricing and potentially longer minimum stays. Ensure high availability.
- Low Season: Offer competitive pricing, special promotions (e.g., extended stay discounts), and flexible cancellation policies. Target off-season travelers like remote workers or budget-conscious guests.
- Shoulder Seasons: Implement dynamic pricing that balances peak and low rates. Target weekend travelers or specific events. Offer slightly more flexible terms than peak season.
- Regularly analyze your own performance against these North Hatley seasonality benchmarks and adjust your pricing and availability strategy accordingly.
Best Areas for Airbnb Investment in North Hatley (2025)
Exploring the top neighborhoods for short-term rentals in North Hatley? This section highlights key areas, outlining why they are attractive for hosts and guests, along with notable local attractions. Consider these locations based on your target guest profile and investment strategy.
| Neighborhood / Area | Why Host Here? (Target Guests & Appeal) | Key Attractions & Landmarks |
|---|---|---|
| Lake Massawippi | A stunning lake perfect for summer vacations and water activities. With its picturesque setting, it attracts families and nature lovers looking for relaxation and outdoor fun. | Lake Massawippi, Water sports, Hiking trails, Local beaches, Scenic views |
| North Hatley Village | A charming village atmosphere with historic architecture and a close-knit community. Great for travelers seeking a quiet retreat with local culture and dining options. | North Hatley Park, Local boutiques, Cafes and restaurants, Village events, Scenic walks |
| Murphy Hill | Offers panoramic views and luxury accommodations. A favored area for those looking for tranquility and beautiful landscapes, ideal for romantic getaways. | Scenic viewpoints, Nature trails, Wildlife watching, Luxury cabins |
| Eastern Townships Wine Route | Known for its vineyards and scenic drives, this area attracts wine enthusiasts and couples looking for a romantic escape with gourmet dining options. | Vineyards, Wine tastings, Cycling routes, Gourmet restaurants, Cultural events |
| Ayer's Cliff | A small town with a rich history and access to outdoor activities. Perfect for families and travelers interested in regional history and lake activities. | Ayer's Cliff Marina, Historic sites, Nature parks, Boat rentals, Local markets |
| Pine Hill | A great spot for outdoor enthusiasts, with hiking and biking trails in the nearby hills. It appeals to those looking for adventure and nature. | Hiking trails, Biking paths, Scenic views, Nature photography, Wildlife |
| Magog | A larger town nearby with extensive amenities, shops, and restaurants. Attracts a range of travelers from families to couples seeking entertainment and leisure. | Lake Memphremagog, Shopping district, Dining options, Festivals, Beach access |
| Sutton | A picturesque town known for ski resorts and outdoor activities. It attracts both winter sports enthusiasts and summer vacationers enjoying a quaint town. | Ski Sutton, Local shops, Hiking trails, Festivals, Art galleries |
Understanding Airbnb License Requirements & STR Laws in North Hatley (2025)
Yes, North Hatley, Quebec, Canada enforces high STR regulations. Obtaining a license and ensuring compliance is almost certainly required according to current 2025 STR laws. Always verify the latest short term rental regulations and Airbnb license requirements directly with local government authorities for North Hatley to ensure full compliance before hosting.
(Source: AirROI data, 2025, based on 79% licensed listings)
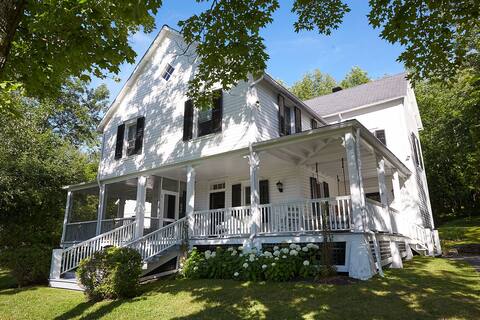
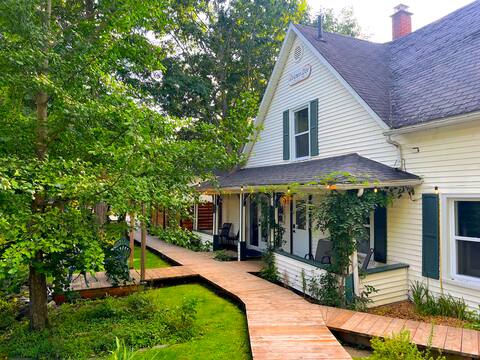
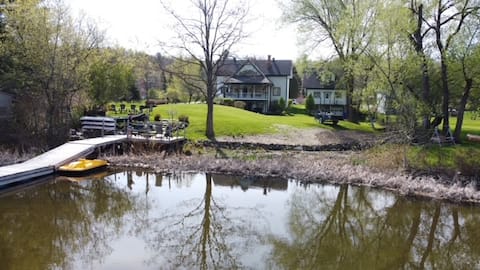
Top Performing Airbnb Properties in North Hatley (2025)
Benchmark your potential! Explore examples of top-performing Airbnb properties in North Hatleybased on Trailing Twelve Month (TTM) revenue. Analyze their characteristics, revenue, occupancy rate, and ADR to understand what drives success in this market.

3-level with spa and roof terrace
Entire Place • 6 bedrooms
North Hatley Lake House
Entire Place • 5 bedrooms
L'Orignal - Huge luxury chalet in North Hatley
Entire Place • 7 bedrooms
The House on the River - North Hatley
Entire Place • 3 bedrooms
Chalet Ours with spa and roof terrace
Entire Place • 4 bedrooms
Le Lynx - Luxury Chalet in North Hatley
Entire Place • 3 bedrooms
Note: Performance varies based on location, size, amenities, seasonality, and management quality. Data reflects the past 12 months.
Top Performing Airbnb Hosts in North Hatley (2025)
Learn from the best! This table showcases top-performing Airbnb hosts in North Hatley based on the number of properties managed and estimated total revenue over the past year. Analyze their scale and performance metrics.
| Host Name | Properties | Grossing Revenue | Stay Reviews | Avg Rating |
|---|---|---|---|---|
| Philippe | 4 | $222,593 | 152 | 4.98/5.0 |
| Chalets DeVille | 4 | $135,281 | 38 | 4.91/5.0 |
| Frédéric | 5 | $113,182 | 1475 | 4.84/5.0 |
| Abbey | 1 | $79,542 | 22 | 5.00/5.0 |
| Anne | 1 | $49,128 | 78 | 4.94/5.0 |
| Josée | 1 | $26,847 | 46 | 5.00/5.0 |
| Sandra | 1 | $17,538 | 123 | 4.89/5.0 |
| Host #36169250 | 1 | $13,194 | 8 | 5.00/5.0 |
| Esteban | 2 | $12,914 | 101 | 2.43/5.0 |
| Jean Francois | 1 | $10,797 | 65 | 4.82/5.0 |
Analyzing the strategies of top hosts, such as their property selection, pricing, and guest communication, can offer valuable lessons for optimizing your own Airbnb operations in North Hatley.
Dive Deeper: Advanced North Hatley STR Market Data (2025)
Ready to unlock more insights? AirROI provides access to advanced metrics and comprehensive Airbnb data for North Hatley. Explore detailed analytics beyond this report to refine your investment strategy, optimize pricing, and maximize your vacation rental profits.
Explore Advanced MetricsNorth Hatley Short-Term Rental Market Composition (2025): Property & Room Types
Room Type Distribution
Property Type Distribution
Market Composition Insights for North Hatley
- The North Hatley Airbnb market composition is heavily skewed towards Entire Home/Apt listings, which make up 95.8% of the 24 active rentals. This indicates strong guest preference for privacy and space.
- Looking at the property type distribution in North Hatley, House properties are the most common (45.8%), reflecting the local real estate landscape.
- Houses represent a significant 45.8% portion, catering likely to families or larger groups.
- Smaller segments like others, hotel/boutique, outdoor/unique (combined 12.6%) offer potential for unique stay experiences.
North Hatley Airbnb Room Capacity Analysis (2025): Bedroom Distribution
Distribution of Listings by Number of Bedrooms
Room Capacity Insights for North Hatley
- The dominant room capacity in North Hatley is 2 bedrooms listings, making up 33.3% of the market. This suggests a strong demand for properties suitable for couples or solo travelers.
- Together, 2 bedrooms and 3 bedrooms properties represent 54.1% of the active Airbnb listings in North Hatley, indicating a high concentration in these sizes.
- A significant 45.8% of listings offer 3+ bedrooms, catering to larger groups and families seeking more space in North Hatley.
North Hatley Vacation Rental Guest Capacity Trends (2025)
Distribution of Listings by Guest Capacity
Guest Capacity Insights for North Hatley
- The most common guest capacity trend in North Hatley vacation rentals is listings accommodating 8+ guests (33.3%). This suggests the primary traveler segment is likely larger groups.
- Properties designed for 8+ guests and 4 guests dominate the North Hatley STR market, accounting for 66.6% of listings.
- 58.3% of properties accommodate 6+ guests, serving the market segment for larger families or group travel in North Hatley.
- On average, properties in North Hatley are equipped to host 5.8 guests.
North Hatley Airbnb Booking Patterns (2025): Available vs. Booked Days
Available Days Distribution
Booked Days Distribution
Booking Pattern Insights for North Hatley
- The most common availability pattern in North Hatley falls within the 91-180 days range, representing 37.5% of listings. This suggests many properties have significant open periods on their calendars.
- Approximately 62.5% of listings show high availability (181+ days open annually), indicating potential for increased bookings or specific owner usage patterns.
- For booked days, the 181-270 days range is most frequent in North Hatley (37.5%), reflecting common guest stay durations or potential owner blocking patterns.
- A notable 37.5% of properties secure long booking periods (181+ days booked per year), highlighting successful long-term rental strategies or significant owner usage.
North Hatley Airbnb Minimum Stay Requirements Analysis
Distribution of Listings by Minimum Night Requirement
1 Night
3 listings
13% of total
2 Nights
4 listings
17.4% of total
3 Nights
3 listings
13% of total
7-29 Nights
7 listings
30.4% of total
30+ Nights
6 listings
26.1% of total
Key Insights
- The most prevalent minimum stay requirement in North Hatley is 7-29 Nights, adopted by 30.4% of listings. This highlights the market's preference for shorter, flexible bookings.
- A significant segment (26.1%) caters to monthly stays (30+ nights) in North Hatley, pointing to opportunities in the extended-stay market.
Recommendations
- Align with the market by considering a 7-29 Nights minimum stay, as 30.4% of North Hatley hosts use this setting.
- If feasible, allowing 1-night stays, especially midweek or during low season, could capture last-minute bookings, as only 13% currently do.
- Explore offering discounts for stays of 30+ nights to attract the 26.1% of the market seeking extended stays.
- Adjust minimum nights based on seasonality – potentially shorter during low season and longer during peak demand periods in North Hatley.
North Hatley Airbnb Cancellation Policy Trends Analysis (2025)
Super Strict 60 Days
2 listings
8.7% of total
Super Strict 30 Days
1 listings
4.3% of total
Flexible
7 listings
30.4% of total
Moderate
3 listings
13% of total
Firm
7 listings
30.4% of total
Strict
3 listings
13% of total
Cancellation Policy Insights for North Hatley
- The prevailing Airbnb cancellation policy trend in North Hatley is Flexible, used by 30.4% of listings.
- There's a relatively balanced mix between guest-friendly (43.4%) and stricter (43.4%) policies, offering choices for different guest needs.
Recommendations for Hosts
- Consider adopting a Flexible policy to align with the 30.4% market standard in North Hatley.
- Using a Strict policy might deter some guests, as only 13% of listings use it. Evaluate if potential revenue protection outweighs possible lower booking rates.
- Regularly review your cancellation policy against competitors and market demand shifts in North Hatley.
North Hatley STR Booking Lead Time Analysis (2025)
Average Booking Lead Time by Month
Booking Lead Time Insights for North Hatley
- The overall average booking lead time for vacation rentals in North Hatley is 82 days.
- Guests book furthest in advance for stays during July (average 132 days), likely coinciding with peak travel demand or local events.
- The shortest booking windows occur for stays in March (average 48 days), indicating more last-minute travel plans during this time.
- Seasonally, Summer (118 days avg.) sees the longest lead times, while Winter (67 days avg.) has the shortest, reflecting typical travel planning cycles.
Recommendations for Hosts
- Use the overall average lead time (82 days) as a baseline for your pricing and availability strategy in North Hatley.
- For July stays, consider implementing length-of-stay discounts or slightly higher rates for bookings made less than 132 days out to capitalize on advance planning.
- Target marketing efforts for the Summer season well in advance (at least 118 days) to capture early planners.
- Monitor your own booking lead times against these North Hatley averages to identify opportunities for dynamic pricing adjustments.
Popular & Essential Airbnb Amenities in North Hatley (2025)
Amenity Prevalence
Amenity Insights for North Hatley
- Essential amenities in North Hatley that guests expect include: Kitchen, Wifi, Heating, Free parking on premises, Smoke alarm, Fire extinguisher, Hot water, Washer, Essentials, Cooking basics. Lacking these (any) could significantly impact bookings.
Recommendations for Hosts
- Ensure your listing includes all essential amenities for North Hatley: Kitchen, Wifi, Heating, Free parking on premises, Smoke alarm, Fire extinguisher, Hot water, Washer, Essentials, Cooking basics.
- Prioritize adding missing essentials: Fire extinguisher, Hot water, Washer, Essentials, Cooking basics.
- Highlight unique or less common amenities you offer (e.g., hot tub, dedicated workspace, EV charger) in your listing description and photos.
- Regularly check competitor amenities in North Hatley to stay competitive.
North Hatley Airbnb Guest Demographics & Profile Analysis (2025)
Guest Profile Summary for North Hatley
- The typical guest profile for Airbnb in North Hatley consists of a mix of domestic (65%) and international guests, often arriving from nearby Montreal, typically belonging to the Post-2000s (Gen Z/Alpha) group (50%), primarily speaking English or French.
- Domestic travelers account for 64.5% of guests.
- Key international markets include Canada (64.5%) and United States (27.2%).
- Top languages spoken are English (49.2%) followed by French (32.8%).
- A significant demographic segment is the Post-2000s (Gen Z/Alpha) group, representing 50% of guests.
Recommendations for Hosts
- Target domestic marketing efforts towards travelers from Montreal and Ottawa.
- Tailor amenities and listing descriptions to appeal to the dominant Post-2000s (Gen Z/Alpha) demographic (e.g., highlight fast WiFi, smart home features, local guides).
- Highlight unique local experiences or amenities relevant to the primary guest profile.
- Consider seasonal promotions aligned with peak travel times for key origin markets.
Nearby Short-Term Rental Market Comparison
How does the North Hatley Airbnb market stack up against its neighbors? Compare key performance metrics like average monthly revenue, ADR, and occupancy rates in surrounding areas to understand the broader regional STR landscape.
| Market | Active Properties | Monthly Revenue | Daily Rate | Avg. Occupancy |
|---|---|---|---|---|
| Jefferson | 28 | $5,920 | $432.83 | 50% |
| Stowe | 842 | $4,757 | $474.92 | 41% |
| Otisfield | 11 | $4,471 | $391.16 | 43% |
| Saint-Denis-de-Brompton | 28 | $4,459 | $383.13 | 34% |
| Dalton | 13 | $4,397 | $359.89 | 45% |
| Calais | 16 | $4,320 | $299.79 | 49% |
| Woodstock | 45 | $4,116 | $385.01 | 44% |
| Waterloo | 11 | $4,092 | $357.06 | 37% |
| Topsham | 13 | $3,952 | $265.51 | 50% |
| Jericho | 23 | $3,945 | $309.71 | 54% |