Lévis Airbnb Market Analysis 2025: Short Term Rental Data & Vacation Rental Statistics in Quebec, Canada
Is Airbnb profitable in Lévis in 2025? Explore comprehensive Airbnb analytics for Lévis, Quebec, Canada to uncover income potential. This 2025 STR market report for Lévis, based on AirROI data from April 2024 to March 2025, reveals key trends in the niche market of 182 active listings.
Whether you're considering an Airbnb investment in Lévis, optimizing your existing vacation rental, or exploring rental arbitrage opportunities, understanding the Lévis Airbnb data is crucial. Navigating the high regulation landscape is key to maximizing your short term rental income potential. Let's dive into the specifics.
Key Lévis Airbnb Performance Metrics Overview
Monthly Airbnb Revenue Variations & Income Potential in Lévis (2025)
Understanding the monthly revenue variations for Airbnb listings in Lévis is key to maximizing your short term rental income potential. Seasonality significantly impacts earnings. Our analysis, based on data from the past 12 months, shows that the peak revenue month for STRs in Lévis is typically August, while February often presents the lowest earnings, highlighting opportunities for strategic pricing adjustments during shoulder and low seasons. Explore the typical Airbnb income in Lévis across different performance tiers:
- Best-in-class properties (Top 10%) achieve $3,669+ monthly, often utilizing dynamic pricing and superior guest experiences.
- Strong performing properties (Top 25%) earn $2,513 or more, indicating effective management and desirable locations/amenities.
- Typical properties (Median) generate around $1,439 per month, representing the average market performance.
- Entry-level properties (Bottom 25%) see earnings around $672, often with potential for optimization.
Average Monthly Airbnb Earnings Trend in Lévis
Lévis Airbnb Occupancy Rate Trends (2025)
Maximize your bookings by understanding the Lévis STR occupancy trends. Seasonal demand shifts significantly influence how often properties are booked. Typically, Augustsees the highest demand (peak season occupancy), while February experiences the lowest (low season). Effective strategies, like adjusting minimum stays or offering promotions, can boost occupancy during slower periods. Here's how different property tiers perform in Lévis:
- Best-in-class properties (Top 10%) achieve 83%+ occupancy, indicating high desirability and potentially optimized availability.
- Strong performing properties (Top 25%) maintain 68% or higher occupancy, suggesting good market fit and guest satisfaction.
- Typical properties (Median) have an occupancy rate around 46%.
- Entry-level properties (Bottom 25%) average 22% occupancy, potentially facing higher vacancy.
Average Monthly Occupancy Rate Trend in Lévis
Average Daily Rate (ADR) Airbnb Trends in Lévis (2025)
Effective short term rental pricing strategy in Lévis involves understanding monthly ADR fluctuations. The Average Daily Rate (ADR) for Airbnb in Lévis typically peaks in July and dips lowest during February. Leveraging Airbnb dynamic pricing tools or strategies based on this seasonality can significantly boost revenue. Here's a look at the typical nightly rates achieved:
- Best-in-class properties (Top 10%) command rates of $208+ per night, often due to premium features or locations.
- Strong performing properties (Top 25%) achieve nightly rates of $121 or more.
- Typical properties (Median) charge around $88 per night.
- Entry-level properties (Bottom 25%) earn around $53 per night.
Average Daily Rate (ADR) Trend by Month in Lévis
Get Live Lévis Market Intelligence 👇

Explore Real-time Analytics
Airbnb Seasonality Analysis & Trends in Lévis (2025)
Peak Season (August, July, June)
- Revenue averages $2,591 per month
- Occupancy rates average 58.1%
- Daily rates average $119
Shoulder Season
- Revenue averages $1,773 per month
- Occupancy maintains around 44.4%
- Daily rates hold near $114
Low Season (January, February, March)
- Revenue drops to average $1,367 per month
- Occupancy decreases to average 37.2%
- Daily rates adjust to average $110
Seasonality Insights for Lévis
- The Airbnb seasonality in Lévis shows highly seasonal trends requiring careful strategy. While the sections above show seasonal averages, it's also insightful to look at the extremes:
- During the high season, the absolute peak month showcases Lévis's highest earning potential, with monthly revenues capable of climbing to $2,806, occupancy reaching a high of 64.3%, and ADRs peaking at $120.
- Conversely, the slowest single month of the year, typically falling within the low season, marks the market's lowest point. In this month, revenue might dip to $1,329, occupancy could drop to 36.8%, and ADRs may adjust down to $108.
- Understanding both the seasonal averages and these monthly peaks and troughs in revenue, occupancy, and ADR is crucial for maximizing your Airbnb profit potential in Lévis.
Seasonal Strategies for Maximizing Profit
- Peak Season: Maximize revenue through premium pricing and potentially longer minimum stays. Ensure high availability.
- Low Season: Offer competitive pricing, special promotions (e.g., extended stay discounts), and flexible cancellation policies. Target off-season travelers like remote workers or budget-conscious guests.
- Shoulder Seasons: Implement dynamic pricing that balances peak and low rates. Target weekend travelers or specific events. Offer slightly more flexible terms than peak season.
- Regularly analyze your own performance against these Lévis seasonality benchmarks and adjust your pricing and availability strategy accordingly.
Best Areas for Airbnb Investment in Lévis (2025)
Exploring the top neighborhoods for short-term rentals in Lévis? This section highlights key areas, outlining why they are attractive for hosts and guests, along with notable local attractions. Consider these locations based on your target guest profile and investment strategy.
| Neighborhood / Area | Why Host Here? (Target Guests & Appeal) | Key Attractions & Landmarks |
|---|---|---|
| Old Lévis | Charming historical district with picturesque views of the Château Frontenac and the St. Lawrence River. This area attracts tourists looking for a quaint and authentic Quebec experience, steps away from local shops and cafes. | Lévis Forts National Historic Site, Parc de la Marina, Old Lévis Market, Église de la Nativité-de-Notre-Dame, Promenade de la Chaudière |
| St. Romuald | Family-friendly neighborhood known for its spacious homes and parks. Perfect for hosting families and larger groups seeking a peaceful environment close to amenities. | Parc de la Rivière-aux-Rochers, Parc du Bicentenaire, Centre Récréatif St. Romuald, Restaurants and cafes nearby |
| Charny | Residential area with access to parks and nature, drawing people who appreciate outdoor activities and nature walks. Ideal for hosting guests who want to explore the recreational sides of Lévis. | Parc de la Paix, Parc des Chutes-de-la-Chaudière, Lévis Golf Club, walking trails along the river |
| Lauzon | Vibrant community area known for local shops and eateries. A great spot for budget travelers and those looking to experience local life in Lévis. | Parc Lauzon, Local flea markets, Lauzon Bistro, Bord de l'eau picnic area |
| Les Chutes | A scenic area featuring beautiful waterfalls and green spaces. Appeals to nature lovers and those looking for a getaway close to natural beauty. | Chutes de la Chaudière, Parc de la Chaudière, Nature trails, Picnic areas |
| Desjardins | Conveniently located near shopping and restaurants, Desjardins is ideal for guests who prioritize accessibility and amenities during their stay in Lévis. | Laurentien Shopping Centre, Les Galeries Chagnon, Cinemas and theaters, Public transport access |
| Saint-Nicolas | A peaceful neighbourhood with a strong community feel. Perfect for long-term renters wanting to stay in a quieter area while still being connected to main attractions. | Parc de la Rivière-aux-Cerises, Community events and markets, Lettres et Écrits cultural centre |
| Levis Downtown | The downtown area offers vibrant city life with shops, dining, and nightlife. A prime spot for urban tourists eager to explore city attractions and local culture. | Place du Marché, Local restaurants and bars, Art galleries, Cultural events throughout the year |
Understanding Airbnb License Requirements & STR Laws in Lévis (2025)
Yes, Lévis, Quebec, Canada enforces high STR regulations. Obtaining a license and ensuring compliance is almost certainly required according to current 2025 STR laws. Always verify the latest short term rental regulations and Airbnb license requirements directly with local government authorities for Lévis to ensure full compliance before hosting.
(Source: AirROI data, 2025, based on 68% licensed listings)
Top Performing Airbnb Properties in Lévis (2025)
Benchmark your potential! Explore examples of top-performing Airbnb properties in Lévisbased on Trailing Twelve Month (TTM) revenue. Analyze their characteristics, revenue, occupancy rate, and ADR to understand what drives success in this market.

Valvak Castle | Unique & Magical | Spa & BBQ
Entire Place • 4 bedrooms
2 Apart 5BDS 2BA 4Parking 2Terrace Best CastleView
Entire Place • 5 bedrooms
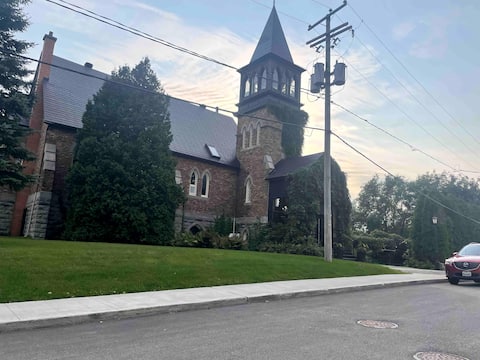
St-Andrews & Spa Church
Entire Place • 2 bedrooms
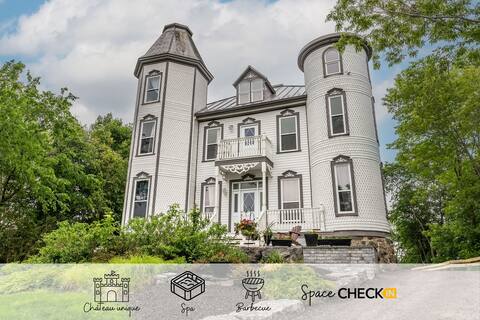
The unique Valvak Castle | Spa & BBQ | Fireplace
Entire Place • 6 bedrooms

The St-Louis
Entire Place • 2 bedrooms

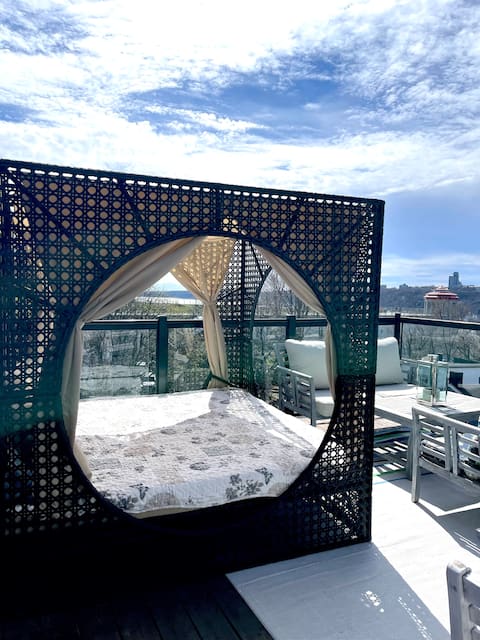
2 Aparts Terraces 26 Guests Frontenac View
Entire Place • 9 bedrooms
Note: Performance varies based on location, size, amenities, seasonality, and management quality. Data reflects the past 12 months.
Top Performing Airbnb Hosts in Lévis (2025)
Learn from the best! This table showcases top-performing Airbnb hosts in Lévis based on the number of properties managed and estimated total revenue over the past year. Analyze their scale and performance metrics.
| Host Name | Properties | Grossing Revenue | Stay Reviews | Avg Rating |
|---|---|---|---|---|
| Lesya | 12 | $386,147 | 1074 | 4.93/5.0 |
| Josiane | 5 | $242,791 | 182 | 2.96/5.0 |
| Christian | 5 | $193,751 | 683 | 4.94/5.0 |
| Patrick | 6 | $143,270 | 1406 | 4.85/5.0 |
| Andre | 12 | $139,636 | 643 | 4.79/5.0 |
| Marc | 2 | $136,324 | 103 | 4.87/5.0 |
| Jean-François Et Lucie | 4 | $130,296 | 1589 | 4.93/5.0 |
| Vincent | 3 | $108,080 | 520 | 4.88/5.0 |
| Nadia | 10 | $95,379 | 436 | 4.42/5.0 |
| Hotesaison.Ca | 9 | $95,308 | 214 | 4.63/5.0 |
Analyzing the strategies of top hosts, such as their property selection, pricing, and guest communication, can offer valuable lessons for optimizing your own Airbnb operations in Lévis.
Dive Deeper: Advanced Lévis STR Market Data (2025)
Ready to unlock more insights? AirROI provides access to advanced metrics and comprehensive Airbnb data for Lévis. Explore detailed analytics beyond this report to refine your investment strategy, optimize pricing, and maximize your vacation rental profits.
Explore Advanced MetricsLévis Short-Term Rental Market Composition (2025): Property & Room Types
Room Type Distribution
Property Type Distribution
Market Composition Insights for Lévis
- The Lévis Airbnb market composition is heavily skewed towards Entire Home/Apt listings, which make up 69.2% of the 182 active rentals. This indicates strong guest preference for privacy and space.
- However, a notable 28% share for Private Rooms suggests opportunities for budget-conscious travelers or hosts renting out spare rooms.
- Looking at the property type distribution in Lévis, Apartment/Condo properties are the most common (57.7%), reflecting the local real estate landscape.
- Houses represent a significant 18.7% portion, catering likely to families or larger groups.
- The presence of 19.2% Hotel/Boutique listings indicates integration with traditional hospitality.
- Smaller segments like unique stays, others (combined 4.3%) offer potential for unique stay experiences.
Lévis Airbnb Room Capacity Analysis (2025): Bedroom Distribution
Distribution of Listings by Number of Bedrooms
Room Capacity Insights for Lévis
- The dominant room capacity in Lévis is 1 bedroom listings, making up 38.5% of the market. This suggests a strong demand for properties suitable for couples or solo travelers.
- Together, 1 bedroom and 2 bedrooms properties represent 59.9% of the active Airbnb listings in Lévis, indicating a high concentration in these sizes.
Lévis Vacation Rental Guest Capacity Trends (2025)
Distribution of Listings by Guest Capacity
Guest Capacity Insights for Lévis
- The most common guest capacity trend in Lévis vacation rentals is listings accommodating 4 guests (21.4%). This suggests the primary traveler segment is likely small families or groups.
- Properties designed for 4 guests and 2 guests dominate the Lévis STR market, accounting for 42.3% of listings.
- 25.8% of properties accommodate 6+ guests, serving the market segment for larger families or group travel in Lévis.
- On average, properties in Lévis are equipped to host 3.5 guests.
Lévis Airbnb Booking Patterns (2025): Available vs. Booked Days
Available Days Distribution
Booked Days Distribution
Booking Pattern Insights for Lévis
- The most common availability pattern in Lévis falls within the 181-270 days range, representing 34.1% of listings. This suggests many properties have significant open periods on their calendars.
- Approximately 67.1% of listings show high availability (181+ days open annually), indicating potential for increased bookings or specific owner usage patterns.
- For booked days, the 91-180 days range is most frequent in Lévis (36.8%), reflecting common guest stay durations or potential owner blocking patterns.
- A notable 33.5% of properties secure long booking periods (181+ days booked per year), highlighting successful long-term rental strategies or significant owner usage.
Lévis Airbnb Minimum Stay Requirements Analysis
Distribution of Listings by Minimum Night Requirement
1 Night
49 listings
28.5% of total
2 Nights
37 listings
21.5% of total
3 Nights
5 listings
2.9% of total
4-6 Nights
4 listings
2.3% of total
7-29 Nights
3 listings
1.7% of total
30+ Nights
74 listings
43% of total
Key Insights
- The most prevalent minimum stay requirement in Lévis is 30+ Nights, adopted by 43% of listings. This highlights the market's preference for longer commitments.
- A significant segment (43%) caters to monthly stays (30+ nights) in Lévis, pointing to opportunities in the extended-stay market.
Recommendations
- Align with the market by considering a 30+ Nights minimum stay, as 43% of Lévis hosts use this setting.
- If feasible, allowing 1-night stays, especially midweek or during low season, could capture last-minute bookings, as only 28.5% currently do.
- Explore offering discounts for stays of 30+ nights to attract the 43% of the market seeking extended stays.
- Adjust minimum nights based on seasonality – potentially shorter during low season and longer during peak demand periods in Lévis.
Lévis Airbnb Cancellation Policy Trends Analysis (2025)
Super Strict 30 Days
1 listings
0.6% of total
Flexible
30 listings
18.4% of total
Moderate
52 listings
31.9% of total
Firm
30 listings
18.4% of total
Strict
50 listings
30.7% of total
Cancellation Policy Insights for Lévis
- The prevailing Airbnb cancellation policy trend in Lévis is Moderate, used by 31.9% of listings.
- There's a relatively balanced mix between guest-friendly (50.3%) and stricter (49.1%) policies, offering choices for different guest needs.
Recommendations for Hosts
- Consider adopting a Moderate policy to align with the 31.9% market standard in Lévis.
- With 30.7% using Strict terms, this is a viable option in Lévis, particularly for high-value properties or during peak demand periods.
- Regularly review your cancellation policy against competitors and market demand shifts in Lévis.
Lévis STR Booking Lead Time Analysis (2025)
Average Booking Lead Time by Month
Booking Lead Time Insights for Lévis
- The overall average booking lead time for vacation rentals in Lévis is 57 days.
- Guests book furthest in advance for stays during July (average 86 days), likely coinciding with peak travel demand or local events.
- The shortest booking windows occur for stays in February (average 39 days), indicating more last-minute travel plans during this time.
- Seasonally, Summer (78 days avg.) sees the longest lead times, while Winter (47 days avg.) has the shortest, reflecting typical travel planning cycles.
Recommendations for Hosts
- Use the overall average lead time (57 days) as a baseline for your pricing and availability strategy in Lévis.
- For July stays, consider implementing length-of-stay discounts or slightly higher rates for bookings made less than 86 days out to capitalize on advance planning.
- Target marketing efforts for the Summer season well in advance (at least 78 days) to capture early planners.
- Monitor your own booking lead times against these Lévis averages to identify opportunities for dynamic pricing adjustments.
Popular & Essential Airbnb Amenities in Lévis (2025)
Amenity Prevalence
Amenity Insights for Lévis
- Essential amenities in Lévis that guests expect include: Wifi, Smoke alarm, Heating, Hot water, Kitchen, TV. Lacking these (any) could significantly impact bookings.
- Popular amenities like Essentials, Free parking on premises, Coffee maker are common but not universal. Offering these can provide a competitive edge.
Recommendations for Hosts
- Ensure your listing includes all essential amenities for Lévis: Wifi, Smoke alarm, Heating, Hot water, Kitchen, TV.
- Prioritize adding missing essentials: Wifi, Smoke alarm, Heating, Hot water, Kitchen, TV.
- Consider adding popular differentiators like Essentials or Free parking on premises to increase appeal.
- Highlight unique or less common amenities you offer (e.g., hot tub, dedicated workspace, EV charger) in your listing description and photos.
- Regularly check competitor amenities in Lévis to stay competitive.
Lévis Airbnb Guest Demographics & Profile Analysis (2025)
Guest Profile Summary for Lévis
- The typical guest profile for Airbnb in Lévis consists of a mix of domestic (60%) and international guests, often arriving from nearby Montreal, typically belonging to the Post-2000s (Gen Z/Alpha) group (50%), primarily speaking English or French.
- Domestic travelers account for 59.8% of guests.
- Key international markets include Canada (59.8%) and United States (20.6%).
- Top languages spoken are English (50.2%) followed by French (26.1%).
- A significant demographic segment is the Post-2000s (Gen Z/Alpha) group, representing 50% of guests.
Recommendations for Hosts
- Balance marketing efforts between domestic and international channels based on the guest mix.
- Tailor amenities and listing descriptions to appeal to the dominant Post-2000s (Gen Z/Alpha) demographic (e.g., highlight fast WiFi, smart home features, local guides).
- Highlight unique local experiences or amenities relevant to the primary guest profile.
- Consider seasonal promotions aligned with peak travel times for key origin markets.
Nearby Short-Term Rental Market Comparison
How does the Lévis Airbnb market stack up against its neighbors? Compare key performance metrics like average monthly revenue, ADR, and occupancy rates in surrounding areas to understand the broader regional STR landscape.
| Market | Active Properties | Monthly Revenue | Daily Rate | Avg. Occupancy |
|---|---|---|---|---|
| Saint-Denis-de-Brompton | 28 | $4,459 | $383.13 | 34% |
| Waterloo | 11 | $4,092 | $357.06 | 37% |
| Shannon | 25 | $3,918 | $240.28 | 51% |
| Shefford | 26 | $3,538 | $254.63 | 43% |
| Lac-Beauport | 56 | $3,512 | $213.74 | 52% |
| Stanstead (Canton) | 40 | $3,462 | $234.29 | 46% |
| Saint-François-de-l'Île-d'Orléans | 12 | $3,291 | $336.24 | 39% |
| Saint-Basile | 12 | $3,221 | $180.24 | 52% |
| Les Éboulements | 137 | $3,141 | $227.50 | 42% |
| Saint-Roch-de-Mékinac | 11 | $3,108 | $314.58 | 41% |