Laval (administrative region) Airbnb Market Analysis 2025: Short Term Rental Data & Vacation Rental Statistics in Quebec, Canada
Is Airbnb profitable in Laval (administrative region) in 2025? Explore comprehensive Airbnb analytics for Laval (administrative region), Quebec, Canada to uncover income potential. This 2025 STR market report for Laval (administrative region), based on AirROI data from April 2024 to March 2025, reveals key trends in the market of 242 active listings.
Whether you're considering an Airbnb investment in Laval (administrative region), optimizing your existing vacation rental, or exploring rental arbitrage opportunities, understanding the Laval (administrative region) Airbnb data is crucial. Navigating the high regulation landscape is key to maximizing your short term rental income potential. Let's dive into the specifics.
Key Laval (administrative region) Airbnb Performance Metrics Overview
Monthly Airbnb Revenue Variations & Income Potential in Laval (administrative region) (2025)
Understanding the monthly revenue variations for Airbnb listings in Laval (administrative region) is key to maximizing your short term rental income potential. Seasonality significantly impacts earnings. Our analysis, based on data from the past 12 months, shows that the peak revenue month for STRs in Laval (administrative region) is typically August, while March often presents the lowest earnings, highlighting opportunities for strategic pricing adjustments during shoulder and low seasons. Explore the typical Airbnb income in Laval (administrative region) across different performance tiers:
- Best-in-class properties (Top 10%) achieve $3,765+ monthly, often utilizing dynamic pricing and superior guest experiences.
- Strong performing properties (Top 25%) earn $2,286 or more, indicating effective management and desirable locations/amenities.
- Typical properties (Median) generate around $1,267 per month, representing the average market performance.
- Entry-level properties (Bottom 25%) see earnings around $572, often with potential for optimization.
Average Monthly Airbnb Earnings Trend in Laval (administrative region)
Laval (administrative region) Airbnb Occupancy Rate Trends (2025)
Maximize your bookings by understanding the Laval (administrative region) STR occupancy trends. Seasonal demand shifts significantly influence how often properties are booked. Typically, Augustsees the highest demand (peak season occupancy), while March experiences the lowest (low season). Effective strategies, like adjusting minimum stays or offering promotions, can boost occupancy during slower periods. Here's how different property tiers perform in Laval (administrative region):
- Best-in-class properties (Top 10%) achieve 85%+ occupancy, indicating high desirability and potentially optimized availability.
- Strong performing properties (Top 25%) maintain 71% or higher occupancy, suggesting good market fit and guest satisfaction.
- Typical properties (Median) have an occupancy rate around 47%.
- Entry-level properties (Bottom 25%) average 24% occupancy, potentially facing higher vacancy.
Average Monthly Occupancy Rate Trend in Laval (administrative region)
Average Daily Rate (ADR) Airbnb Trends in Laval (administrative region) (2025)
Effective short term rental pricing strategy in Laval (administrative region) involves understanding monthly ADR fluctuations. The Average Daily Rate (ADR) for Airbnb in Laval (administrative region) typically peaks in December and dips lowest during February. Leveraging Airbnb dynamic pricing tools or strategies based on this seasonality can significantly boost revenue. Here's a look at the typical nightly rates achieved:
- Best-in-class properties (Top 10%) command rates of $176+ per night, often due to premium features or locations.
- Strong performing properties (Top 25%) achieve nightly rates of $117 or more.
- Typical properties (Median) charge around $73 per night.
- Entry-level properties (Bottom 25%) earn around $50 per night.
Average Daily Rate (ADR) Trend by Month in Laval (administrative region)
Get Live Laval (administrative region) Market Intelligence 👇
.png)
Explore Real-time Analytics
Airbnb Seasonality Analysis & Trends in Laval (administrative region) (2025)
Peak Season (August, June, May)
- Revenue averages $2,280 per month
- Occupancy rates average 50.9%
- Daily rates average $102
Shoulder Season
- Revenue averages $1,779 per month
- Occupancy maintains around 50.6%
- Daily rates hold near $100
Low Season (January, February, March)
- Revenue drops to average $1,170 per month
- Occupancy decreases to average 39.5%
- Daily rates adjust to average $94
Seasonality Insights for Laval (administrative region)
- The Airbnb seasonality in Laval (administrative region) shows highly seasonal trends requiring careful strategy. While the sections above show seasonal averages, it's also insightful to look at the extremes:
- During the high season, the absolute peak month showcases Laval (administrative region)'s highest earning potential, with monthly revenues capable of climbing to $2,402, occupancy reaching a high of 65.2%, and ADRs peaking at $103.
- Conversely, the slowest single month of the year, typically falling within the low season, marks the market's lowest point. In this month, revenue might dip to $1,103, occupancy could drop to 37.6%, and ADRs may adjust down to $92.
- Understanding both the seasonal averages and these monthly peaks and troughs in revenue, occupancy, and ADR is crucial for maximizing your Airbnb profit potential in Laval (administrative region).
Seasonal Strategies for Maximizing Profit
- Peak Season: Maximize revenue through premium pricing and potentially longer minimum stays. Ensure high availability.
- Low Season: Offer competitive pricing, special promotions (e.g., extended stay discounts), and flexible cancellation policies. Target off-season travelers like remote workers or budget-conscious guests.
- Shoulder Seasons: Implement dynamic pricing that balances peak and low rates. Target weekend travelers or specific events. Offer slightly more flexible terms than peak season.
- Regularly analyze your own performance against these Laval (administrative region) seasonality benchmarks and adjust your pricing and availability strategy accordingly.
Best Areas for Airbnb Investment in Laval (administrative region) (2025)
Exploring the top neighborhoods for short-term rentals in Laval (administrative region)? This section highlights key areas, outlining why they are attractive for hosts and guests, along with notable local attractions. Consider these locations based on your target guest profile and investment strategy.
| Neighborhood / Area | Why Host Here? (Target Guests & Appeal) | Key Attractions & Landmarks |
|---|---|---|
| Chomedey | Chomedey is a vibrant area in Laval known for its shopping centers, restaurants, and family-friendly recreation. It's an ideal location for hosting guests who want easy access to the city amenities, with great parks and attractions nearby. | Centropolis, Place Laval, Cosmodôme, SkyVenture Laval, Parc de la Rivière-des-Mille-Îles |
| Sainte-Dorothée | This picturesque area by the waterfront is popular for its scenic views and calm atmosphere. Perfect for guests looking for a peaceful retreat while being close to urban conveniences. | Parc-nature de la rivière des Mille Îles, Sainte-Dorothée Golf Club, Laval Aquarium |
| Auteuil | Auteuil offers a blend of suburban charm and accessibility to Laval's main attractions. It's attractive for families and business travelers alike, providing a great local experience. | Parc de la Frayère, Église Saint-François de Sales, Cinéma Cité de Laval |
| Laval-des-Rapides | Laval-des-Rapides is strategically located with easy access to public transport and major highways. Great for guests who wish to explore Montreal while staying in a quieter environment. | Parc des Prairies, Montréal Science Centre, Bois de la Source Park |
| Vimont | Vimont is a growing neighborhood known for its friendly community and educational institutions. It's an excellent area for long-term stays, appealing to families and working professionals. | Parc de la Cité, Cégep de Saint-Laurent, Parc de la Rivière des Mille Îles |
| Laval-Ouest | Laval-Ouest features a suburban atmosphere with access to beautiful parks and nature trails, making it attractive to visitors looking to escape urban noise while still enjoying local amenities. | Parc de la Gare, Club de Golf Le Cardinal, Parc de la Rivière des Prairies |
| Laval Centre | The center of Laval is bustling with activity, shops, and dining options, making it perfect for visitors wanting to explore the urban lifestyle while having a variety of options at their doorstep. | La Place de Laval, Centropolis, Laval Centre commercial |
| Saint-Vincent-de-Paul | A historic area with beautiful architecture and charming streets, Saint-Vincent-de-Paul offers a unique experience for guests who wish to explore the cultural side of Laval. | Parc de la Visitation, Cathy's Park, L'Île-des-Moulins |
Understanding Airbnb License Requirements & STR Laws in Laval (administrative region) (2025)
Yes, Laval (administrative region), Quebec, Canada enforces high STR regulations. Obtaining a license and ensuring compliance is almost certainly required according to current 2025 STR laws. Always verify the latest short term rental regulations and Airbnb license requirements directly with local government authorities for Laval (administrative region) to ensure full compliance before hosting.
(Source: AirROI data, 2025, based on 55% licensed listings)
Top Performing Airbnb Properties in Laval (administrative region) (2025)
Benchmark your potential! Explore examples of top-performing Airbnb properties in Laval (administrative region)based on Trailing Twelve Month (TTM) revenue. Analyze their characteristics, revenue, occupancy rate, and ADR to understand what drives success in this market.
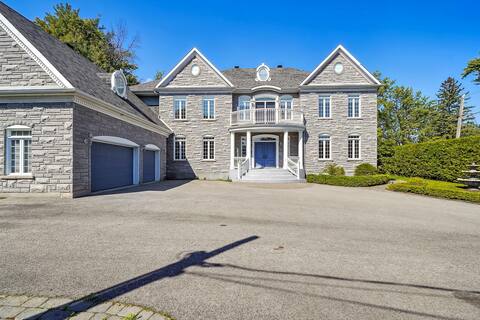
WATERFRONT VILLA
Entire Place • 9 bedrooms

Pool Table | Gorgeous | Parking | Clean
Entire Place • 4 bedrooms
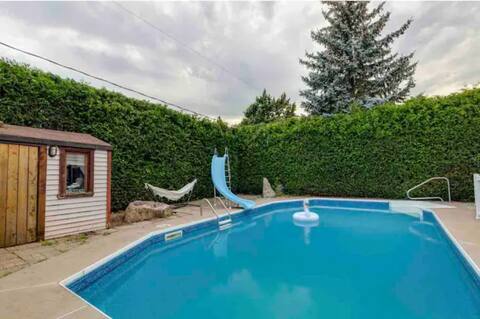
House with parking, pool, secluded backyard.
Entire Place • 3 bedrooms

Luxurious House with Stunning River Views
Entire Place • 4 bedrooms

Modern waterfront property in Montreal Area, Laval
Entire Place • 4 bedrooms

Waterfront Paradise With Pool Hot Tub Sauna
Entire Place • 5 bedrooms
Note: Performance varies based on location, size, amenities, seasonality, and management quality. Data reflects the past 12 months.
Top Performing Airbnb Hosts in Laval (administrative region) (2025)
Learn from the best! This table showcases top-performing Airbnb hosts in Laval (administrative region) based on the number of properties managed and estimated total revenue over the past year. Analyze their scale and performance metrics.
| Host Name | Properties | Grossing Revenue | Stay Reviews | Avg Rating |
|---|---|---|---|---|
| Rose | 2 | $199,029 | 77 | 4.87/5.0 |
| Karine | 3 | $113,834 | 54 | 4.74/5.0 |
| Said | 2 | $91,599 | 186 | 4.95/5.0 |
| Monthly Stays | 3 | $89,763 | 49 | 4.92/5.0 |
| Gwen | 4 | $81,866 | 149 | 4.75/5.0 |
| Hélène | 6 | $76,844 | 510 | 4.88/5.0 |
| Sam | 1 | $75,447 | 157 | 4.94/5.0 |
| Julia | 2 | $70,538 | 226 | 4.87/5.0 |
| Joelle | 1 | $66,315 | 110 | 4.87/5.0 |
| Host #456509666 | 1 | $64,760 | 12 | 5.00/5.0 |
Analyzing the strategies of top hosts, such as their property selection, pricing, and guest communication, can offer valuable lessons for optimizing your own Airbnb operations in Laval (administrative region).
Dive Deeper: Advanced Laval (administrative region) STR Market Data (2025)
Ready to unlock more insights? AirROI provides access to advanced metrics and comprehensive Airbnb data for Laval (administrative region). Explore detailed analytics beyond this report to refine your investment strategy, optimize pricing, and maximize your vacation rental profits.
Explore Advanced MetricsLaval (administrative region) Short-Term Rental Market Composition (2025): Property & Room Types
Room Type Distribution
Property Type Distribution
Market Composition Insights for Laval (administrative region)
- The Laval (administrative region) Airbnb market composition is heavily skewed towards Entire Home/Apt listings, which make up 76% of the 242 active rentals. This indicates strong guest preference for privacy and space.
- Looking at the property type distribution in Laval (administrative region), Apartment/Condo properties are the most common (58.7%), reflecting the local real estate landscape.
- Houses represent a significant 30.2% portion, catering likely to families or larger groups.
- The presence of 6.2% Hotel/Boutique listings indicates integration with traditional hospitality.
Laval (administrative region) Airbnb Room Capacity Analysis (2025): Bedroom Distribution
Distribution of Listings by Number of Bedrooms
Room Capacity Insights for Laval (administrative region)
- The dominant room capacity in Laval (administrative region) is 1 bedroom listings, making up 38.4% of the market. This suggests a strong demand for properties suitable for couples or solo travelers.
- Together, 1 bedroom and 2 bedrooms properties represent 63.2% of the active Airbnb listings in Laval (administrative region), indicating a high concentration in these sizes.
- A significant 22.0% of listings offer 3+ bedrooms, catering to larger groups and families seeking more space in Laval (administrative region).
Laval (administrative region) Vacation Rental Guest Capacity Trends (2025)
Distribution of Listings by Guest Capacity
Guest Capacity Insights for Laval (administrative region)
- The most common guest capacity trend in Laval (administrative region) vacation rentals is listings accommodating 2 guests (21.9%). This suggests the primary traveler segment is likely couples or solo travelers.
- Properties designed for 2 guests and 4 guests dominate the Laval (administrative region) STR market, accounting for 43.0% of listings.
- 27.7% of properties accommodate 6+ guests, serving the market segment for larger families or group travel in Laval (administrative region).
- On average, properties in Laval (administrative region) are equipped to host 3.6 guests.
Laval (administrative region) Airbnb Booking Patterns (2025): Available vs. Booked Days
Available Days Distribution
Booked Days Distribution
Booking Pattern Insights for Laval (administrative region)
- The most common availability pattern in Laval (administrative region) falls within the 271-366 days range, representing 38.8% of listings. This suggests many properties have significant open periods on their calendars.
- Approximately 66.5% of listings show high availability (181+ days open annually), indicating potential for increased bookings or specific owner usage patterns.
- For booked days, the 91-180 days range is most frequent in Laval (administrative region) (28.9%), reflecting common guest stay durations or potential owner blocking patterns.
- A notable 34.3% of properties secure long booking periods (181+ days booked per year), highlighting successful long-term rental strategies or significant owner usage.
Laval (administrative region) Airbnb Minimum Stay Requirements Analysis
Distribution of Listings by Minimum Night Requirement
1 Night
51 listings
23.4% of total
2 Nights
41 listings
18.8% of total
3 Nights
8 listings
3.7% of total
4-6 Nights
4 listings
1.8% of total
7-29 Nights
8 listings
3.7% of total
30+ Nights
106 listings
48.6% of total
Key Insights
- The most prevalent minimum stay requirement in Laval (administrative region) is 30+ Nights, adopted by 48.6% of listings. This highlights the market's preference for longer commitments.
- A significant segment (48.6%) caters to monthly stays (30+ nights) in Laval (administrative region), pointing to opportunities in the extended-stay market.
Recommendations
- Align with the market by considering a 30+ Nights minimum stay, as 48.6% of Laval (administrative region) hosts use this setting.
- If feasible, allowing 1-night stays, especially midweek or during low season, could capture last-minute bookings, as only 23.4% currently do.
- Explore offering discounts for stays of 30+ nights to attract the 48.6% of the market seeking extended stays.
- Adjust minimum nights based on seasonality – potentially shorter during low season and longer during peak demand periods in Laval (administrative region).
Laval (administrative region) Airbnb Cancellation Policy Trends Analysis (2025)
Super Strict 60 Days
1 listings
0.5% of total
Super Strict 30 Days
1 listings
0.5% of total
Flexible
48 listings
24.2% of total
Moderate
63 listings
31.8% of total
Firm
40 listings
20.2% of total
Strict
45 listings
22.7% of total
Cancellation Policy Insights for Laval (administrative region)
- The prevailing Airbnb cancellation policy trend in Laval (administrative region) is Moderate, used by 31.8% of listings.
- There's a relatively balanced mix between guest-friendly (56.0%) and stricter (42.9%) policies, offering choices for different guest needs.
Recommendations for Hosts
- Consider adopting a Moderate policy to align with the 31.8% market standard in Laval (administrative region).
- Regularly review your cancellation policy against competitors and market demand shifts in Laval (administrative region).
Laval (administrative region) STR Booking Lead Time Analysis (2025)
Average Booking Lead Time by Month
Booking Lead Time Insights for Laval (administrative region)
- The overall average booking lead time for vacation rentals in Laval (administrative region) is 35 days.
- Guests book furthest in advance for stays during June (average 65 days), likely coinciding with peak travel demand or local events.
- The shortest booking windows occur for stays in February (average 22 days), indicating more last-minute travel plans during this time.
- Seasonally, Summer (57 days avg.) sees the longest lead times, while Winter (27 days avg.) has the shortest, reflecting typical travel planning cycles.
Recommendations for Hosts
- Use the overall average lead time (35 days) as a baseline for your pricing and availability strategy in Laval (administrative region).
- For June stays, consider implementing length-of-stay discounts or slightly higher rates for bookings made less than 65 days out to capitalize on advance planning.
- Target marketing efforts for the Summer season well in advance (at least 57 days) to capture early planners.
- Monitor your own booking lead times against these Laval (administrative region) averages to identify opportunities for dynamic pricing adjustments.
Popular & Essential Airbnb Amenities in Laval (administrative region) (2025)
Amenity Prevalence
Amenity Insights for Laval (administrative region)
- Essential amenities in Laval (administrative region) that guests expect include: Wifi, Heating, Hot water, Smoke alarm. Lacking these (any) could significantly impact bookings.
- Popular amenities like Essentials, TV, Kitchen are common but not universal. Offering these can provide a competitive edge.
Recommendations for Hosts
- Ensure your listing includes all essential amenities for Laval (administrative region): Wifi, Heating, Hot water, Smoke alarm.
- Prioritize adding missing essentials: Heating, Hot water, Smoke alarm.
- Consider adding popular differentiators like Essentials or TV to increase appeal.
- Highlight unique or less common amenities you offer (e.g., hot tub, dedicated workspace, EV charger) in your listing description and photos.
- Regularly check competitor amenities in Laval (administrative region) to stay competitive.
Laval (administrative region) Airbnb Guest Demographics & Profile Analysis (2025)
Guest Profile Summary for Laval (administrative region)
- The typical guest profile for Airbnb in Laval (administrative region) consists of a mix of domestic (64%) and international guests, often arriving from nearby Toronto, typically belonging to the Post-2000s (Gen Z/Alpha) group (50%), primarily speaking English or French.
- Domestic travelers account for 64.3% of guests.
- Key international markets include Canada (64.3%) and United States (19.6%).
- Top languages spoken are English (48.2%) followed by French (27.5%).
- A significant demographic segment is the Post-2000s (Gen Z/Alpha) group, representing 50% of guests.
Recommendations for Hosts
- Target domestic marketing efforts towards travelers from Toronto and Montreal.
- Tailor amenities and listing descriptions to appeal to the dominant Post-2000s (Gen Z/Alpha) demographic (e.g., highlight fast WiFi, smart home features, local guides).
- Highlight unique local experiences or amenities relevant to the primary guest profile.
- Consider seasonal promotions aligned with peak travel times for key origin markets.
Nearby Short-Term Rental Market Comparison
How does the Laval (administrative region) Airbnb market stack up against its neighbors? Compare key performance metrics like average monthly revenue, ADR, and occupancy rates in surrounding areas to understand the broader regional STR landscape.
| Market | Active Properties | Monthly Revenue | Daily Rate | Avg. Occupancy |
|---|---|---|---|---|
| Mille-Isles | 93 | $5,049 | $415.08 | 41% |
| Malletts Bay | 49 | $4,960 | $414.58 | 48% |
| Stowe | 842 | $4,757 | $474.92 | 41% |
| Wilmington | 130 | $4,484 | $324.06 | 45% |
| Saint-Denis-de-Brompton | 28 | $4,459 | $383.13 | 34% |
| Calais | 16 | $4,320 | $299.79 | 49% |
| Grenville-sur-la-Rouge | 32 | $4,226 | $362.40 | 41% |
| Middlebury | 52 | $4,128 | $288.39 | 54% |
| Waterloo | 11 | $4,092 | $357.06 | 37% |
| Topsham | 13 | $3,952 | $265.51 | 50% |