Lamarche Airbnb Market Analysis 2025: Short Term Rental Data & Vacation Rental Statistics in Quebec, Canada
Is Airbnb profitable in Lamarche in 2025? Explore comprehensive Airbnb analytics for Lamarche, Quebec, Canada to uncover income potential. This 2025 STR market report for Lamarche, based on AirROI data from April 2024 to March 2025, reveals key trends in the niche market of 18 active listings.
Whether you're considering an Airbnb investment in Lamarche, optimizing your existing vacation rental, or exploring rental arbitrage opportunities, understanding the Lamarche Airbnb data is crucial. Navigating the high regulation landscape is key to maximizing your short term rental income potential. Let's dive into the specifics.
Key Lamarche Airbnb Performance Metrics Overview
Monthly Airbnb Revenue Variations & Income Potential in Lamarche (2025)
Understanding the monthly revenue variations for Airbnb listings in Lamarche is key to maximizing your short term rental income potential. Seasonality significantly impacts earnings. Our analysis, based on data from the past 12 months, shows that the peak revenue month for STRs in Lamarche is typically August, while September often presents the lowest earnings, highlighting opportunities for strategic pricing adjustments during shoulder and low seasons. Explore the typical Airbnb income in Lamarche across different performance tiers:
- Best-in-class properties (Top 10%) achieve $3,384+ monthly, often utilizing dynamic pricing and superior guest experiences.
- Strong performing properties (Top 25%) earn $2,263 or more, indicating effective management and desirable locations/amenities.
- Typical properties (Median) generate around $1,339 per month, representing the average market performance.
- Entry-level properties (Bottom 25%) see earnings around $647, often with potential for optimization.
Average Monthly Airbnb Earnings Trend in Lamarche
Lamarche Airbnb Occupancy Rate Trends (2025)
Maximize your bookings by understanding the Lamarche STR occupancy trends. Seasonal demand shifts significantly influence how often properties are booked. Typically, Augustsees the highest demand (peak season occupancy), while October experiences the lowest (low season). Effective strategies, like adjusting minimum stays or offering promotions, can boost occupancy during slower periods. Here's how different property tiers perform in Lamarche:
- Best-in-class properties (Top 10%) achieve 57%+ occupancy, indicating high desirability and potentially optimized availability.
- Strong performing properties (Top 25%) maintain 43% or higher occupancy, suggesting good market fit and guest satisfaction.
- Typical properties (Median) have an occupancy rate around 24%.
- Entry-level properties (Bottom 25%) average 13% occupancy, potentially facing higher vacancy.
Average Monthly Occupancy Rate Trend in Lamarche
Average Daily Rate (ADR) Airbnb Trends in Lamarche (2025)
Effective short term rental pricing strategy in Lamarche involves understanding monthly ADR fluctuations. The Average Daily Rate (ADR) for Airbnb in Lamarche typically peaks in July and dips lowest during November. Leveraging Airbnb dynamic pricing tools or strategies based on this seasonality can significantly boost revenue. Here's a look at the typical nightly rates achieved:
- Best-in-class properties (Top 10%) command rates of $246+ per night, often due to premium features or locations.
- Strong performing properties (Top 25%) achieve nightly rates of $181 or more.
- Typical properties (Median) charge around $153 per night.
- Entry-level properties (Bottom 25%) earn around $134 per night.
Average Daily Rate (ADR) Trend by Month in Lamarche
Get Live Lamarche Market Intelligence 👇

Explore Real-time Analytics
Airbnb Seasonality Analysis & Trends in Lamarche (2025)
Peak Season (August, July, May)
- Revenue averages $2,391 per month
- Occupancy rates average 45.0%
- Daily rates average $172
Shoulder Season
- Revenue averages $1,600 per month
- Occupancy maintains around 28.8%
- Daily rates hold near $165
Low Season (March, September, October)
- Revenue drops to average $975 per month
- Occupancy decreases to average 17.7%
- Daily rates adjust to average $165
Seasonality Insights for Lamarche
- The Airbnb seasonality in Lamarche shows highly seasonal trends requiring careful strategy. While the sections above show seasonal averages, it's also insightful to look at the extremes:
- During the high season, the absolute peak month showcases Lamarche's highest earning potential, with monthly revenues capable of climbing to $2,675, occupancy reaching a high of 47.8%, and ADRs peaking at $173.
- Conversely, the slowest single month of the year, typically falling within the low season, marks the market's lowest point. In this month, revenue might dip to $744, occupancy could drop to 14.8%, and ADRs may adjust down to $154.
- Understanding both the seasonal averages and these monthly peaks and troughs in revenue, occupancy, and ADR is crucial for maximizing your Airbnb profit potential in Lamarche.
Seasonal Strategies for Maximizing Profit
- Peak Season: Maximize revenue through premium pricing and potentially longer minimum stays. Ensure high availability.
- Low Season: Offer competitive pricing, special promotions (e.g., extended stay discounts), and flexible cancellation policies. Target off-season travelers like remote workers or budget-conscious guests.
- Shoulder Seasons: Implement dynamic pricing that balances peak and low rates. Target weekend travelers or specific events. Offer slightly more flexible terms than peak season.
- Regularly analyze your own performance against these Lamarche seasonality benchmarks and adjust your pricing and availability strategy accordingly.
Best Areas for Airbnb Investment in Lamarche (2025)
Exploring the top neighborhoods for short-term rentals in Lamarche? This section highlights key areas, outlining why they are attractive for hosts and guests, along with notable local attractions. Consider these locations based on your target guest profile and investment strategy.
| Neighborhood / Area | Why Host Here? (Target Guests & Appeal) | Key Attractions & Landmarks |
|---|---|---|
| Lac Brome | A picturesque lake area known for its beautiful scenery and outdoor activities. Popular with tourists looking for a peaceful retreat and those who enjoy hiking, fishing, and boating. | Lac Brome, Brome Lake Golf Club, Les Jardins de la Terre, Marais de la rivière aux Cerises, Lac Brome Christmas Market |
| Sutton | Charming village known for its ski resorts and vibrant arts scene. Ideal for winter sports enthusiasts in the colder months and hiking lovers in the summer. | Mont Sutton, Sutton village, Jardin des Sens, Sutton Art Gallery, Sutton Theatre |
| Knowlton | Historical village charm with beautiful architecture and a lakefront. Great for tourists who love history and quaint shops. | Brome Lake Museum, Knowlton Golf Club, Lac Brome, Charming boutiques, Water activities |
| Magog | A vibrant town located near Lake Memphremagog, perfect for year-round outdoor activities and cultural experiences. Attractive to families and nature lovers. | Parc de la Gorge de Coaticook, Memphremagog Lake, Magog River, Cineplex Cinemas, Magic Show Magog |
| Orford National Park | A beautiful national park perfect for outdoor lovers. Great for hiking, camping, and winter sports, attracting nature enthusiasts. | Lake Stukely, Mount Orford trails, Norton-Lake Beach, Seignory Lodge, Orford Golf Club |
| Sherbrooke | A larger urban center with a mix of culture, education, and nature. Home to several festivals and universities, appealing to a diverse audience. | Sherbrooke Museum of Fine Arts, La Grande plaine, Universite de Sherbrooke, Marché de la gare, Historic district |
| Richmond | A small town full of history and agriculture, providing a unique rural experience for guests who want to escape city life. | Richmond Arts Center, Historical Museum, Cascades Park, Local farms, Rural festivals |
| Eastman | Known for its natural beauty and numerous lakes, Eastman is perfect for outdoor activities and those who enjoy a peaceful village atmosphere. | Lac d'Eastman, Eastman Village, Hiking trails, Local restaurants, Festivals and events |
Understanding Airbnb License Requirements & STR Laws in Lamarche (2025)
Yes, Lamarche, Quebec, Canada enforces high STR regulations. Obtaining a license and ensuring compliance is almost certainly required according to current 2025 STR laws. Always verify the latest short term rental regulations and Airbnb license requirements directly with local government authorities for Lamarche to ensure full compliance before hosting.
(Source: AirROI data, 2025, based on 56% licensed listings)
Top Performing Airbnb Properties in Lamarche (2025)
Benchmark your potential! Explore examples of top-performing Airbnb properties in Lamarchebased on Trailing Twelve Month (TTM) revenue. Analyze their characteristics, revenue, occupancy rate, and ADR to understand what drives success in this market.
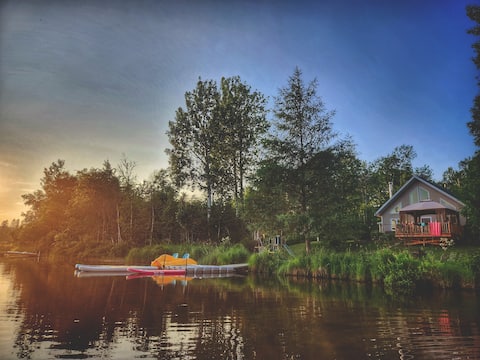
Warm waterfront cottage CITQ #302710
Entire Place • 2 bedrooms
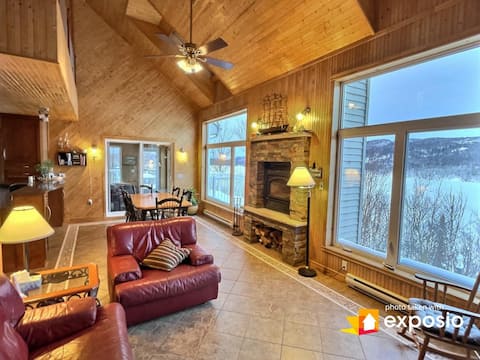
Waterfront Awesomeness
Entire Place • 6 bedrooms
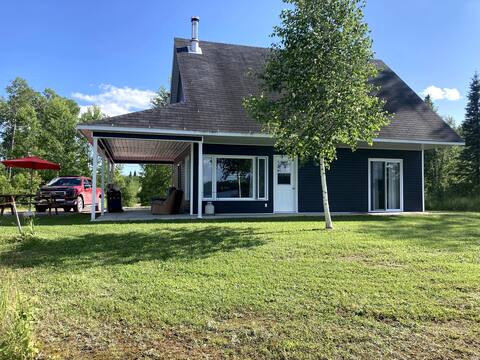
Warm waterfront chalet
Entire Place • 2 bedrooms
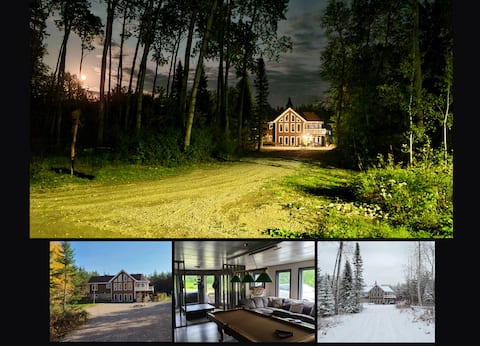
Chalet for 12 people near the river Péribonka
Entire Place • 4 bedrooms

Brise du Lac Tchitogama, 2587
Entire Place • 3 bedrooms
Large, bright waterfront cottage
Entire Place • 4 bedrooms
Note: Performance varies based on location, size, amenities, seasonality, and management quality. Data reflects the past 12 months.
Top Performing Airbnb Hosts in Lamarche (2025)
Learn from the best! This table showcases top-performing Airbnb hosts in Lamarche based on the number of properties managed and estimated total revenue over the past year. Analyze their scale and performance metrics.
| Host Name | Properties | Grossing Revenue | Stay Reviews | Avg Rating |
|---|---|---|---|---|
| Yan | 2 | $52,083 | 24 | 4.97/5.0 |
| Suzanne | 6 | $39,442 | 5 | 0.83/5.0 |
| Carl | 1 | $34,425 | 79 | 4.95/5.0 |
| Martin | 1 | $24,333 | 77 | 4.94/5.0 |
| Jérôme Et Anne | 1 | $23,185 | 72 | 4.89/5.0 |
| Jean-François | 1 | $12,238 | 22 | 4.95/5.0 |
| Eva | 1 | $11,776 | 7 | 4.71/5.0 |
| Host #488111335 | 1 | $11,352 | 0 | 0.00/5.0 |
| Michel | 2 | $10,882 | 87 | 2.48/5.0 |
| Host #102797640 | 1 | $7,027 | 6 | 5.00/5.0 |
Analyzing the strategies of top hosts, such as their property selection, pricing, and guest communication, can offer valuable lessons for optimizing your own Airbnb operations in Lamarche.
Dive Deeper: Advanced Lamarche STR Market Data (2025)
Ready to unlock more insights? AirROI provides access to advanced metrics and comprehensive Airbnb data for Lamarche. Explore detailed analytics beyond this report to refine your investment strategy, optimize pricing, and maximize your vacation rental profits.
Explore Advanced MetricsLamarche Short-Term Rental Market Composition (2025): Property & Room Types
Room Type Distribution
Property Type Distribution
Market Composition Insights for Lamarche
- The Lamarche Airbnb market composition is heavily skewed towards Entire Home/Apt listings, which make up 100% of the 18 active rentals. This indicates strong guest preference for privacy and space.
- Looking at the property type distribution in Lamarche, House properties are the most common (83.3%), reflecting the local real estate landscape.
- Houses represent a significant 83.3% portion, catering likely to families or larger groups.
- The presence of 5.6% Hotel/Boutique listings indicates integration with traditional hospitality.
Lamarche Airbnb Room Capacity Analysis (2025): Bedroom Distribution
Distribution of Listings by Number of Bedrooms
Room Capacity Insights for Lamarche
- The dominant room capacity in Lamarche is 2 bedrooms listings, making up 38.9% of the market. This suggests a strong demand for properties suitable for couples or solo travelers.
- Together, 2 bedrooms and 3 bedrooms properties represent 55.6% of the active Airbnb listings in Lamarche, indicating a high concentration in these sizes.
- A significant 44.5% of listings offer 3+ bedrooms, catering to larger groups and families seeking more space in Lamarche.
Lamarche Vacation Rental Guest Capacity Trends (2025)
Distribution of Listings by Guest Capacity
Guest Capacity Insights for Lamarche
- The most common guest capacity trend in Lamarche vacation rentals is listings accommodating 8+ guests (38.9%). This suggests the primary traveler segment is likely larger groups.
- Properties designed for 8+ guests and 4 guests dominate the Lamarche STR market, accounting for 72.2% of listings.
- 55.6% of properties accommodate 6+ guests, serving the market segment for larger families or group travel in Lamarche.
- On average, properties in Lamarche are equipped to host 6.0 guests.
Lamarche Airbnb Booking Patterns (2025): Available vs. Booked Days
Available Days Distribution
Booked Days Distribution
Booking Pattern Insights for Lamarche
- The most common availability pattern in Lamarche falls within the 271-366 days range, representing 83.3% of listings. This suggests many properties have significant open periods on their calendars.
- Approximately 94.4% of listings show high availability (181+ days open annually), indicating potential for increased bookings or specific owner usage patterns.
- For booked days, the 31-90 days range is most frequent in Lamarche (77.8%), reflecting common guest stay durations or potential owner blocking patterns.
- A notable 11.1% of properties secure long booking periods (181+ days booked per year), highlighting successful long-term rental strategies or significant owner usage.
Lamarche Airbnb Minimum Stay Requirements Analysis
Distribution of Listings by Minimum Night Requirement
2 Nights
2 listings
12.5% of total
3 Nights
1 listings
6.3% of total
4-6 Nights
1 listings
6.3% of total
7-29 Nights
3 listings
18.8% of total
30+ Nights
9 listings
56.3% of total
Key Insights
- The most prevalent minimum stay requirement in Lamarche is 30+ Nights, adopted by 56.3% of listings. This highlights the market's preference for longer commitments.
- Very short stays (1-2 nights) are less common (12.5%), suggesting hosts prefer slightly longer bookings to optimize turnover.
- A significant segment (56.3%) caters to monthly stays (30+ nights) in Lamarche, pointing to opportunities in the extended-stay market.
Recommendations
- Align with the market by considering a 30+ Nights minimum stay, as 56.3% of Lamarche hosts use this setting.
- Explore offering discounts for stays of 30+ nights to attract the 56.3% of the market seeking extended stays.
- Adjust minimum nights based on seasonality – potentially shorter during low season and longer during peak demand periods in Lamarche.
Lamarche Airbnb Cancellation Policy Trends Analysis (2025)
Super Strict 30 Days
1 listings
10% of total
Flexible
1 listings
10% of total
Moderate
2 listings
20% of total
Firm
2 listings
20% of total
Strict
4 listings
40% of total
Cancellation Policy Insights for Lamarche
- The prevailing Airbnb cancellation policy trend in Lamarche is Strict, used by 40% of listings.
- A majority (60.0%) of hosts in Lamarche utilize Firm or Strict policies, indicating a market where hosts prioritize booking security.
Recommendations for Hosts
- Consider adopting a Strict policy to align with the 40% market standard in Lamarche.
- With 40% using Strict terms, this is a viable option in Lamarche, particularly for high-value properties or during peak demand periods.
- Regularly review your cancellation policy against competitors and market demand shifts in Lamarche.
Lamarche STR Booking Lead Time Analysis (2025)
Average Booking Lead Time by Month
Booking Lead Time Insights for Lamarche
- The overall average booking lead time for vacation rentals in Lamarche is 44 days.
- Guests book furthest in advance for stays during June (average 122 days), likely coinciding with peak travel demand or local events.
- The shortest booking windows occur for stays in April (average 11 days), indicating more last-minute travel plans during this time.
- Seasonally, Summer (97 days avg.) sees the longest lead times, while Spring (21 days avg.) has the shortest, reflecting typical travel planning cycles.
Recommendations for Hosts
- Use the overall average lead time (44 days) as a baseline for your pricing and availability strategy in Lamarche.
- For June stays, consider implementing length-of-stay discounts or slightly higher rates for bookings made less than 122 days out to capitalize on advance planning.
- During April, focus on last-minute booking availability and promotions, as guests book with very short notice (11 days avg.).
- Target marketing efforts for the Summer season well in advance (at least 97 days) to capture early planners.
- Monitor your own booking lead times against these Lamarche averages to identify opportunities for dynamic pricing adjustments.
Popular & Essential Airbnb Amenities in Lamarche (2025)
Amenity Prevalence
Amenity Insights for Lamarche
- Essential amenities in Lamarche that guests expect include: Heating, Hot water, Free parking on premises, Smoke alarm, Kitchen. Lacking these (any) could significantly impact bookings.
- Popular amenities like Fire extinguisher, Coffee maker, Refrigerator are common but not universal. Offering these can provide a competitive edge.
Recommendations for Hosts
- Ensure your listing includes all essential amenities for Lamarche: Heating, Hot water, Free parking on premises, Smoke alarm, Kitchen.
- Consider adding popular differentiators like Fire extinguisher or Coffee maker to increase appeal.
- Highlight unique or less common amenities you offer (e.g., hot tub, dedicated workspace, EV charger) in your listing description and photos.
- Regularly check competitor amenities in Lamarche to stay competitive.
Lamarche Airbnb Guest Demographics & Profile Analysis (2025)
Guest Profile Summary for Lamarche
- The typical guest profile for Airbnb in Lamarche consists of a mix of domestic (63%) and international guests, often arriving from nearby Montreal, typically belonging to the Post-2000s (Gen Z/Alpha) group (50%), primarily speaking French or English.
- Domestic travelers account for 63.4% of guests.
- Key international markets include Canada (63.4%) and France (29.6%).
- Top languages spoken are French (42.9%) followed by English (39%).
- A significant demographic segment is the Post-2000s (Gen Z/Alpha) group, representing 50% of guests.
Recommendations for Hosts
- Target domestic marketing efforts towards travelers from Montreal and Québec City.
- Tailor amenities and listing descriptions to appeal to the dominant Post-2000s (Gen Z/Alpha) demographic (e.g., highlight fast WiFi, smart home features, local guides).
- Highlight unique local experiences or amenities relevant to the primary guest profile.
- Consider seasonal promotions aligned with peak travel times for key origin markets.
Nearby Short-Term Rental Market Comparison
How does the Lamarche Airbnb market stack up against its neighbors? Compare key performance metrics like average monthly revenue, ADR, and occupancy rates in surrounding areas to understand the broader regional STR landscape.
| Market | Active Properties | Monthly Revenue | Daily Rate | Avg. Occupancy |
|---|---|---|---|---|
| Les Éboulements | 137 | $3,141 | $227.50 | 42% |
| Saint-Irénée | 45 | $2,846 | $215.63 | 44% |
| Sainte-Brigitte-de-Laval | 59 | $2,652 | $185.69 | 49% |
| Petite-Rivière-Saint-François | 405 | $2,484 | $285.25 | 34% |
| Hébertville | 11 | $2,476 | $188.05 | 45% |
| Stoneham-et-Tewkesbury | 191 | $2,401 | $331.79 | 32% |
| Roberval | 24 | $2,263 | $138.52 | 60% |
| Saint-Ferréol-les-Neiges | 172 | $2,234 | $257.49 | 35% |
| Saint-Joachim | 16 | $2,159 | $170.71 | 48% |
| Baie-Saint-Paul | 193 | $2,059 | $194.67 | 38% |