La Prairie Airbnb Market Analysis 2025: Short Term Rental Data & Vacation Rental Statistics in Quebec, Canada
Is Airbnb profitable in La Prairie in 2025? Explore comprehensive Airbnb analytics for La Prairie, Quebec, Canada to uncover income potential. This 2025 STR market report for La Prairie, based on AirROI data from April 2024 to March 2025, reveals key trends in the niche market of 21 active listings.
Whether you're considering an Airbnb investment in La Prairie, optimizing your existing vacation rental, or exploring rental arbitrage opportunities, understanding the La Prairie Airbnb data is crucial. Navigating the high regulation landscape is key to maximizing your short term rental income potential. Let's dive into the specifics.
Key La Prairie Airbnb Performance Metrics Overview
Monthly Airbnb Revenue Variations & Income Potential in La Prairie (2025)
Understanding the monthly revenue variations for Airbnb listings in La Prairie is key to maximizing your short term rental income potential. Seasonality significantly impacts earnings. Our analysis, based on data from the past 12 months, shows that the peak revenue month for STRs in La Prairie is typically May, while March often presents the lowest earnings, highlighting opportunities for strategic pricing adjustments during shoulder and low seasons. Explore the typical Airbnb income in La Prairie across different performance tiers:
- Best-in-class properties (Top 10%) achieve $3,949+ monthly, often utilizing dynamic pricing and superior guest experiences.
- Strong performing properties (Top 25%) earn $3,207 or more, indicating effective management and desirable locations/amenities.
- Typical properties (Median) generate around $1,981 per month, representing the average market performance.
- Entry-level properties (Bottom 25%) see earnings around $1,283, often with potential for optimization.
Average Monthly Airbnb Earnings Trend in La Prairie
La Prairie Airbnb Occupancy Rate Trends (2025)
Maximize your bookings by understanding the La Prairie STR occupancy trends. Seasonal demand shifts significantly influence how often properties are booked. Typically, Augustsees the highest demand (peak season occupancy), while March experiences the lowest (low season). Effective strategies, like adjusting minimum stays or offering promotions, can boost occupancy during slower periods. Here's how different property tiers perform in La Prairie:
- Best-in-class properties (Top 10%) achieve 83%+ occupancy, indicating high desirability and potentially optimized availability.
- Strong performing properties (Top 25%) maintain 71% or higher occupancy, suggesting good market fit and guest satisfaction.
- Typical properties (Median) have an occupancy rate around 58%.
- Entry-level properties (Bottom 25%) average 38% occupancy, potentially facing higher vacancy.
Average Monthly Occupancy Rate Trend in La Prairie
Average Daily Rate (ADR) Airbnb Trends in La Prairie (2025)
Effective short term rental pricing strategy in La Prairie involves understanding monthly ADR fluctuations. The Average Daily Rate (ADR) for Airbnb in La Prairie typically peaks in July and dips lowest during March. Leveraging Airbnb dynamic pricing tools or strategies based on this seasonality can significantly boost revenue. Here's a look at the typical nightly rates achieved:
- Best-in-class properties (Top 10%) command rates of $190+ per night, often due to premium features or locations.
- Strong performing properties (Top 25%) achieve nightly rates of $157 or more.
- Typical properties (Median) charge around $100 per night.
- Entry-level properties (Bottom 25%) earn around $57 per night.
Average Daily Rate (ADR) Trend by Month in La Prairie
Get Live La Prairie Market Intelligence 👇

Explore Real-time Analytics
Airbnb Seasonality Analysis & Trends in La Prairie (2025)
Peak Season (May, August, July)
- Revenue averages $3,427 per month
- Occupancy rates average 70.6%
- Daily rates average $126
Shoulder Season
- Revenue averages $2,389 per month
- Occupancy maintains around 58.7%
- Daily rates hold near $116
Low Season (January, February, March)
- Revenue drops to average $868 per month
- Occupancy decreases to average 29.3%
- Daily rates adjust to average $101
Seasonality Insights for La Prairie
- The Airbnb seasonality in La Prairie shows highly seasonal trends requiring careful strategy. While the sections above show seasonal averages, it's also insightful to look at the extremes:
- During the high season, the absolute peak month showcases La Prairie's highest earning potential, with monthly revenues capable of climbing to $3,564, occupancy reaching a high of 76.0%, and ADRs peaking at $131.
- Conversely, the slowest single month of the year, typically falling within the low season, marks the market's lowest point. In this month, revenue might dip to $676, occupancy could drop to 24.3%, and ADRs may adjust down to $99.
- Understanding both the seasonal averages and these monthly peaks and troughs in revenue, occupancy, and ADR is crucial for maximizing your Airbnb profit potential in La Prairie.
Seasonal Strategies for Maximizing Profit
- Peak Season: Maximize revenue through premium pricing and potentially longer minimum stays. Ensure high availability.
- Low Season: Offer competitive pricing, special promotions (e.g., extended stay discounts), and flexible cancellation policies. Target off-season travelers like remote workers or budget-conscious guests.
- Shoulder Seasons: Implement dynamic pricing that balances peak and low rates. Target weekend travelers or specific events. Offer slightly more flexible terms than peak season.
- Regularly analyze your own performance against these La Prairie seasonality benchmarks and adjust your pricing and availability strategy accordingly.
Best Areas for Airbnb Investment in La Prairie (2025)
Exploring the top neighborhoods for short-term rentals in La Prairie? This section highlights key areas, outlining why they are attractive for hosts and guests, along with notable local attractions. Consider these locations based on your target guest profile and investment strategy.
| Neighborhood / Area | Why Host Here? (Target Guests & Appeal) | Key Attractions & Landmarks |
|---|---|---|
| Centre-ville (Downtown) | The heart of La Prairie with bustling shops, restaurants, and easy access to public transportation. Ideal for tourists wanting to experience local culture and city life. | Église Saint-Jean-Baptiste, Parc de la Prairie, Restaurants and cafes, Local boutiques, Annual festivals and events |
| Parc de la Prairie | A scenic park area that offers outdoor activities and a beautiful natural setting. Great for families and locals looking for recreational spaces. | Parc de la Prairie, Walking and biking trails, Picnic areas, Wildlife viewing, Waterfront access |
| Quartier La Prairie | A charming neighborhood with a mix of historic sites and modern amenities. Offers a glimpse of local life and easy access to amenities. | Historic buildings, Local shops, Community events, Cafés, Sculpture gardens |
| Saint-Jean | A vibrant suburb with strong community ties and family-friendly amenities. Excellent for longer stays and those needing more space. | Local parks, Community centers, Shopping plazas, Family-friendly restaurants, Sports facilities |
| Bord-de-l’Eau | A beautiful waterfront area offering stunning views and a relaxing atmosphere. Perfect for those looking for a peaceful retreat. | Waterfront promenade, Fishing spots, Parks, Scenic picnic areas, Nature trails |
| Route 132 | A key artery that connects La Prairie to major highways and attractions, making it convenient for travelers. | Variety of restaurants, Shopping centers, Gas stations, Easy access to surrounding areas, Transit connections |
| Cité de la Prairie | A planned community with modern homes and amenities. Great for families and those seeking a suburban feel within city limits. | Community parks, Playgrounds, Local schools, Family activity centers, Green spaces |
| Les Terrasses de la Prairie | A newer residential area with contemporary homes and a suburban lifestyle. Attracts families and young professionals. | Modern amenities, Local cafés, Parks, Easy access to schools, Nearby shopping options |
Understanding Airbnb License Requirements & STR Laws in La Prairie (2025)
Yes, La Prairie, Quebec, Canada enforces high STR regulations. Obtaining a license and ensuring compliance is almost certainly required according to current 2025 STR laws. Always verify the latest short term rental regulations and Airbnb license requirements directly with local government authorities for La Prairie to ensure full compliance before hosting.
(Source: AirROI data, 2025, based on 81% licensed listings)
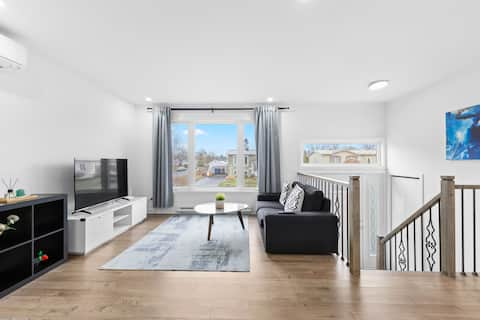
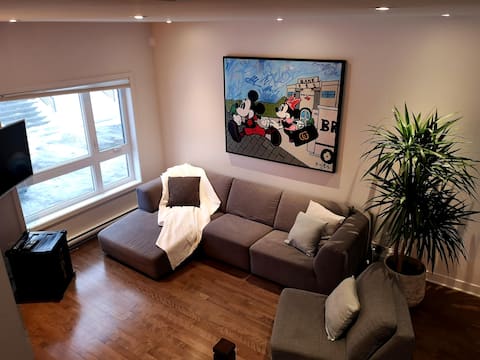
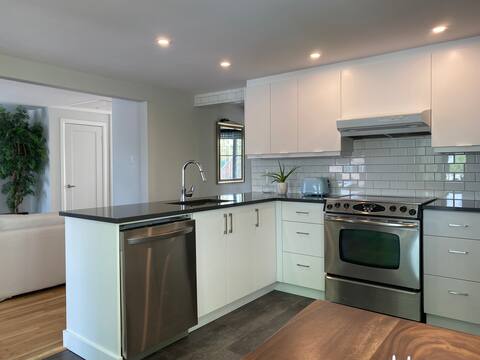
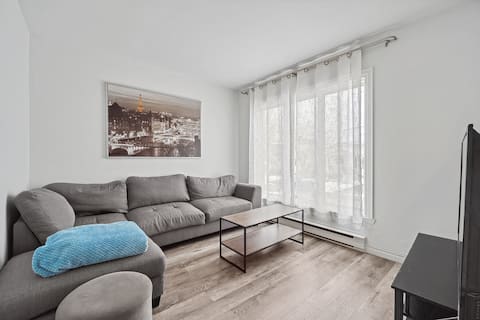
Top Performing Airbnb Properties in La Prairie (2025)
Benchmark your potential! Explore examples of top-performing Airbnb properties in La Prairiebased on Trailing Twelve Month (TTM) revenue. Analyze their characteristics, revenue, occupancy rate, and ADR to understand what drives success in this market.
Cozy new renovated bungalow close to DT free park
Entire Place • 4 bedrooms
4beds modern home 15 min from Montreal
Entire Place • 4 bedrooms
Coconut, 10 minutes from Montreal city center
Entire Place • 2 bedrooms
Spacious near Montreal
Entire Place • 3 bedrooms
“PROMO of the month” Lili Château Parking&Terrasse
Entire Place • 3 bedrooms
Maison à La Prairie
Entire Place • 4 bedrooms
Note: Performance varies based on location, size, amenities, seasonality, and management quality. Data reflects the past 12 months.
Top Performing Airbnb Hosts in La Prairie (2025)
Learn from the best! This table showcases top-performing Airbnb hosts in La Prairie based on the number of properties managed and estimated total revenue over the past year. Analyze their scale and performance metrics.
| Host Name | Properties | Grossing Revenue | Stay Reviews | Avg Rating |
|---|---|---|---|---|
| Rebecca | 4 | $63,487 | 261 | 4.78/5.0 |
| Trevor | 1 | $38,260 | 27 | 4.74/5.0 |
| Fab | 1 | $37,137 | 187 | 4.70/5.0 |
| Julie | 1 | $36,930 | 127 | 4.88/5.0 |
| Lionel | 1 | $36,515 | 12 | 4.50/5.0 |
| Linli | 1 | $35,135 | 71 | 4.96/5.0 |
| Host #6510800 | 1 | $32,989 | 32 | 4.72/5.0 |
| Kathleen | 1 | $30,595 | 24 | 4.50/5.0 |
| Sorelle | 1 | $29,415 | 18 | 4.89/5.0 |
| Lisa | 1 | $28,389 | 15 | 4.67/5.0 |
Analyzing the strategies of top hosts, such as their property selection, pricing, and guest communication, can offer valuable lessons for optimizing your own Airbnb operations in La Prairie.
Dive Deeper: Advanced La Prairie STR Market Data (2025)
Ready to unlock more insights? AirROI provides access to advanced metrics and comprehensive Airbnb data for La Prairie. Explore detailed analytics beyond this report to refine your investment strategy, optimize pricing, and maximize your vacation rental profits.
Explore Advanced MetricsLa Prairie Short-Term Rental Market Composition (2025): Property & Room Types
Room Type Distribution
Property Type Distribution
Market Composition Insights for La Prairie
- The La Prairie Airbnb market composition is heavily skewed towards Entire Home/Apt listings, which make up 85.7% of the 21 active rentals. This indicates strong guest preference for privacy and space.
- Looking at the property type distribution in La Prairie, Apartment/Condo properties are the most common (52.4%), reflecting the local real estate landscape.
- Houses represent a significant 47.6% portion, catering likely to families or larger groups.
La Prairie Airbnb Room Capacity Analysis (2025): Bedroom Distribution
Distribution of Listings by Number of Bedrooms
Room Capacity Insights for La Prairie
- The dominant room capacity in La Prairie is 3 bedrooms listings, making up 33.3% of the market. This suggests a strong demand for properties suitable for families or small groups.
- Together, 3 bedrooms and 1 bedroom properties represent 57.1% of the active Airbnb listings in La Prairie, indicating a high concentration in these sizes.
- A significant 52.3% of listings offer 3+ bedrooms, catering to larger groups and families seeking more space in La Prairie.
La Prairie Vacation Rental Guest Capacity Trends (2025)
Distribution of Listings by Guest Capacity
Guest Capacity Insights for La Prairie
- The most common guest capacity trend in La Prairie vacation rentals is listings accommodating 6 guests (38.1%). This suggests the primary traveler segment is likely larger groups.
- Properties designed for 6 guests and 8+ guests dominate the La Prairie STR market, accounting for 57.1% of listings.
- 61.9% of properties accommodate 6+ guests, serving the market segment for larger families or group travel in La Prairie.
- On average, properties in La Prairie are equipped to host 5.1 guests.
La Prairie Airbnb Booking Patterns (2025): Available vs. Booked Days
Available Days Distribution
Booked Days Distribution
Booking Pattern Insights for La Prairie
- The most common availability pattern in La Prairie falls within the 91-180 days range, representing 47.6% of listings. This suggests many properties have significant open periods on their calendars.
- Approximately 47.6% of listings show high availability (181+ days open annually), indicating potential for increased bookings or specific owner usage patterns.
- For booked days, the 181-270 days range is most frequent in La Prairie (52.4%), reflecting common guest stay durations or potential owner blocking patterns.
- A notable 57.2% of properties secure long booking periods (181+ days booked per year), highlighting successful long-term rental strategies or significant owner usage.
La Prairie Airbnb Minimum Stay Requirements Analysis
Distribution of Listings by Minimum Night Requirement
1 Night
4 listings
21.1% of total
2 Nights
5 listings
26.3% of total
3 Nights
1 listings
5.3% of total
4-6 Nights
4 listings
21.1% of total
7-29 Nights
2 listings
10.5% of total
30+ Nights
3 listings
15.8% of total
Key Insights
- The most prevalent minimum stay requirement in La Prairie is 2 Nights, adopted by 26.3% of listings. This highlights the market's preference for shorter, flexible bookings.
- A significant segment (15.8%) caters to monthly stays (30+ nights) in La Prairie, pointing to opportunities in the extended-stay market.
Recommendations
- Align with the market by considering a 2 Nights minimum stay, as 26.3% of La Prairie hosts use this setting.
- If feasible, allowing 1-night stays, especially midweek or during low season, could capture last-minute bookings, as only 21.1% currently do.
- Explore offering discounts for stays of 30+ nights to attract the 15.8% of the market seeking extended stays.
- Adjust minimum nights based on seasonality – potentially shorter during low season and longer during peak demand periods in La Prairie.
La Prairie Airbnb Cancellation Policy Trends Analysis (2025)
Flexible
3 listings
16.7% of total
Moderate
6 listings
33.3% of total
Firm
4 listings
22.2% of total
Strict
5 listings
27.8% of total
Cancellation Policy Insights for La Prairie
- The prevailing Airbnb cancellation policy trend in La Prairie is Moderate, used by 33.3% of listings.
- There's a relatively balanced mix between guest-friendly (50.0%) and stricter (50.0%) policies, offering choices for different guest needs.
Recommendations for Hosts
- Consider adopting a Moderate policy to align with the 33.3% market standard in La Prairie.
- Regularly review your cancellation policy against competitors and market demand shifts in La Prairie.
La Prairie STR Booking Lead Time Analysis (2025)
Average Booking Lead Time by Month
Booking Lead Time Insights for La Prairie
- The overall average booking lead time for vacation rentals in La Prairie is 42 days.
- Guests book furthest in advance for stays during September (average 78 days), likely coinciding with peak travel demand or local events.
- The shortest booking windows occur for stays in February (average 22 days), indicating more last-minute travel plans during this time.
- Seasonally, Fall (62 days avg.) sees the longest lead times, while Winter (23 days avg.) has the shortest, reflecting typical travel planning cycles.
Recommendations for Hosts
- Use the overall average lead time (42 days) as a baseline for your pricing and availability strategy in La Prairie.
- For September stays, consider implementing length-of-stay discounts or slightly higher rates for bookings made less than 78 days out to capitalize on advance planning.
- Target marketing efforts for the Fall season well in advance (at least 62 days) to capture early planners.
- Monitor your own booking lead times against these La Prairie averages to identify opportunities for dynamic pricing adjustments.
Popular & Essential Airbnb Amenities in La Prairie (2025)
Amenity Prevalence
Amenity Insights for La Prairie
- Essential amenities in La Prairie that guests expect include: Wifi, Smoke alarm, Kitchen, Free parking on premises, Heating, TV, Hot water. Lacking these (any) could significantly impact bookings.
- Popular amenities like Dishes and silverware, Hair dryer, Air conditioning are common but not universal. Offering these can provide a competitive edge.
Recommendations for Hosts
- Ensure your listing includes all essential amenities for La Prairie: Wifi, Smoke alarm, Kitchen, Free parking on premises, Heating, TV, Hot water.
- Prioritize adding missing essentials: Kitchen, Free parking on premises, Heating, TV, Hot water.
- Consider adding popular differentiators like Dishes and silverware or Hair dryer to increase appeal.
- Highlight unique or less common amenities you offer (e.g., hot tub, dedicated workspace, EV charger) in your listing description and photos.
- Regularly check competitor amenities in La Prairie to stay competitive.
La Prairie Airbnb Guest Demographics & Profile Analysis (2025)
Guest Profile Summary for La Prairie
- The typical guest profile for Airbnb in La Prairie consists of a mix of domestic (56%) and international guests, often arriving from nearby Toronto, typically belonging to the Post-2000s (Gen Z/Alpha) group (50%), primarily speaking English or French.
- Domestic travelers account for 56.3% of guests.
- Key international markets include Canada (56.3%) and United States (31.1%).
- Top languages spoken are English (52.1%) followed by French (15.8%).
- A significant demographic segment is the Post-2000s (Gen Z/Alpha) group, representing 50% of guests.
Recommendations for Hosts
- Balance marketing efforts between domestic and international channels based on the guest mix.
- Tailor amenities and listing descriptions to appeal to the dominant Post-2000s (Gen Z/Alpha) demographic (e.g., highlight fast WiFi, smart home features, local guides).
- Highlight unique local experiences or amenities relevant to the primary guest profile.
- Consider seasonal promotions aligned with peak travel times for key origin markets.
Nearby Short-Term Rental Market Comparison
How does the La Prairie Airbnb market stack up against its neighbors? Compare key performance metrics like average monthly revenue, ADR, and occupancy rates in surrounding areas to understand the broader regional STR landscape.
| Market | Active Properties | Monthly Revenue | Daily Rate | Avg. Occupancy |
|---|---|---|---|---|
| Mille-Isles | 93 | $5,049 | $415.08 | 41% |
| Malletts Bay | 49 | $4,960 | $414.58 | 48% |
| Stowe | 842 | $4,757 | $474.92 | 41% |
| Wilmington | 130 | $4,484 | $324.06 | 45% |
| Saint-Denis-de-Brompton | 28 | $4,459 | $383.13 | 34% |
| Calais | 16 | $4,320 | $299.79 | 49% |
| Grenville-sur-la-Rouge | 32 | $4,226 | $362.40 | 41% |
| Middlebury | 52 | $4,128 | $288.39 | 54% |
| Waterloo | 11 | $4,092 | $357.06 | 37% |
| Topsham | 13 | $3,952 | $265.51 | 50% |