Grenville-sur-la-Rouge Airbnb Market Analysis 2025: Short Term Rental Data & Vacation Rental Statistics in Quebec, Canada
Is Airbnb profitable in Grenville-sur-la-Rouge in 2025? Explore comprehensive Airbnb analytics for Grenville-sur-la-Rouge, Quebec, Canada to uncover income potential. This 2025 STR market report for Grenville-sur-la-Rouge, based on AirROI data from April 2024 to March 2025, reveals key trends in the niche market of 32 active listings.
Whether you're considering an Airbnb investment in Grenville-sur-la-Rouge, optimizing your existing vacation rental, or exploring rental arbitrage opportunities, understanding the Grenville-sur-la-Rouge Airbnb data is crucial. Navigating the high regulation landscape is key to maximizing your short term rental income potential. Let's dive into the specifics.
Key Grenville-sur-la-Rouge Airbnb Performance Metrics Overview
Monthly Airbnb Revenue Variations & Income Potential in Grenville-sur-la-Rouge (2025)
Understanding the monthly revenue variations for Airbnb listings in Grenville-sur-la-Rouge is key to maximizing your short term rental income potential. Seasonality significantly impacts earnings. Our analysis, based on data from the past 12 months, shows that the peak revenue month for STRs in Grenville-sur-la-Rouge is typically July, while March often presents the lowest earnings, highlighting opportunities for strategic pricing adjustments during shoulder and low seasons. Explore the typical Airbnb income in Grenville-sur-la-Rouge across different performance tiers:
- Best-in-class properties (Top 10%) achieve $11,553+ monthly, often utilizing dynamic pricing and superior guest experiences.
- Strong performing properties (Top 25%) earn $6,118 or more, indicating effective management and desirable locations/amenities.
- Typical properties (Median) generate around $3,625 per month, representing the average market performance.
- Entry-level properties (Bottom 25%) see earnings around $2,190, often with potential for optimization.
Average Monthly Airbnb Earnings Trend in Grenville-sur-la-Rouge
Grenville-sur-la-Rouge Airbnb Occupancy Rate Trends (2025)
Maximize your bookings by understanding the Grenville-sur-la-Rouge STR occupancy trends. Seasonal demand shifts significantly influence how often properties are booked. Typically, Julysees the highest demand (peak season occupancy), while February experiences the lowest (low season). Effective strategies, like adjusting minimum stays or offering promotions, can boost occupancy during slower periods. Here's how different property tiers perform in Grenville-sur-la-Rouge:
- Best-in-class properties (Top 10%) achieve 71%+ occupancy, indicating high desirability and potentially optimized availability.
- Strong performing properties (Top 25%) maintain 59% or higher occupancy, suggesting good market fit and guest satisfaction.
- Typical properties (Median) have an occupancy rate around 39%.
- Entry-level properties (Bottom 25%) average 26% occupancy, potentially facing higher vacancy.
Average Monthly Occupancy Rate Trend in Grenville-sur-la-Rouge
Average Daily Rate (ADR) Airbnb Trends in Grenville-sur-la-Rouge (2025)
Effective short term rental pricing strategy in Grenville-sur-la-Rouge involves understanding monthly ADR fluctuations. The Average Daily Rate (ADR) for Airbnb in Grenville-sur-la-Rouge typically peaks in December and dips lowest during April. Leveraging Airbnb dynamic pricing tools or strategies based on this seasonality can significantly boost revenue. Here's a look at the typical nightly rates achieved:
- Best-in-class properties (Top 10%) command rates of $758+ per night, often due to premium features or locations.
- Strong performing properties (Top 25%) achieve nightly rates of $470 or more.
- Typical properties (Median) charge around $224 per night.
- Entry-level properties (Bottom 25%) earn around $170 per night.
Average Daily Rate (ADR) Trend by Month in Grenville-sur-la-Rouge
Get Live Grenville-sur-la-Rouge Market Intelligence 👇

Explore Real-time Analytics
Airbnb Seasonality Analysis & Trends in Grenville-sur-la-Rouge (2025)
Peak Season (July, August, June)
- Revenue averages $7,921 per month
- Occupancy rates average 58.9%
- Daily rates average $340
Shoulder Season
- Revenue averages $4,705 per month
- Occupancy maintains around 38.3%
- Daily rates hold near $336
Low Season (February, March, November)
- Revenue drops to average $2,571 per month
- Occupancy decreases to average 31.4%
- Daily rates adjust to average $347
Seasonality Insights for Grenville-sur-la-Rouge
- The Airbnb seasonality in Grenville-sur-la-Rouge shows highly seasonal trends requiring careful strategy. While the sections above show seasonal averages, it's also insightful to look at the extremes:
- During the high season, the absolute peak month showcases Grenville-sur-la-Rouge's highest earning potential, with monthly revenues capable of climbing to $8,581, occupancy reaching a high of 66.4%, and ADRs peaking at $401.
- Conversely, the slowest single month of the year, typically falling within the low season, marks the market's lowest point. In this month, revenue might dip to $2,518, occupancy could drop to 29.8%, and ADRs may adjust down to $312.
- Understanding both the seasonal averages and these monthly peaks and troughs in revenue, occupancy, and ADR is crucial for maximizing your Airbnb profit potential in Grenville-sur-la-Rouge.
Seasonal Strategies for Maximizing Profit
- Peak Season: Maximize revenue through premium pricing and potentially longer minimum stays. Ensure high availability.
- Low Season: Offer competitive pricing, special promotions (e.g., extended stay discounts), and flexible cancellation policies. Target off-season travelers like remote workers or budget-conscious guests.
- Shoulder Seasons: Implement dynamic pricing that balances peak and low rates. Target weekend travelers or specific events. Offer slightly more flexible terms than peak season.
- Regularly analyze your own performance against these Grenville-sur-la-Rouge seasonality benchmarks and adjust your pricing and availability strategy accordingly.
Best Areas for Airbnb Investment in Grenville-sur-la-Rouge (2025)
Exploring the top neighborhoods for short-term rentals in Grenville-sur-la-Rouge? This section highlights key areas, outlining why they are attractive for hosts and guests, along with notable local attractions. Consider these locations based on your target guest profile and investment strategy.
| Neighborhood / Area | Why Host Here? (Target Guests & Appeal) | Key Attractions & Landmarks |
|---|---|---|
| Saint-Jerome | Largest city in the Laurentides and a gateway to outdoor activities and ski resorts. Attracts tourists year-round for its proximity to nature and charm. | Parc Regional de la Rivière du Nord, Cité de la Musique, Plein Air Sainte-Anne, Golf Le Diable, Ski Mont-Gabriel |
| Mont-Tremblant | Famous ski resort town known for winter sports and summer activities. A popular destination for both adventure seekers and relaxation seekers alike. | Mont Tremblant Ski Resort, Tremblant Village, Le P'tit Train du Nord, Casino de Mont-Tremblant, Parc national du Mont-Tremblant |
| Oka National Park | A serene natural setting perfect for nature lovers, hiking, and water activities. Great for hosting guests looking for a getaway in nature. | Oka Beach, Hiking trails, Cycling routes, Wildlife watching, Historic sites |
| Sainte-Agathe-des-Monts | Known for its beautiful lakes and year-round outdoor activities. Offers a peaceful atmosphere for vacationers. | Lac des Sables, Plein Air Sainte-Agathe, Ski resorts nearby, Cycling trails, Arts and crafts shops |
| Val-David | Artistic village in the Laurentians that boasts a strong arts and crafts community and beautiful natural surroundings. Attracts creatives and families. | Parc Regional Val-David-Val-Morin, Art galleries, Hiking trails, Local festivals, Cafés and shops |
| Mont-Laurier | Outdoor adventure and nature are central here, appealing to those seeking hiking, fishing, and winter sports. A peaceful retreat for travelers. | Parc de la Riviere du Nord, Ski resorts nearby, Fishing spots, Lakes and trails, Hiking opportunities |
| Lachute | A small town with charm and proximity to larger urban areas. Great for guests wanting local experiences and accessibility to the Laurentians. | Lachute River, Local markets, Historic buildings, Nearby nature parks, Cafés and restaurants |
| Gatineau Park | A stunning natural park that offers year-round activities from skiing in winter to hiking in summer. A prime location for nature enthusiasts. | Hiking trails, Biking paths, Lakes, Scenic viewpoints, Wildlife viewing |
Understanding Airbnb License Requirements & STR Laws in Grenville-sur-la-Rouge (2025)
Yes, Grenville-sur-la-Rouge, Quebec, Canada enforces high STR regulations. Obtaining a license and ensuring compliance is almost certainly required according to current 2025 STR laws. Always verify the latest short term rental regulations and Airbnb license requirements directly with local government authorities for Grenville-sur-la-Rouge to ensure full compliance before hosting.
(Source: AirROI data, 2025, based on 84% licensed listings)
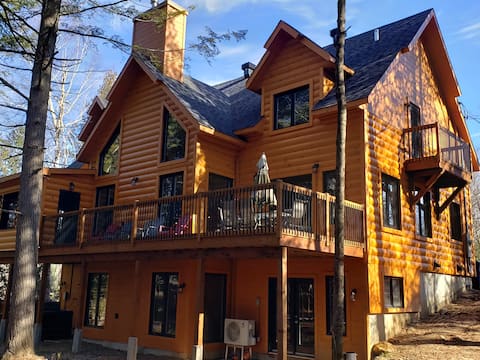
Top Performing Airbnb Properties in Grenville-sur-la-Rouge (2025)
Benchmark your potential! Explore examples of top-performing Airbnb properties in Grenville-sur-la-Rougebased on Trailing Twelve Month (TTM) revenue. Analyze their characteristics, revenue, occupancy rate, and ADR to understand what drives success in this market.

Domaine White Rocks Chalet #3 (Beach, 6 Bedrooms)
Entire Place • 6 bedrooms
Hollywood | Private Beach | Hot Tub | Games | 16 P
Entire Place • 6 bedrooms
Domaine White Rocks Chalet #5 (6 Bedrooms)
Entire Place • 6 bedrooms
Domaine White Rocks Chalet #1 (Beach, 6 Bedrooms)
Entire Place • 6 bedrooms
Domaine White Rocks Chalet #6 (Lakefront)
Entire Place • 6 bedrooms
La Grande Ourse - Lake & Spa
Entire Place • 6 bedrooms
Note: Performance varies based on location, size, amenities, seasonality, and management quality. Data reflects the past 12 months.
Top Performing Airbnb Hosts in Grenville-sur-la-Rouge (2025)
Learn from the best! This table showcases top-performing Airbnb hosts in Grenville-sur-la-Rouge based on the number of properties managed and estimated total revenue over the past year. Analyze their scale and performance metrics.
| Host Name | Properties | Grossing Revenue | Stay Reviews | Avg Rating |
|---|---|---|---|---|
| Sylvain | 6 | $606,974 | 97 | 4.06/5.0 |
| Yanis | 1 | $113,330 | 17 | 4.82/5.0 |
| Christian | 3 | $105,611 | 23 | 3.12/5.0 |
| Kevinnick | 2 | $92,119 | 44 | 4.86/5.0 |
| Jonathan | 1 | $91,209 | 45 | 4.89/5.0 |
| Bianca & Leo | 1 | $89,717 | 65 | 4.98/5.0 |
| Jonathan | 1 | $53,910 | 20 | 4.65/5.0 |
| Host #232408954 | 1 | $49,406 | 141 | 4.85/5.0 |
| Adrian | 1 | $48,166 | 92 | 4.93/5.0 |
| Emilie | 1 | $46,394 | 56 | 4.91/5.0 |
Analyzing the strategies of top hosts, such as their property selection, pricing, and guest communication, can offer valuable lessons for optimizing your own Airbnb operations in Grenville-sur-la-Rouge.
Dive Deeper: Advanced Grenville-sur-la-Rouge STR Market Data (2025)
Ready to unlock more insights? AirROI provides access to advanced metrics and comprehensive Airbnb data for Grenville-sur-la-Rouge. Explore detailed analytics beyond this report to refine your investment strategy, optimize pricing, and maximize your vacation rental profits.
Explore Advanced MetricsGrenville-sur-la-Rouge Short-Term Rental Market Composition (2025): Property & Room Types
Room Type Distribution
Property Type Distribution
Market Composition Insights for Grenville-sur-la-Rouge
- The Grenville-sur-la-Rouge Airbnb market composition is heavily skewed towards Entire Home/Apt listings, which make up 93.8% of the 32 active rentals. This indicates strong guest preference for privacy and space.
- Looking at the property type distribution in Grenville-sur-la-Rouge, House properties are the most common (93.8%), reflecting the local real estate landscape.
- Houses represent a significant 93.8% portion, catering likely to families or larger groups.
- The presence of 6.3% Hotel/Boutique listings indicates integration with traditional hospitality.
Grenville-sur-la-Rouge Airbnb Room Capacity Analysis (2025): Bedroom Distribution
Distribution of Listings by Number of Bedrooms
Room Capacity Insights for Grenville-sur-la-Rouge
- The dominant room capacity in Grenville-sur-la-Rouge is 5+ bedrooms listings, making up 31.3% of the market. This suggests a strong demand for properties suitable for families or small groups.
- Together, 5+ bedrooms and 2 bedrooms properties represent 53.2% of the active Airbnb listings in Grenville-sur-la-Rouge, indicating a high concentration in these sizes.
- A significant 62.6% of listings offer 3+ bedrooms, catering to larger groups and families seeking more space in Grenville-sur-la-Rouge.
Grenville-sur-la-Rouge Vacation Rental Guest Capacity Trends (2025)
Distribution of Listings by Guest Capacity
Guest Capacity Insights for Grenville-sur-la-Rouge
- The most common guest capacity trend in Grenville-sur-la-Rouge vacation rentals is listings accommodating 8+ guests (53.1%). This suggests the primary traveler segment is likely larger groups.
- Properties designed for 8+ guests and 6 guests dominate the Grenville-sur-la-Rouge STR market, accounting for 78.1% of listings.
- 84.4% of properties accommodate 6+ guests, serving the market segment for larger families or group travel in Grenville-sur-la-Rouge.
- On average, properties in Grenville-sur-la-Rouge are equipped to host 6.7 guests.
Grenville-sur-la-Rouge Airbnb Booking Patterns (2025): Available vs. Booked Days
Available Days Distribution
Booked Days Distribution
Booking Pattern Insights for Grenville-sur-la-Rouge
- The most common availability pattern in Grenville-sur-la-Rouge falls within the 181-270 days range, representing 53.1% of listings. This suggests many properties have significant open periods on their calendars.
- Approximately 71.9% of listings show high availability (181+ days open annually), indicating potential for increased bookings or specific owner usage patterns.
- For booked days, the 91-180 days range is most frequent in Grenville-sur-la-Rouge (50%), reflecting common guest stay durations or potential owner blocking patterns.
- A notable 31.3% of properties secure long booking periods (181+ days booked per year), highlighting successful long-term rental strategies or significant owner usage.
Grenville-sur-la-Rouge Airbnb Minimum Stay Requirements Analysis
Distribution of Listings by Minimum Night Requirement
1 Night
12 listings
38.7% of total
2 Nights
9 listings
29% of total
3 Nights
1 listings
3.2% of total
4-6 Nights
1 listings
3.2% of total
7-29 Nights
2 listings
6.5% of total
30+ Nights
6 listings
19.4% of total
Key Insights
- The most prevalent minimum stay requirement in Grenville-sur-la-Rouge is 1 Night, adopted by 38.7% of listings. This highlights the market's preference for shorter, flexible bookings.
- A strong majority (67.7%) of the Grenville-sur-la-Rouge Airbnb data shows acceptance of very short stays (1-2 nights), indicating a dynamic, high-turnover market.
- A significant segment (19.4%) caters to monthly stays (30+ nights) in Grenville-sur-la-Rouge, pointing to opportunities in the extended-stay market.
Recommendations
- Align with the market by considering a 1 Night minimum stay, as 38.7% of Grenville-sur-la-Rouge hosts use this setting.
- Explore offering discounts for stays of 30+ nights to attract the 19.4% of the market seeking extended stays.
- Adjust minimum nights based on seasonality – potentially shorter during low season and longer during peak demand periods in Grenville-sur-la-Rouge.
Grenville-sur-la-Rouge Airbnb Cancellation Policy Trends Analysis (2025)
Super Strict 30 Days
1 listings
3.6% of total
Super Strict 60 Days
1 listings
3.6% of total
Flexible
1 listings
3.6% of total
Moderate
8 listings
28.6% of total
Firm
7 listings
25% of total
Strict
10 listings
35.7% of total
Cancellation Policy Insights for Grenville-sur-la-Rouge
- The prevailing Airbnb cancellation policy trend in Grenville-sur-la-Rouge is Strict, used by 35.7% of listings.
- A majority (60.7%) of hosts in Grenville-sur-la-Rouge utilize Firm or Strict policies, indicating a market where hosts prioritize booking security.
Recommendations for Hosts
- Consider adopting a Strict policy to align with the 35.7% market standard in Grenville-sur-la-Rouge.
- With 35.7% using Strict terms, this is a viable option in Grenville-sur-la-Rouge, particularly for high-value properties or during peak demand periods.
- Regularly review your cancellation policy against competitors and market demand shifts in Grenville-sur-la-Rouge.
Grenville-sur-la-Rouge STR Booking Lead Time Analysis (2025)
Average Booking Lead Time by Month
Booking Lead Time Insights for Grenville-sur-la-Rouge
- The overall average booking lead time for vacation rentals in Grenville-sur-la-Rouge is 44 days.
- Guests book furthest in advance for stays during July (average 122 days), likely coinciding with peak travel demand or local events.
- The shortest booking windows occur for stays in March (average 36 days), indicating more last-minute travel plans during this time.
- Seasonally, Summer (100 days avg.) sees the longest lead times, while Fall (43 days avg.) has the shortest, reflecting typical travel planning cycles.
Recommendations for Hosts
- Use the overall average lead time (44 days) as a baseline for your pricing and availability strategy in Grenville-sur-la-Rouge.
- For July stays, consider implementing length-of-stay discounts or slightly higher rates for bookings made less than 122 days out to capitalize on advance planning.
- Target marketing efforts for the Summer season well in advance (at least 100 days) to capture early planners.
- Monitor your own booking lead times against these Grenville-sur-la-Rouge averages to identify opportunities for dynamic pricing adjustments.
Popular & Essential Airbnb Amenities in Grenville-sur-la-Rouge (2025)
Amenity Prevalence
Amenity Insights for Grenville-sur-la-Rouge
- Essential amenities in Grenville-sur-la-Rouge that guests expect include: TV, Wifi, Smoke alarm, Free parking on premises, Heating, Coffee maker, Essentials, Refrigerator, Kitchen, Hot water. Lacking these (any) could significantly impact bookings.
Recommendations for Hosts
- Ensure your listing includes all essential amenities for Grenville-sur-la-Rouge: TV, Wifi, Smoke alarm, Free parking on premises, Heating, Coffee maker, Essentials, Refrigerator, Kitchen, Hot water.
- Prioritize adding missing essentials: Coffee maker, Essentials, Refrigerator, Kitchen, Hot water.
- Highlight unique or less common amenities you offer (e.g., hot tub, dedicated workspace, EV charger) in your listing description and photos.
- Regularly check competitor amenities in Grenville-sur-la-Rouge to stay competitive.
Grenville-sur-la-Rouge Airbnb Guest Demographics & Profile Analysis (2025)
Guest Profile Summary for Grenville-sur-la-Rouge
- The typical guest profile for Airbnb in Grenville-sur-la-Rouge consists of primarily domestic travelers (84%), often arriving from nearby Montreal, typically belonging to the Post-2000s (Gen Z/Alpha) group (50%), primarily speaking English or French.
- Domestic travelers account for 84.1% of guests.
- Key international markets include Canada (84.1%) and United States (9%).
- Top languages spoken are English (47.3%) followed by French (32.9%).
- A significant demographic segment is the Post-2000s (Gen Z/Alpha) group, representing 50% of guests.
Recommendations for Hosts
- Target domestic marketing efforts towards travelers from Montreal and Ottawa.
- Tailor amenities and listing descriptions to appeal to the dominant Post-2000s (Gen Z/Alpha) demographic (e.g., highlight fast WiFi, smart home features, local guides).
- Highlight unique local experiences or amenities relevant to the primary guest profile.
- Consider seasonal promotions aligned with peak travel times for key origin markets.
Nearby Short-Term Rental Market Comparison
How does the Grenville-sur-la-Rouge Airbnb market stack up against its neighbors? Compare key performance metrics like average monthly revenue, ADR, and occupancy rates in surrounding areas to understand the broader regional STR landscape.
| Market | Active Properties | Monthly Revenue | Daily Rate | Avg. Occupancy |
|---|---|---|---|---|
| Mille-Isles | 93 | $5,049 | $415.08 | 41% |
| Malletts Bay | 49 | $4,960 | $414.58 | 48% |
| Wilmington | 130 | $4,484 | $324.06 | 45% |
| Middlebury | 52 | $4,128 | $288.39 | 54% |
| New Haven | 12 | $3,904 | $206.65 | 58% |
| South Burlington | 103 | $3,864 | $291.90 | 50% |
| La Conception | 172 | $3,846 | $290.12 | 42% |
| Town of North Elba | 249 | $3,765 | $395.96 | 41% |
| Cantley | 22 | $3,741 | $242.96 | 50% |
| Town of Jay | 204 | $3,710 | $276.34 | 47% |