Chambord Airbnb Market Analysis 2025: Short Term Rental Data & Vacation Rental Statistics in Quebec, Canada
Is Airbnb profitable in Chambord in 2025? Explore comprehensive Airbnb analytics for Chambord, Quebec, Canada to uncover income potential. This 2025 STR market report for Chambord, based on AirROI data from April 2024 to March 2025, reveals key trends in the niche market of 19 active listings.
Whether you're considering an Airbnb investment in Chambord, optimizing your existing vacation rental, or exploring rental arbitrage opportunities, understanding the Chambord Airbnb data is crucial. Navigating the high regulation landscape is key to maximizing your short term rental income potential. Let's dive into the specifics.
Key Chambord Airbnb Performance Metrics Overview
Monthly Airbnb Revenue Variations & Income Potential in Chambord (2025)
Understanding the monthly revenue variations for Airbnb listings in Chambord is key to maximizing your short term rental income potential. Seasonality significantly impacts earnings. Our analysis, based on data from the past 12 months, shows that the peak revenue month for STRs in Chambord is typically July, while February often presents the lowest earnings, highlighting opportunities for strategic pricing adjustments during shoulder and low seasons. Explore the typical Airbnb income in Chambord across different performance tiers:
- Best-in-class properties (Top 10%) achieve $3,602+ monthly, often utilizing dynamic pricing and superior guest experiences.
- Strong performing properties (Top 25%) earn $2,871 or more, indicating effective management and desirable locations/amenities.
- Typical properties (Median) generate around $1,813 per month, representing the average market performance.
- Entry-level properties (Bottom 25%) see earnings around $874, often with potential for optimization.
Average Monthly Airbnb Earnings Trend in Chambord
Chambord Airbnb Occupancy Rate Trends (2025)
Maximize your bookings by understanding the Chambord STR occupancy trends. Seasonal demand shifts significantly influence how often properties are booked. Typically, Octobersees the highest demand (peak season occupancy), while January experiences the lowest (low season). Effective strategies, like adjusting minimum stays or offering promotions, can boost occupancy during slower periods. Here's how different property tiers perform in Chambord:
- Best-in-class properties (Top 10%) achieve 85%+ occupancy, indicating high desirability and potentially optimized availability.
- Strong performing properties (Top 25%) maintain 67% or higher occupancy, suggesting good market fit and guest satisfaction.
- Typical properties (Median) have an occupancy rate around 45%.
- Entry-level properties (Bottom 25%) average 25% occupancy, potentially facing higher vacancy.
Average Monthly Occupancy Rate Trend in Chambord
Average Daily Rate (ADR) Airbnb Trends in Chambord (2025)
Effective short term rental pricing strategy in Chambord involves understanding monthly ADR fluctuations. The Average Daily Rate (ADR) for Airbnb in Chambord typically peaks in July and dips lowest during February. Leveraging Airbnb dynamic pricing tools or strategies based on this seasonality can significantly boost revenue. Here's a look at the typical nightly rates achieved:
- Best-in-class properties (Top 10%) command rates of $253+ per night, often due to premium features or locations.
- Strong performing properties (Top 25%) achieve nightly rates of $192 or more.
- Typical properties (Median) charge around $140 per night.
- Entry-level properties (Bottom 25%) earn around $88 per night.
Average Daily Rate (ADR) Trend by Month in Chambord
Get Live Chambord Market Intelligence 👇

Explore Real-time Analytics
Airbnb Seasonality Analysis & Trends in Chambord (2025)
Peak Season (July, August, October)
- Revenue averages $3,240 per month
- Occupancy rates average 64.6%
- Daily rates average $165
Shoulder Season
- Revenue averages $1,875 per month
- Occupancy maintains around 46.7%
- Daily rates hold near $149
Low Season (January, February, March)
- Revenue drops to average $933 per month
- Occupancy decreases to average 36.7%
- Daily rates adjust to average $126
Seasonality Insights for Chambord
- The Airbnb seasonality in Chambord shows highly seasonal trends requiring careful strategy. While the sections above show seasonal averages, it's also insightful to look at the extremes:
- During the high season, the absolute peak month showcases Chambord's highest earning potential, with monthly revenues capable of climbing to $3,692, occupancy reaching a high of 66.0%, and ADRs peaking at $171.
- Conversely, the slowest single month of the year, typically falling within the low season, marks the market's lowest point. In this month, revenue might dip to $788, occupancy could drop to 32.7%, and ADRs may adjust down to $123.
- Understanding both the seasonal averages and these monthly peaks and troughs in revenue, occupancy, and ADR is crucial for maximizing your Airbnb profit potential in Chambord.
Seasonal Strategies for Maximizing Profit
- Peak Season: Maximize revenue through premium pricing and potentially longer minimum stays. Ensure high availability.
- Low Season: Offer competitive pricing, special promotions (e.g., extended stay discounts), and flexible cancellation policies. Target off-season travelers like remote workers or budget-conscious guests.
- Shoulder Seasons: Implement dynamic pricing that balances peak and low rates. Target weekend travelers or specific events. Offer slightly more flexible terms than peak season.
- Regularly analyze your own performance against these Chambord seasonality benchmarks and adjust your pricing and availability strategy accordingly.
Best Areas for Airbnb Investment in Chambord (2025)
Exploring the top neighborhoods for short-term rentals in Chambord? This section highlights key areas, outlining why they are attractive for hosts and guests, along with notable local attractions. Consider these locations based on your target guest profile and investment strategy.
| Neighborhood / Area | Why Host Here? (Target Guests & Appeal) | Key Attractions & Landmarks |
|---|---|---|
| Château de Chambord | A UNESCO World Heritage site and an iconic French Renaissance castle, attracting tourists interested in history, architecture, and beautiful gardens. The castle offers guided tours and picturesque surroundings for photography and outdoor activities. | Château de Chambord, Gardens of Chambord, Loire Valley Cycling, Horse riding tours, Local wineries |
| Loire River | The banks of the Loire River provide beautiful scenic views and outdoor activities. Popular for fishing, cycling, and picnicking, this location attracts nature lovers and families looking for relaxing experiences. | Loire River, Cycling paths, Parks along the river, Fishing spots |
| Chambord Town Center | The main town area offers local dining and shopping experiences, perfect for travelers who want to enjoy local cuisine and culture. It’s also conveniently located for accessing various attractions nearby. | Local cafes, Boutique shops, Grocery stores, Cultural events, Fairs and markets |
| Nature Trails | This area encompasses various hiking and walking trails around Chambord, appealing to outdoor enthusiasts and families who enjoy nature walks, bird watching, and the tranquility of the forests. | Hiking paths, Bird watching spots, Nature observation |
| Nearby Vineyards | The Chambord area is known for its vineyards and wine production. This attracts tourists interested in wine tours and tastings, enhancing the cultural experience of the region. | Local vineyards, Wine tasting tours, Wine festivals, Gastronomic events |
| Local Artisans and Workshops | Chambord hosts various local artisans and craftspeople. This area appeals to tourists interested in workshops and handcrafted goods, providing a unique shopping experience. | Artisan workshops, Local crafts, Handmade goods, Cultural workshops |
| Outdoor Sports Areas | Chambord offers a range of outdoor sports activities, including kayaking, cycling, and fishing, attracting adventure seekers and sports enthusiasts. | Kayaking spots, Cycling trails, Fishing areas |
| Cultural Festivals | Chambord is home to various cultural festivals throughout the year. This area becomes a hub for cultural experiences, attracting tourists during festival times. | Music festivals, Food festivals, Cultural fairs, Local exhibitions |
Understanding Airbnb License Requirements & STR Laws in Chambord (2025)
Yes, Chambord, Quebec, Canada enforces high STR regulations. Obtaining a license and ensuring compliance is almost certainly required according to current 2025 STR laws. Always verify the latest short term rental regulations and Airbnb license requirements directly with local government authorities for Chambord to ensure full compliance before hosting.
(Source: AirROI data, 2025, based on 95% licensed listings)
Top Performing Airbnb Properties in Chambord (2025)
Benchmark your potential! Explore examples of top-performing Airbnb properties in Chambordbased on Trailing Twelve Month (TTM) revenue. Analyze their characteristics, revenue, occupancy rate, and ADR to understand what drives success in this market.
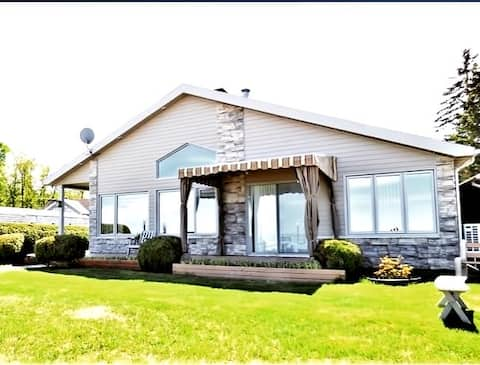
Private beach in Lac St-Jean
Entire Place • 3 bedrooms

Cozy & Intimate, Private Waterfront Terrace
Entire Place • 2 bedrooms
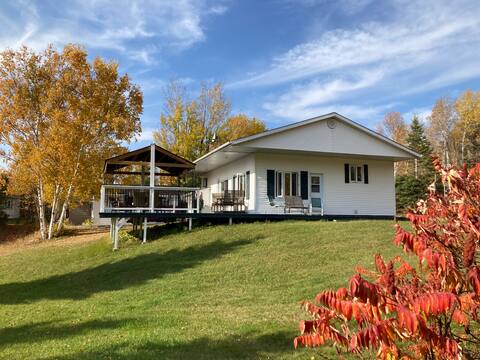
My LAKE house is a haven of peace!
Entire Place • 3 bedrooms

Hotel at Home - L 'Héritage on the Lake
Entire Place • 2 bedrooms

Entire home and hot tub right on Lac St Jean
Entire Place • 3 bedrooms
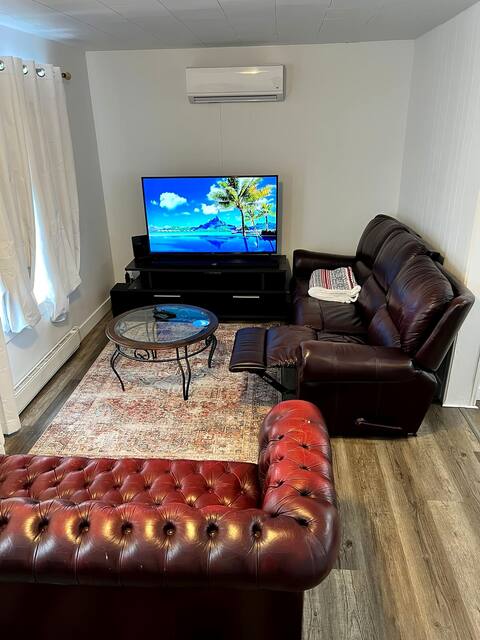
Homefeel Stylish Modern House
Entire Place • 4 bedrooms
Note: Performance varies based on location, size, amenities, seasonality, and management quality. Data reflects the past 12 months.
Top Performing Airbnb Hosts in Chambord (2025)
Learn from the best! This table showcases top-performing Airbnb hosts in Chambord based on the number of properties managed and estimated total revenue over the past year. Analyze their scale and performance metrics.
| Host Name | Properties | Grossing Revenue | Stay Reviews | Avg Rating |
|---|---|---|---|---|
| Mauricio | 4 | $78,644 | 254 | 4.90/5.0 |
| Julie | 1 | $37,507 | 66 | 4.85/5.0 |
| Isabelle | 1 | $33,704 | 70 | 4.86/5.0 |
| Doris Et Gil | 1 | $30,675 | 58 | 4.86/5.0 |
| Hôtel À La Maison | 1 | $27,820 | 19 | 4.79/5.0 |
| David | 1 | $27,193 | 281 | 4.95/5.0 |
| Viviane | 1 | $26,650 | 78 | 4.51/5.0 |
| Valérie | 1 | $25,608 | 66 | 4.85/5.0 |
| Pascale | 1 | $23,580 | 10 | 5.00/5.0 |
| Sébastien | 4 | $20,941 | 530 | 4.47/5.0 |
Analyzing the strategies of top hosts, such as their property selection, pricing, and guest communication, can offer valuable lessons for optimizing your own Airbnb operations in Chambord.
Dive Deeper: Advanced Chambord STR Market Data (2025)
Ready to unlock more insights? AirROI provides access to advanced metrics and comprehensive Airbnb data for Chambord. Explore detailed analytics beyond this report to refine your investment strategy, optimize pricing, and maximize your vacation rental profits.
Explore Advanced MetricsChambord Short-Term Rental Market Composition (2025): Property & Room Types
Room Type Distribution
Property Type Distribution
Market Composition Insights for Chambord
- The Chambord Airbnb market composition is heavily skewed towards Entire Home/Apt listings, which make up 73.7% of the 19 active rentals. This indicates strong guest preference for privacy and space.
- Looking at the property type distribution in Chambord, House properties are the most common (89.5%), reflecting the local real estate landscape.
- Houses represent a significant 89.5% portion, catering likely to families or larger groups.
Chambord Airbnb Room Capacity Analysis (2025): Bedroom Distribution
Distribution of Listings by Number of Bedrooms
Room Capacity Insights for Chambord
- The dominant room capacity in Chambord is 3 bedrooms listings, making up 47.4% of the market. This suggests a strong demand for properties suitable for families or small groups.
- Together, 3 bedrooms and 2 bedrooms properties represent 68.5% of the active Airbnb listings in Chambord, indicating a high concentration in these sizes.
- A significant 57.9% of listings offer 3+ bedrooms, catering to larger groups and families seeking more space in Chambord.
Chambord Vacation Rental Guest Capacity Trends (2025)
Distribution of Listings by Guest Capacity
Guest Capacity Insights for Chambord
- The most common guest capacity trend in Chambord vacation rentals is listings accommodating 8+ guests (47.4%). This suggests the primary traveler segment is likely larger groups.
- Properties designed for 8+ guests and 4 guests dominate the Chambord STR market, accounting for 63.2% of listings.
- 68.4% of properties accommodate 6+ guests, serving the market segment for larger families or group travel in Chambord.
- On average, properties in Chambord are equipped to host 5.9 guests.
Chambord Airbnb Booking Patterns (2025): Available vs. Booked Days
Available Days Distribution
Booked Days Distribution
Booking Pattern Insights for Chambord
- The most common availability pattern in Chambord falls within the 271-366 days range, representing 36.8% of listings. This suggests many properties have significant open periods on their calendars.
- Approximately 63.1% of listings show high availability (181+ days open annually), indicating potential for increased bookings or specific owner usage patterns.
- For booked days, the 181-270 days range is most frequent in Chambord (36.8%), reflecting common guest stay durations or potential owner blocking patterns.
- A notable 36.8% of properties secure long booking periods (181+ days booked per year), highlighting successful long-term rental strategies or significant owner usage.
Chambord Airbnb Minimum Stay Requirements Analysis
Distribution of Listings by Minimum Night Requirement
1 Night
4 listings
22.2% of total
2 Nights
7 listings
38.9% of total
4-6 Nights
1 listings
5.6% of total
30+ Nights
6 listings
33.3% of total
Key Insights
- The most prevalent minimum stay requirement in Chambord is 2 Nights, adopted by 38.9% of listings. This highlights the market's preference for shorter, flexible bookings.
- A strong majority (61.1%) of the Chambord Airbnb data shows acceptance of very short stays (1-2 nights), indicating a dynamic, high-turnover market.
- A significant segment (33.3%) caters to monthly stays (30+ nights) in Chambord, pointing to opportunities in the extended-stay market.
Recommendations
- Align with the market by considering a 2 Nights minimum stay, as 38.9% of Chambord hosts use this setting.
- If feasible, allowing 1-night stays, especially midweek or during low season, could capture last-minute bookings, as only 22.2% currently do.
- Explore offering discounts for stays of 30+ nights to attract the 33.3% of the market seeking extended stays.
- Adjust minimum nights based on seasonality – potentially shorter during low season and longer during peak demand periods in Chambord.
Chambord Airbnb Cancellation Policy Trends Analysis (2025)
Flexible
7 listings
36.8% of total
Moderate
1 listings
5.3% of total
Firm
3 listings
15.8% of total
Strict
8 listings
42.1% of total
Cancellation Policy Insights for Chambord
- The prevailing Airbnb cancellation policy trend in Chambord is Strict, used by 42.1% of listings.
- A majority (57.9%) of hosts in Chambord utilize Firm or Strict policies, indicating a market where hosts prioritize booking security.
Recommendations for Hosts
- Consider adopting a Strict policy to align with the 42.1% market standard in Chambord.
- With 42.1% using Strict terms, this is a viable option in Chambord, particularly for high-value properties or during peak demand periods.
- Regularly review your cancellation policy against competitors and market demand shifts in Chambord.
Chambord STR Booking Lead Time Analysis (2025)
Average Booking Lead Time by Month
Booking Lead Time Insights for Chambord
- The overall average booking lead time for vacation rentals in Chambord is 70 days.
- Guests book furthest in advance for stays during July (average 160 days), likely coinciding with peak travel demand or local events.
- The shortest booking windows occur for stays in March (average 33 days), indicating more last-minute travel plans during this time.
- Seasonally, Summer (137 days avg.) sees the longest lead times, while Winter (44 days avg.) has the shortest, reflecting typical travel planning cycles.
Recommendations for Hosts
- Use the overall average lead time (70 days) as a baseline for your pricing and availability strategy in Chambord.
- For July stays, consider implementing length-of-stay discounts or slightly higher rates for bookings made less than 160 days out to capitalize on advance planning.
- Target marketing efforts for the Summer season well in advance (at least 137 days) to capture early planners.
- Monitor your own booking lead times against these Chambord averages to identify opportunities for dynamic pricing adjustments.
Popular & Essential Airbnb Amenities in Chambord (2025)
Amenity Prevalence
Amenity Insights for Chambord
- Essential amenities in Chambord that guests expect include: Kitchen, Free parking on premises, Smoke alarm. Lacking these (any) could significantly impact bookings.
- Popular amenities like Hot water, Washer, Heating are common but not universal. Offering these can provide a competitive edge.
- Warning: Wifi is not universally provided but is considered essential globally. Ensure reliable Wifi is offered.
Recommendations for Hosts
- Ensure your listing includes all essential amenities for Chambord: Kitchen, Free parking on premises, Smoke alarm.
- Consider adding popular differentiators like Hot water or Washer to increase appeal.
- Highlight unique or less common amenities you offer (e.g., hot tub, dedicated workspace, EV charger) in your listing description and photos.
- Regularly check competitor amenities in Chambord to stay competitive.
Chambord Airbnb Guest Demographics & Profile Analysis (2025)
Guest Profile Summary for Chambord
- The typical guest profile for Airbnb in Chambord consists of a mix of domestic (41%) and international guests, with top international origins including Canada, typically belonging to the Post-2000s (Gen Z/Alpha) group (50%), primarily speaking French or English.
- Domestic travelers account for 41.3% of guests.
- Key international markets include France (51.1%) and Canada (41.3%).
- Top languages spoken are French (49%) followed by English (37.2%).
- A significant demographic segment is the Post-2000s (Gen Z/Alpha) group, representing 50% of guests.
Recommendations for Hosts
- Balance marketing efforts between domestic and international channels based on the guest mix.
- Tailor amenities and listing descriptions to appeal to the dominant Post-2000s (Gen Z/Alpha) demographic (e.g., highlight fast WiFi, smart home features, local guides).
- Highlight unique local experiences or amenities relevant to the primary guest profile.
- Consider seasonal promotions aligned with peak travel times for key origin markets.
Nearby Short-Term Rental Market Comparison
How does the Chambord Airbnb market stack up against its neighbors? Compare key performance metrics like average monthly revenue, ADR, and occupancy rates in surrounding areas to understand the broader regional STR landscape.
| Market | Active Properties | Monthly Revenue | Daily Rate | Avg. Occupancy |
|---|---|---|---|---|
| Sainte-Brigitte-de-Laval | 59 | $2,652 | $185.69 | 49% |
| Hébertville | 11 | $2,476 | $188.05 | 45% |
| Stoneham-et-Tewkesbury | 191 | $2,401 | $331.79 | 32% |
| Roberval | 24 | $2,263 | $138.52 | 60% |
| Saint-Gédéon | 16 | $1,829 | $152.79 | 49% |
| Métabetchouan–Lac-à-la-Croix | 12 | $1,650 | $159.50 | 40% |
| Saint-Henri-de-Taillon | 16 | $1,632 | $149.39 | 45% |
| Péribonka | 10 | $1,588 | $154.02 | 42% |
| Alma | 55 | $1,484 | $121.53 | 52% |
| Saint-Honoré | 12 | $1,466 | $154.76 | 42% |