Cayamant Airbnb Market Analysis 2025: Short Term Rental Data & Vacation Rental Statistics in Quebec, Canada
Is Airbnb profitable in Cayamant in 2025? Explore comprehensive Airbnb analytics for Cayamant, Quebec, Canada to uncover income potential. This 2025 STR market report for Cayamant, based on AirROI data from April 2024 to March 2025, reveals key trends in the niche market of 24 active listings.
Whether you're considering an Airbnb investment in Cayamant, optimizing your existing vacation rental, or exploring rental arbitrage opportunities, understanding the Cayamant Airbnb data is crucial. Navigating the high regulation landscape is key to maximizing your short term rental income potential. Let's dive into the specifics.
Key Cayamant Airbnb Performance Metrics Overview
Monthly Airbnb Revenue Variations & Income Potential in Cayamant (2025)
Understanding the monthly revenue variations for Airbnb listings in Cayamant is key to maximizing your short term rental income potential. Seasonality significantly impacts earnings. Our analysis, based on data from the past 12 months, shows that the peak revenue month for STRs in Cayamant is typically August, while January often presents the lowest earnings, highlighting opportunities for strategic pricing adjustments during shoulder and low seasons. Explore the typical Airbnb income in Cayamant across different performance tiers:
- Best-in-class properties (Top 10%) achieve $4,858+ monthly, often utilizing dynamic pricing and superior guest experiences.
- Strong performing properties (Top 25%) earn $3,004 or more, indicating effective management and desirable locations/amenities.
- Typical properties (Median) generate around $1,596 per month, representing the average market performance.
- Entry-level properties (Bottom 25%) see earnings around $739, often with potential for optimization.
Average Monthly Airbnb Earnings Trend in Cayamant
Cayamant Airbnb Occupancy Rate Trends (2025)
Maximize your bookings by understanding the Cayamant STR occupancy trends. Seasonal demand shifts significantly influence how often properties are booked. Typically, Augustsees the highest demand (peak season occupancy), while January experiences the lowest (low season). Effective strategies, like adjusting minimum stays or offering promotions, can boost occupancy during slower periods. Here's how different property tiers perform in Cayamant:
- Best-in-class properties (Top 10%) achieve 69%+ occupancy, indicating high desirability and potentially optimized availability.
- Strong performing properties (Top 25%) maintain 55% or higher occupancy, suggesting good market fit and guest satisfaction.
- Typical properties (Median) have an occupancy rate around 30%.
- Entry-level properties (Bottom 25%) average 17% occupancy, potentially facing higher vacancy.
Average Monthly Occupancy Rate Trend in Cayamant
Average Daily Rate (ADR) Airbnb Trends in Cayamant (2025)
Effective short term rental pricing strategy in Cayamant involves understanding monthly ADR fluctuations. The Average Daily Rate (ADR) for Airbnb in Cayamant typically peaks in August and dips lowest during February. Leveraging Airbnb dynamic pricing tools or strategies based on this seasonality can significantly boost revenue. Here's a look at the typical nightly rates achieved:
- Best-in-class properties (Top 10%) command rates of $277+ per night, often due to premium features or locations.
- Strong performing properties (Top 25%) achieve nightly rates of $204 or more.
- Typical properties (Median) charge around $142 per night.
- Entry-level properties (Bottom 25%) earn around $113 per night.
Average Daily Rate (ADR) Trend by Month in Cayamant
Get Live Cayamant Market Intelligence 👇

Explore Real-time Analytics
Airbnb Seasonality Analysis & Trends in Cayamant (2025)
Peak Season (August, June, July)
- Revenue averages $3,973 per month
- Occupancy rates average 57.3%
- Daily rates average $186
Shoulder Season
- Revenue averages $1,852 per month
- Occupancy maintains around 31.9%
- Daily rates hold near $163
Low Season (January, October, November)
- Revenue drops to average $1,162 per month
- Occupancy decreases to average 23.9%
- Daily rates adjust to average $159
Seasonality Insights for Cayamant
- The Airbnb seasonality in Cayamant shows highly seasonal trends requiring careful strategy. While the sections above show seasonal averages, it's also insightful to look at the extremes:
- During the high season, the absolute peak month showcases Cayamant's highest earning potential, with monthly revenues capable of climbing to $4,362, occupancy reaching a high of 63.0%, and ADRs peaking at $191.
- Conversely, the slowest single month of the year, typically falling within the low season, marks the market's lowest point. In this month, revenue might dip to $918, occupancy could drop to 19.8%, and ADRs may adjust down to $145.
- Understanding both the seasonal averages and these monthly peaks and troughs in revenue, occupancy, and ADR is crucial for maximizing your Airbnb profit potential in Cayamant.
Seasonal Strategies for Maximizing Profit
- Peak Season: Maximize revenue through premium pricing and potentially longer minimum stays. Ensure high availability.
- Low Season: Offer competitive pricing, special promotions (e.g., extended stay discounts), and flexible cancellation policies. Target off-season travelers like remote workers or budget-conscious guests.
- Shoulder Seasons: Implement dynamic pricing that balances peak and low rates. Target weekend travelers or specific events. Offer slightly more flexible terms than peak season.
- Regularly analyze your own performance against these Cayamant seasonality benchmarks and adjust your pricing and availability strategy accordingly.
Best Areas for Airbnb Investment in Cayamant (2025)
Exploring the top neighborhoods for short-term rentals in Cayamant? This section highlights key areas, outlining why they are attractive for hosts and guests, along with notable local attractions. Consider these locations based on your target guest profile and investment strategy.
| Neighborhood / Area | Why Host Here? (Target Guests & Appeal) | Key Attractions & Landmarks |
|---|---|---|
| Cayamant Lake | Scenic, tranquil lake perfect for nature enthusiasts and those looking to relax. Ideal for families and individuals seeking outdoor activities such as canoeing and fishing. | Cayamant Lake beach, Hiking trails, Fishing spots, Canoeing opportunities, Nature photography |
| Montagne de l’Ermite | A beautiful mountain area offering hiking and stunning views of the surroundings. Attracts visitors looking for outdoor adventures and breathtaking landscapes. | Hiking trails, Scenic viewpoints, Wildlife watching, Nature exploration, Photography spots |
| Cayamant Village | Charming village atmosphere with a rich history and local culture. Appeals to visitors interested in a quiet retreat with local amenities. | Local markets, Cultural heritage sites, Community events, Restaurants and cafés, Art galleries |
| Parc National de la Mauricie (nearby) | Nearby national park known for its beautiful landscapes and diverse wildlife. A must-visit for nature lovers and outdoor sports enthusiasts. | Hiking trails, Camping, Wildlife viewing, Kayaking, Scenic landscapes |
| Les Jardins de la Culture | A lovely garden space for relaxation and education about local flora. Appeals to families and individuals looking for a peaceful environment. | Botanical gardens, Nature walks, Cultural workshops, Picnic areas, Art installations |
| Sentiers de l’Estrie (nearby) | This nearby area offers extensive trails for biking and hiking. Great for adventure seekers and tourists looking for active experiences. | Biking trails, Hiking paths, Nature exploration, Wildlife sightings, Outdoor sports |
| Local Arts and Crafts Studios | Promotes local artisans and craftspeople, attracting visitors interested in unique handmade items and cultural experiences. | Art studios, Craft workshops, Local art exhibitions, Unique souvenir shopping, Cultural experiences |
| Winter Sports Areas (nearby) | Areas nearby providing winter sports activities like skiing and snowshoeing, appealing to winter enthusiasts and tourists. | Ski resorts, Snowshoeing trails, Ice fishing spots, Winter hiking areas, Sledding hills |
Understanding Airbnb License Requirements & STR Laws in Cayamant (2025)
Yes, Cayamant, Quebec, Canada enforces high STR regulations. Obtaining a license and ensuring compliance is almost certainly required according to current 2025 STR laws. Always verify the latest short term rental regulations and Airbnb license requirements directly with local government authorities for Cayamant to ensure full compliance before hosting.
(Source: AirROI data, 2025, based on 71% licensed listings)
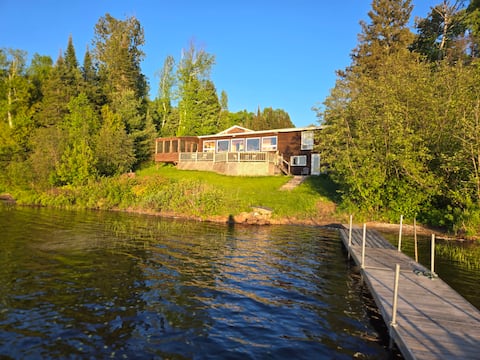
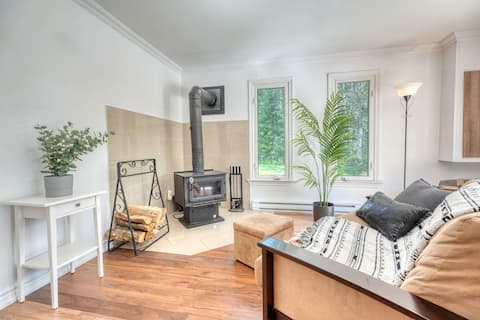
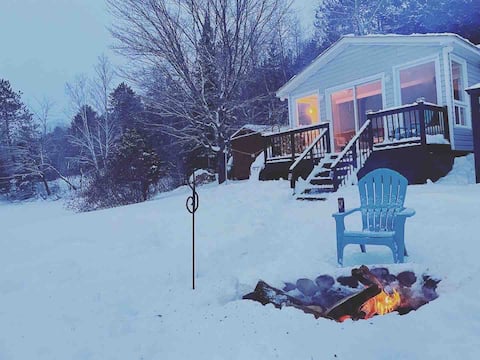
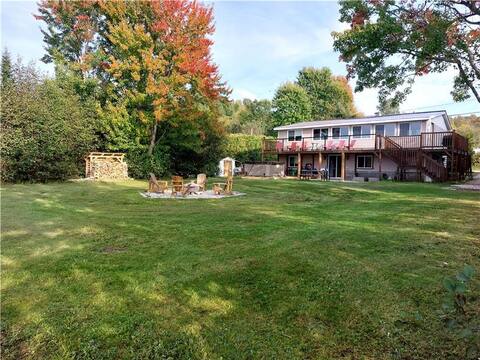
Top Performing Airbnb Properties in Cayamant (2025)
Benchmark your potential! Explore examples of top-performing Airbnb properties in Cayamantbased on Trailing Twelve Month (TTM) revenue. Analyze their characteristics, revenue, occupancy rate, and ADR to understand what drives success in this market.

Nature, Luxury, Snowmobiling, Skiing, Ice Fishing!
Entire Place • 4 bedrooms
Haven of the Aurora |Waterfront with Spa
Entire Place • 3 bedrooms
The Enchanting Peaceful Escape in Nature
Entire Place • 2 bedrooms
Cozy Boho Lake House
Entire Place • 1 bedroom

Brand new cottage oasis directly on the lake!
Entire Place • 4 bedrooms
Lester's Lakehouse
Entire Place • 4 bedrooms
Note: Performance varies based on location, size, amenities, seasonality, and management quality. Data reflects the past 12 months.
Top Performing Airbnb Hosts in Cayamant (2025)
Learn from the best! This table showcases top-performing Airbnb hosts in Cayamant based on the number of properties managed and estimated total revenue over the past year. Analyze their scale and performance metrics.
| Host Name | Properties | Grossing Revenue | Stay Reviews | Avg Rating |
|---|---|---|---|---|
| Tracy | 1 | $59,904 | 11 | 5.00/5.0 |
| Chaletô | 1 | $39,115 | 14 | 4.71/5.0 |
| Gurmeet Singh | 2 | $34,615 | 109 | 4.84/5.0 |
| Elodie | 1 | $33,887 | 72 | 4.88/5.0 |
| Karina | 1 | $32,681 | 160 | 4.95/5.0 |
| Kate | 1 | $30,906 | 24 | 4.75/5.0 |
| Julie | 2 | $27,134 | 14 | 4.51/5.0 |
| Host #1831144 | 1 | $27,056 | 0 | 0.00/5.0 |
| Rebekah | 1 | $26,077 | 24 | 4.71/5.0 |
| Tyson | 1 | $20,755 | 22 | 4.86/5.0 |
Analyzing the strategies of top hosts, such as their property selection, pricing, and guest communication, can offer valuable lessons for optimizing your own Airbnb operations in Cayamant.
Dive Deeper: Advanced Cayamant STR Market Data (2025)
Ready to unlock more insights? AirROI provides access to advanced metrics and comprehensive Airbnb data for Cayamant. Explore detailed analytics beyond this report to refine your investment strategy, optimize pricing, and maximize your vacation rental profits.
Explore Advanced MetricsCayamant Short-Term Rental Market Composition (2025): Property & Room Types
Room Type Distribution
Property Type Distribution
Market Composition Insights for Cayamant
- The Cayamant Airbnb market composition is heavily skewed towards Entire Home/Apt listings, which make up 95.8% of the 24 active rentals. This indicates strong guest preference for privacy and space.
- Looking at the property type distribution in Cayamant, House properties are the most common (75%), reflecting the local real estate landscape.
- Houses represent a significant 75% portion, catering likely to families or larger groups.
Cayamant Airbnb Room Capacity Analysis (2025): Bedroom Distribution
Distribution of Listings by Number of Bedrooms
Room Capacity Insights for Cayamant
- The dominant room capacity in Cayamant is 2 bedrooms listings, making up 33.3% of the market. This suggests a strong demand for properties suitable for couples or solo travelers.
- Together, 2 bedrooms and 4 bedrooms properties represent 58.3% of the active Airbnb listings in Cayamant, indicating a high concentration in these sizes.
- A significant 41.7% of listings offer 3+ bedrooms, catering to larger groups and families seeking more space in Cayamant.
Cayamant Vacation Rental Guest Capacity Trends (2025)
Distribution of Listings by Guest Capacity
Guest Capacity Insights for Cayamant
- The most common guest capacity trend in Cayamant vacation rentals is listings accommodating 8+ guests (41.7%). This suggests the primary traveler segment is likely larger groups.
- Properties designed for 8+ guests and 4 guests dominate the Cayamant STR market, accounting for 70.9% of listings.
- 54.2% of properties accommodate 6+ guests, serving the market segment for larger families or group travel in Cayamant.
- On average, properties in Cayamant are equipped to host 5.8 guests.
Cayamant Airbnb Booking Patterns (2025): Available vs. Booked Days
Available Days Distribution
Booked Days Distribution
Booking Pattern Insights for Cayamant
- The most common availability pattern in Cayamant falls within the 271-366 days range, representing 58.3% of listings. This suggests many properties have significant open periods on their calendars.
- Approximately 91.6% of listings show high availability (181+ days open annually), indicating potential for increased bookings or specific owner usage patterns.
- For booked days, the 91-180 days range is most frequent in Cayamant (41.7%), reflecting common guest stay durations or potential owner blocking patterns.
- A notable 8.3% of properties secure long booking periods (181+ days booked per year), highlighting successful long-term rental strategies or significant owner usage.
Cayamant Airbnb Minimum Stay Requirements Analysis
Distribution of Listings by Minimum Night Requirement
1 Night
3 listings
15.8% of total
2 Nights
9 listings
47.4% of total
3 Nights
1 listings
5.3% of total
4-6 Nights
1 listings
5.3% of total
7-29 Nights
1 listings
5.3% of total
30+ Nights
4 listings
21.1% of total
Key Insights
- The most prevalent minimum stay requirement in Cayamant is 2 Nights, adopted by 47.4% of listings. This highlights the market's preference for shorter, flexible bookings.
- A strong majority (63.2%) of the Cayamant Airbnb data shows acceptance of very short stays (1-2 nights), indicating a dynamic, high-turnover market.
- A significant segment (21.1%) caters to monthly stays (30+ nights) in Cayamant, pointing to opportunities in the extended-stay market.
Recommendations
- Align with the market by considering a 2 Nights minimum stay, as 47.4% of Cayamant hosts use this setting.
- If feasible, allowing 1-night stays, especially midweek or during low season, could capture last-minute bookings, as only 15.8% currently do.
- A 2-night minimum appears standard (47.4%). Consider this for weekends or peak periods.
- Explore offering discounts for stays of 30+ nights to attract the 21.1% of the market seeking extended stays.
- Adjust minimum nights based on seasonality – potentially shorter during low season and longer during peak demand periods in Cayamant.
Cayamant Airbnb Cancellation Policy Trends Analysis (2025)
Super Strict 30 Days
1 listings
5.6% of total
Flexible
3 listings
16.7% of total
Moderate
5 listings
27.8% of total
Firm
8 listings
44.4% of total
Strict
1 listings
5.6% of total
Cancellation Policy Insights for Cayamant
- The prevailing Airbnb cancellation policy trend in Cayamant is Firm, used by 44.4% of listings.
- There's a relatively balanced mix between guest-friendly (44.5%) and stricter (50.0%) policies, offering choices for different guest needs.
- Strict cancellation policies are quite rare (5.6%), potentially making listings with this policy less competitive unless justified by high demand or property type.
Recommendations for Hosts
- Consider adopting a Firm policy to align with the 44.4% market standard in Cayamant.
- Using a Strict policy might deter some guests, as only 5.6% of listings use it. Evaluate if potential revenue protection outweighs possible lower booking rates.
- Regularly review your cancellation policy against competitors and market demand shifts in Cayamant.
Cayamant STR Booking Lead Time Analysis (2025)
Average Booking Lead Time by Month
Booking Lead Time Insights for Cayamant
- The overall average booking lead time for vacation rentals in Cayamant is 37 days.
- Guests book furthest in advance for stays during July (average 93 days), likely coinciding with peak travel demand or local events.
- The shortest booking windows occur for stays in February (average 15 days), indicating more last-minute travel plans during this time.
- Seasonally, Summer (69 days avg.) sees the longest lead times, while Spring (23 days avg.) has the shortest, reflecting typical travel planning cycles.
Recommendations for Hosts
- Use the overall average lead time (37 days) as a baseline for your pricing and availability strategy in Cayamant.
- For July stays, consider implementing length-of-stay discounts or slightly higher rates for bookings made less than 93 days out to capitalize on advance planning.
- Target marketing efforts for the Summer season well in advance (at least 69 days) to capture early planners.
- Monitor your own booking lead times against these Cayamant averages to identify opportunities for dynamic pricing adjustments.
Popular & Essential Airbnb Amenities in Cayamant (2025)
Amenity Prevalence
Amenity Insights for Cayamant
- Essential amenities in Cayamant that guests expect include: Smoke alarm, Wifi, Free parking on premises, Heating, Kitchen, Hot water, Fire extinguisher, TV, BBQ grill. Lacking these (any) could significantly impact bookings.
- Popular amenities like Dryer are common but not universal. Offering these can provide a competitive edge.
Recommendations for Hosts
- Ensure your listing includes all essential amenities for Cayamant: Smoke alarm, Wifi, Free parking on premises, Heating, Kitchen, Hot water, Fire extinguisher, TV, BBQ grill.
- Prioritize adding missing essentials: Fire extinguisher, TV, BBQ grill.
- Consider adding popular differentiators like Dryer to increase appeal.
- Highlight unique or less common amenities you offer (e.g., hot tub, dedicated workspace, EV charger) in your listing description and photos.
- Regularly check competitor amenities in Cayamant to stay competitive.
Cayamant Airbnb Guest Demographics & Profile Analysis (2025)
Guest Profile Summary for Cayamant
- The typical guest profile for Airbnb in Cayamant consists of primarily domestic travelers (94%), often arriving from nearby Ottawa, typically belonging to the Post-2000s (Gen Z/Alpha) group (50%), primarily speaking English or French.
- Domestic travelers account for 93.6% of guests.
- Key international markets include Canada (93.6%) and France (1.4%).
- Top languages spoken are English (46%) followed by French (32.5%).
- A significant demographic segment is the Post-2000s (Gen Z/Alpha) group, representing 50% of guests.
Recommendations for Hosts
- Target domestic marketing efforts towards travelers from Ottawa and Gatineau.
- Tailor amenities and listing descriptions to appeal to the dominant Post-2000s (Gen Z/Alpha) demographic (e.g., highlight fast WiFi, smart home features, local guides).
- Highlight unique local experiences or amenities relevant to the primary guest profile.
- Consider seasonal promotions aligned with peak travel times for key origin markets.
Nearby Short-Term Rental Market Comparison
How does the Cayamant Airbnb market stack up against its neighbors? Compare key performance metrics like average monthly revenue, ADR, and occupancy rates in surrounding areas to understand the broader regional STR landscape.
| Market | Active Properties | Monthly Revenue | Daily Rate | Avg. Occupancy |
|---|---|---|---|---|
| Cantley | 22 | $3,741 | $242.96 | 50% |
| Val-des-Monts | 120 | $2,907 | $234.15 | 47% |
| Beckwith | 13 | $2,740 | $258.12 | 38% |
| Chute-Saint-Philippe | 25 | $2,556 | $219.16 | 37% |
| Faraday | 60 | $2,531 | $254.35 | 39% |
| Greater Madawaska | 106 | $2,523 | $225.27 | 42% |
| Duhamel | 19 | $2,512 | $232.95 | 39% |
| Lac-Simon | 24 | $2,512 | $283.09 | 31% |
| Saint-André-Avellin | 16 | $2,384 | $205.47 | 37% |
| McNab/Braeside | 16 | $2,366 | $172.54 | 51% |