Brossard Airbnb Market Analysis 2025: Short Term Rental Data & Vacation Rental Statistics in Quebec, Canada
Is Airbnb profitable in Brossard in 2025? Explore comprehensive Airbnb analytics for Brossard, Quebec, Canada to uncover income potential. This 2025 STR market report for Brossard, based on AirROI data from April 2024 to March 2025, reveals key trends in the niche market of 109 active listings.
Whether you're considering an Airbnb investment in Brossard, optimizing your existing vacation rental, or exploring rental arbitrage opportunities, understanding the Brossard Airbnb data is crucial. Navigating the high regulation landscape is key to maximizing your short term rental income potential. Let's dive into the specifics.
Key Brossard Airbnb Performance Metrics Overview
Monthly Airbnb Revenue Variations & Income Potential in Brossard (2025)
Understanding the monthly revenue variations for Airbnb listings in Brossard is key to maximizing your short term rental income potential. Seasonality significantly impacts earnings. Our analysis, based on data from the past 12 months, shows that the peak revenue month for STRs in Brossard is typically May, while March often presents the lowest earnings, highlighting opportunities for strategic pricing adjustments during shoulder and low seasons. Explore the typical Airbnb income in Brossard across different performance tiers:
- Best-in-class properties (Top 10%) achieve $5,884+ monthly, often utilizing dynamic pricing and superior guest experiences.
- Strong performing properties (Top 25%) earn $3,646 or more, indicating effective management and desirable locations/amenities.
- Typical properties (Median) generate around $2,122 per month, representing the average market performance.
- Entry-level properties (Bottom 25%) see earnings around $807, often with potential for optimization.
Average Monthly Airbnb Earnings Trend in Brossard
Brossard Airbnb Occupancy Rate Trends (2025)
Maximize your bookings by understanding the Brossard STR occupancy trends. Seasonal demand shifts significantly influence how often properties are booked. Typically, Augustsees the highest demand (peak season occupancy), while February experiences the lowest (low season). Effective strategies, like adjusting minimum stays or offering promotions, can boost occupancy during slower periods. Here's how different property tiers perform in Brossard:
- Best-in-class properties (Top 10%) achieve 85%+ occupancy, indicating high desirability and potentially optimized availability.
- Strong performing properties (Top 25%) maintain 71% or higher occupancy, suggesting good market fit and guest satisfaction.
- Typical properties (Median) have an occupancy rate around 45%.
- Entry-level properties (Bottom 25%) average 20% occupancy, potentially facing higher vacancy.
Average Monthly Occupancy Rate Trend in Brossard
Average Daily Rate (ADR) Airbnb Trends in Brossard (2025)
Effective short term rental pricing strategy in Brossard involves understanding monthly ADR fluctuations. The Average Daily Rate (ADR) for Airbnb in Brossard typically peaks in January and dips lowest during October. Leveraging Airbnb dynamic pricing tools or strategies based on this seasonality can significantly boost revenue. Here's a look at the typical nightly rates achieved:
- Best-in-class properties (Top 10%) command rates of $238+ per night, often due to premium features or locations.
- Strong performing properties (Top 25%) achieve nightly rates of $150 or more.
- Typical properties (Median) charge around $96 per night.
- Entry-level properties (Bottom 25%) earn around $58 per night.
Average Daily Rate (ADR) Trend by Month in Brossard
Get Live Brossard Market Intelligence 👇

Explore Real-time Analytics
Airbnb Seasonality Analysis & Trends in Brossard (2025)
Peak Season (May, April, June)
- Revenue averages $3,936 per month
- Occupancy rates average 45.7%
- Daily rates average $121
Shoulder Season
- Revenue averages $2,635 per month
- Occupancy maintains around 52.4%
- Daily rates hold near $125
Low Season (January, February, March)
- Revenue drops to average $1,499 per month
- Occupancy decreases to average 34.9%
- Daily rates adjust to average $129
Seasonality Insights for Brossard
- The Airbnb seasonality in Brossard shows highly seasonal trends requiring careful strategy. While the sections above show seasonal averages, it's also insightful to look at the extremes:
- During the high season, the absolute peak month showcases Brossard's highest earning potential, with monthly revenues capable of climbing to $4,119, occupancy reaching a high of 62.6%, and ADRs peaking at $140.
- Conversely, the slowest single month of the year, typically falling within the low season, marks the market's lowest point. In this month, revenue might dip to $1,332, occupancy could drop to 33.3%, and ADRs may adjust down to $118.
- Understanding both the seasonal averages and these monthly peaks and troughs in revenue, occupancy, and ADR is crucial for maximizing your Airbnb profit potential in Brossard.
Seasonal Strategies for Maximizing Profit
- Peak Season: Maximize revenue through premium pricing and potentially longer minimum stays. Ensure high availability.
- Low Season: Offer competitive pricing, special promotions (e.g., extended stay discounts), and flexible cancellation policies. Target off-season travelers like remote workers or budget-conscious guests.
- Shoulder Seasons: Implement dynamic pricing that balances peak and low rates. Target weekend travelers or specific events. Offer slightly more flexible terms than peak season.
- Regularly analyze your own performance against these Brossard seasonality benchmarks and adjust your pricing and availability strategy accordingly.
Best Areas for Airbnb Investment in Brossard (2025)
Exploring the top neighborhoods for short-term rentals in Brossard? This section highlights key areas, outlining why they are attractive for hosts and guests, along with notable local attractions. Consider these locations based on your target guest profile and investment strategy.
| Neighborhood / Area | Why Host Here? (Target Guests & Appeal) | Key Attractions & Landmarks |
|---|---|---|
| Saint-Lambert | A charming suburb with beautiful parks and waterfront views, ideal for families and professionals. Close to downtown Brossard and Montreal, offering a quiet yet convenient lifestyle. | Parc des Prairies, Parc de la Seigneurie, Promenade de l'Étang, Saint-Lambert Village, biking paths along the waterfront |
| Brossard City Centre | The heart of Brossard with shopping, dining, and recreational facilities. It's an emerging area with many new developments, attracting both tourists and locals. | Quartier DIX30, Brossard Public Market, Brossard Recreation Centre, Cineplex Cinemas |
| Greenfield Park | Known for its greenery and residential ambiance, this area attracts families and those looking for a peaceful environment. Close to schools and parks makes it appealing for long-term rentals. | Parc Jean-Drapeau, Greenfield Park Marina, Nature parks, local sports complexes |
| South Brossard | A developing neighborhood with new construction and easy access to transportation. Ideal for short-term stays as it has quick links to downtown Montreal and attractions. | Access to highways, new shopping malls, upcoming dining spots |
| La Prairie | A picturesque town just on the outskirts of Brossard, offering a quaint charm with its historic sites and river views. Perfect for visitors looking for a peaceful getaway close to the city. | Parc de la Rivière, Old La Prairie Village, local cafes, historic buildings |
| Candiac | A small and affluent town nearby, known for its beautiful homes and parks. Attracts travelers looking for a suburban experience with easy access to urban amenities. | Candiac Golf Club, local parks, quiet residential streets |
| Terminus Brossard | A transit hub, making it convenient for tourists who rely on public transport to explore the greater Montreal area. Close to shopping and dining. | bus and train access, shopping areas nearby, quick access to Montreal |
| East Brossard | A residential area with a mix of cultures and communities. It’s lively and diverse, making it attractive for Airbnb investors looking to cater to a wide range of guests. | local markets, community events, parks and recreational facilities |
Understanding Airbnb License Requirements & STR Laws in Brossard (2025)
Yes, Brossard, Quebec, Canada enforces high STR regulations. Obtaining a license and ensuring compliance is almost certainly required according to current 2025 STR laws. Always verify the latest short term rental regulations and Airbnb license requirements directly with local government authorities for Brossard to ensure full compliance before hosting.
(Source: AirROI data, 2025, based on 61% licensed listings)
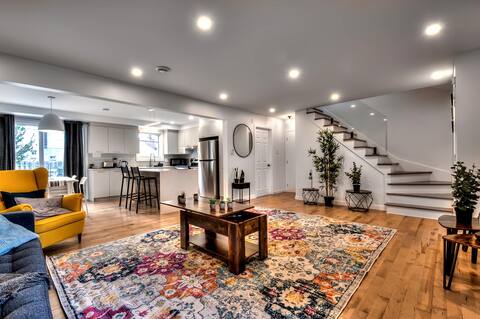
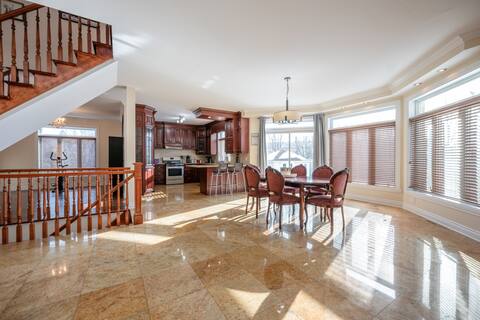
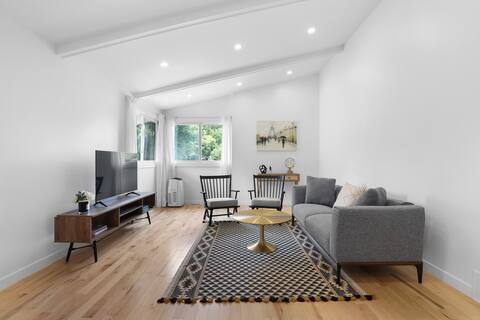
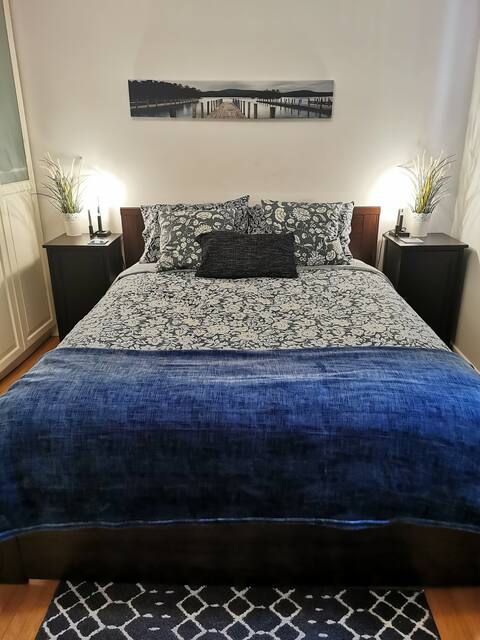
Top Performing Airbnb Properties in Brossard (2025)
Benchmark your potential! Explore examples of top-performing Airbnb properties in Brossardbased on Trailing Twelve Month (TTM) revenue. Analyze their characteristics, revenue, occupancy rate, and ADR to understand what drives success in this market.
Lux. 4BR House with Pool near DT
Entire Place • 4 bedrooms
Premier Estate : Sumptuous Stay
Entire Place • 4 bedrooms
Stylish 4BR House close to DT
Entire Place • 4 bedrooms
Quiet HOME 10minutes to Montréal +4FreeParking
Entire Place • 5 bedrooms
Stylish 6-BR House close to DT with free parking
Entire Place • 6 bedrooms
Luxurious Cozy Retreat | Two Free Parking Spots
Entire Place • 4 bedrooms
Note: Performance varies based on location, size, amenities, seasonality, and management quality. Data reflects the past 12 months.
Top Performing Airbnb Hosts in Brossard (2025)
Learn from the best! This table showcases top-performing Airbnb hosts in Brossard based on the number of properties managed and estimated total revenue over the past year. Analyze their scale and performance metrics.
| Host Name | Properties | Grossing Revenue | Stay Reviews | Avg Rating |
|---|---|---|---|---|
| Qualco | 7 | $417,120 | 426 | 4.53/5.0 |
| Jason | 2 | $110,769 | 173 | 4.95/5.0 |
| Carolina | 7 | $106,876 | 238 | 4.58/5.0 |
| Host #275384250 | 1 | $91,279 | 10 | 5.00/5.0 |
| Limin | 1 | $71,157 | 46 | 4.80/5.0 |
| Laura | 2 | $70,460 | 26 | 4.97/5.0 |
| Lara | 1 | $70,294 | 39 | 4.67/5.0 |
| Andi | 2 | $70,288 | 156 | 4.90/5.0 |
| Angela | 1 | $69,725 | 48 | 5.00/5.0 |
| Jenny | 3 | $66,971 | 77 | 4.76/5.0 |
Analyzing the strategies of top hosts, such as their property selection, pricing, and guest communication, can offer valuable lessons for optimizing your own Airbnb operations in Brossard.
Dive Deeper: Advanced Brossard STR Market Data (2025)
Ready to unlock more insights? AirROI provides access to advanced metrics and comprehensive Airbnb data for Brossard. Explore detailed analytics beyond this report to refine your investment strategy, optimize pricing, and maximize your vacation rental profits.
Explore Advanced MetricsBrossard Short-Term Rental Market Composition (2025): Property & Room Types
Room Type Distribution
Property Type Distribution
Market Composition Insights for Brossard
- The Brossard Airbnb market composition is heavily skewed towards Entire Home/Apt listings, which make up 68.8% of the 109 active rentals. This indicates strong guest preference for privacy and space.
- However, a notable 30.3% share for Private Rooms suggests opportunities for budget-conscious travelers or hosts renting out spare rooms.
- Looking at the property type distribution in Brossard, House properties are the most common (57.8%), reflecting the local real estate landscape.
- Houses represent a significant 57.8% portion, catering likely to families or larger groups.
- The presence of 8.3% Hotel/Boutique listings indicates integration with traditional hospitality.
- Smaller segments like others (combined 2.8%) offer potential for unique stay experiences.
Brossard Airbnb Room Capacity Analysis (2025): Bedroom Distribution
Distribution of Listings by Number of Bedrooms
Room Capacity Insights for Brossard
- The dominant room capacity in Brossard is 1 bedroom listings, making up 31.2% of the market. This suggests a strong demand for properties suitable for couples or solo travelers.
- Together, 1 bedroom and 4 bedrooms properties represent 46.8% of the active Airbnb listings in Brossard, indicating a high concentration in these sizes.
- A significant 38.6% of listings offer 3+ bedrooms, catering to larger groups and families seeking more space in Brossard.
Brossard Vacation Rental Guest Capacity Trends (2025)
Distribution of Listings by Guest Capacity
Guest Capacity Insights for Brossard
- The most common guest capacity trend in Brossard vacation rentals is listings accommodating 8+ guests (22.9%). This suggests the primary traveler segment is likely larger groups.
- Properties designed for 8+ guests and 2 guests dominate the Brossard STR market, accounting for 45.8% of listings.
- 40.3% of properties accommodate 6+ guests, serving the market segment for larger families or group travel in Brossard.
- On average, properties in Brossard are equipped to host 4.2 guests.
Brossard Airbnb Booking Patterns (2025): Available vs. Booked Days
Available Days Distribution
Booked Days Distribution
Booking Pattern Insights for Brossard
- The most common availability pattern in Brossard falls within the 271-366 days range, representing 42.2% of listings. This suggests many properties have significant open periods on their calendars.
- Approximately 66.1% of listings show high availability (181+ days open annually), indicating potential for increased bookings or specific owner usage patterns.
- For booked days, the 31-90 days range is most frequent in Brossard (29.4%), reflecting common guest stay durations or potential owner blocking patterns.
- A notable 35.8% of properties secure long booking periods (181+ days booked per year), highlighting successful long-term rental strategies or significant owner usage.
Brossard Airbnb Minimum Stay Requirements Analysis
Distribution of Listings by Minimum Night Requirement
1 Night
27 listings
28.1% of total
2 Nights
17 listings
17.7% of total
3 Nights
3 listings
3.1% of total
4-6 Nights
4 listings
4.2% of total
7-29 Nights
4 listings
4.2% of total
30+ Nights
41 listings
42.7% of total
Key Insights
- The most prevalent minimum stay requirement in Brossard is 30+ Nights, adopted by 42.7% of listings. This highlights the market's preference for longer commitments.
- A significant segment (42.7%) caters to monthly stays (30+ nights) in Brossard, pointing to opportunities in the extended-stay market.
Recommendations
- Align with the market by considering a 30+ Nights minimum stay, as 42.7% of Brossard hosts use this setting.
- If feasible, allowing 1-night stays, especially midweek or during low season, could capture last-minute bookings, as only 28.1% currently do.
- Explore offering discounts for stays of 30+ nights to attract the 42.7% of the market seeking extended stays.
- Adjust minimum nights based on seasonality – potentially shorter during low season and longer during peak demand periods in Brossard.
Brossard Airbnb Cancellation Policy Trends Analysis (2025)
Flexible
16 listings
19.5% of total
Moderate
19 listings
23.2% of total
Firm
18 listings
22% of total
Strict
29 listings
35.4% of total
Cancellation Policy Insights for Brossard
- The prevailing Airbnb cancellation policy trend in Brossard is Strict, used by 35.4% of listings.
- A majority (57.4%) of hosts in Brossard utilize Firm or Strict policies, indicating a market where hosts prioritize booking security.
Recommendations for Hosts
- Consider adopting a Strict policy to align with the 35.4% market standard in Brossard.
- With 35.4% using Strict terms, this is a viable option in Brossard, particularly for high-value properties or during peak demand periods.
- Regularly review your cancellation policy against competitors and market demand shifts in Brossard.
Brossard STR Booking Lead Time Analysis (2025)
Average Booking Lead Time by Month
Booking Lead Time Insights for Brossard
- The overall average booking lead time for vacation rentals in Brossard is 32 days.
- Guests book furthest in advance for stays during June (average 80 days), likely coinciding with peak travel demand or local events.
- The shortest booking windows occur for stays in March (average 20 days), indicating more last-minute travel plans during this time.
- Seasonally, Summer (56 days avg.) sees the longest lead times, while Winter (25 days avg.) has the shortest, reflecting typical travel planning cycles.
Recommendations for Hosts
- Use the overall average lead time (32 days) as a baseline for your pricing and availability strategy in Brossard.
- For June stays, consider implementing length-of-stay discounts or slightly higher rates for bookings made less than 80 days out to capitalize on advance planning.
- Target marketing efforts for the Summer season well in advance (at least 56 days) to capture early planners.
- Monitor your own booking lead times against these Brossard averages to identify opportunities for dynamic pricing adjustments.
Popular & Essential Airbnb Amenities in Brossard (2025)
Amenity Prevalence
Amenity Insights for Brossard
- Essential amenities in Brossard that guests expect include: Wifi, Smoke alarm, Air conditioning. Lacking these (any) could significantly impact bookings.
- Popular amenities like Heating, TV, Hot water are common but not universal. Offering these can provide a competitive edge.
Recommendations for Hosts
- Ensure your listing includes all essential amenities for Brossard: Wifi, Smoke alarm, Air conditioning.
- Prioritize adding missing essentials: Smoke alarm, Air conditioning.
- Consider adding popular differentiators like Heating or TV to increase appeal.
- Highlight unique or less common amenities you offer (e.g., hot tub, dedicated workspace, EV charger) in your listing description and photos.
- Regularly check competitor amenities in Brossard to stay competitive.
Brossard Airbnb Guest Demographics & Profile Analysis (2025)
Guest Profile Summary for Brossard
- The typical guest profile for Airbnb in Brossard consists of a mix of domestic (55%) and international guests, often arriving from nearby Toronto, typically belonging to the Post-2000s (Gen Z/Alpha) group (50%), primarily speaking English or French.
- Domestic travelers account for 55.4% of guests.
- Key international markets include Canada (55.4%) and United States (28.5%).
- Top languages spoken are English (49.4%) followed by French (20.8%).
- A significant demographic segment is the Post-2000s (Gen Z/Alpha) group, representing 50% of guests.
Recommendations for Hosts
- Balance marketing efforts between domestic and international channels based on the guest mix.
- Tailor amenities and listing descriptions to appeal to the dominant Post-2000s (Gen Z/Alpha) demographic (e.g., highlight fast WiFi, smart home features, local guides).
- Highlight unique local experiences or amenities relevant to the primary guest profile.
- Consider seasonal promotions aligned with peak travel times for key origin markets.
Nearby Short-Term Rental Market Comparison
How does the Brossard Airbnb market stack up against its neighbors? Compare key performance metrics like average monthly revenue, ADR, and occupancy rates in surrounding areas to understand the broader regional STR landscape.
| Market | Active Properties | Monthly Revenue | Daily Rate | Avg. Occupancy |
|---|---|---|---|---|
| Mille-Isles | 93 | $5,049 | $415.08 | 41% |
| Malletts Bay | 49 | $4,960 | $414.58 | 48% |
| Stowe | 842 | $4,757 | $474.92 | 41% |
| Wilmington | 130 | $4,484 | $324.06 | 45% |
| Saint-Denis-de-Brompton | 28 | $4,459 | $383.13 | 34% |
| Calais | 16 | $4,320 | $299.79 | 49% |
| Grenville-sur-la-Rouge | 32 | $4,226 | $362.40 | 41% |
| Middlebury | 52 | $4,128 | $288.39 | 54% |
| Waterloo | 11 | $4,092 | $357.06 | 37% |
| Topsham | 13 | $3,952 | $265.51 | 50% |