Morell Airbnb Market Analysis 2025: Short Term Rental Data & Vacation Rental Statistics in Prince Edward Island, Canada
Is Airbnb profitable in Morell in 2025? Explore comprehensive Airbnb analytics for Morell, Prince Edward Island, Canada to uncover income potential. This 2025 STR market report for Morell, based on AirROI data from April 2024 to March 2025, reveals key trends in the niche market of 23 active listings.
Whether you're considering an Airbnb investment in Morell, optimizing your existing vacation rental, or exploring rental arbitrage opportunities, understanding the Morell Airbnb data is crucial. Understanding the local regulations is key to maximizing your short term rental income potential. Let's dive into the specifics.
Key Morell Airbnb Performance Metrics Overview
Monthly Airbnb Revenue Variations & Income Potential in Morell (2025)
Understanding the monthly revenue variations for Airbnb listings in Morell is key to maximizing your short term rental income potential. Seasonality significantly impacts earnings. Our analysis, based on data from the past 12 months, shows that the peak revenue month for STRs in Morell is typically July, while January often presents the lowest earnings, highlighting opportunities for strategic pricing adjustments during shoulder and low seasons. Explore the typical Airbnb income in Morell across different performance tiers:
- Best-in-class properties (Top 10%) achieve $4,707+ monthly, often utilizing dynamic pricing and superior guest experiences.
- Strong performing properties (Top 25%) earn $3,526 or more, indicating effective management and desirable locations/amenities.
- Typical properties (Median) generate around $1,952 per month, representing the average market performance.
- Entry-level properties (Bottom 25%) see earnings around $1,307, often with potential for optimization.
Average Monthly Airbnb Earnings Trend in Morell
Morell Airbnb Occupancy Rate Trends (2025)
Maximize your bookings by understanding the Morell STR occupancy trends. Seasonal demand shifts significantly influence how often properties are booked. Typically, Julysees the highest demand (peak season occupancy), while January experiences the lowest (low season). Effective strategies, like adjusting minimum stays or offering promotions, can boost occupancy during slower periods. Here's how different property tiers perform in Morell:
- Best-in-class properties (Top 10%) achieve 64%+ occupancy, indicating high desirability and potentially optimized availability.
- Strong performing properties (Top 25%) maintain 54% or higher occupancy, suggesting good market fit and guest satisfaction.
- Typical properties (Median) have an occupancy rate around 34%.
- Entry-level properties (Bottom 25%) average 25% occupancy, potentially facing higher vacancy.
Average Monthly Occupancy Rate Trend in Morell
Average Daily Rate (ADR) Airbnb Trends in Morell (2025)
Effective short term rental pricing strategy in Morell involves understanding monthly ADR fluctuations. The Average Daily Rate (ADR) for Airbnb in Morell typically peaks in August and dips lowest during October. Leveraging Airbnb dynamic pricing tools or strategies based on this seasonality can significantly boost revenue. Here's a look at the typical nightly rates achieved:
- Best-in-class properties (Top 10%) command rates of $244+ per night, often due to premium features or locations.
- Strong performing properties (Top 25%) achieve nightly rates of $204 or more.
- Typical properties (Median) charge around $167 per night.
- Entry-level properties (Bottom 25%) earn around $144 per night.
Average Daily Rate (ADR) Trend by Month in Morell
Get Live Morell Market Intelligence 👇

Explore Real-time Analytics
Airbnb Seasonality Analysis & Trends in Morell (2025)
Peak Season (July, August, February)
- Revenue averages $4,154 per month
- Occupancy rates average 58.1%
- Daily rates average $178
Shoulder Season
- Revenue averages $2,365 per month
- Occupancy maintains around 38.2%
- Daily rates hold near $172
Low Season (January, October, November)
- Revenue drops to average $967 per month
- Occupancy decreases to average 19.6%
- Daily rates adjust to average $170
Seasonality Insights for Morell
- The Airbnb seasonality in Morell shows highly seasonal trends requiring careful strategy. While the sections above show seasonal averages, it's also insightful to look at the extremes:
- During the high season, the absolute peak month showcases Morell's highest earning potential, with monthly revenues capable of climbing to $4,771, occupancy reaching a high of 72.8%, and ADRs peaking at $183.
- Conversely, the slowest single month of the year, typically falling within the low season, marks the market's lowest point. In this month, revenue might dip to $492, occupancy could drop to 8.6%, and ADRs may adjust down to $168.
- Understanding both the seasonal averages and these monthly peaks and troughs in revenue, occupancy, and ADR is crucial for maximizing your Airbnb profit potential in Morell.
Seasonal Strategies for Maximizing Profit
- Peak Season: Maximize revenue through premium pricing and potentially longer minimum stays. Ensure high availability.
- Low Season: Offer competitive pricing, special promotions (e.g., extended stay discounts), and flexible cancellation policies. Target off-season travelers like remote workers or budget-conscious guests.
- Shoulder Seasons: Implement dynamic pricing that balances peak and low rates. Target weekend travelers or specific events. Offer slightly more flexible terms than peak season.
- Regularly analyze your own performance against these Morell seasonality benchmarks and adjust your pricing and availability strategy accordingly.
Best Areas for Airbnb Investment in Morell (2025)
Exploring the top neighborhoods for short-term rentals in Morell? This section highlights key areas, outlining why they are attractive for hosts and guests, along with notable local attractions. Consider these locations based on your target guest profile and investment strategy.
| Neighborhood / Area | Why Host Here? (Target Guests & Appeal) | Key Attractions & Landmarks |
|---|---|---|
| Morell River | Scenic riverside location perfect for families and nature lovers. Great for fishing, canoeing, and hiking, attracting tourists looking for outdoor activities. | Morell River Trails, Dunbar Park, Lakeside Camping, Morell Heritage Centre, Fishing on Morell River |
| Brackley Beach | Beautiful sandy beach area attracting tourists during the summer months. Ideal for beach vacations and water sports enthusiasts. | Brackley Beach, National Park, Beachfront Activities, Sand Dunes Trail, Local Seafood Restaurants |
| Charlottetown | The capital city of Prince Edward Island, known for its historic sites and cultural experiences. A hub for tourists exploring the island. | Confederation Centre of the Arts, Victoria Row, Historic Charlottetown, Province House, PEI National Park |
| North Rustico | Famous for its harbors and seafood dining, North Rustico is a charming coastal village that attracts culinary and outdoor tourists. | North Rustico Harbour, Seafood Restaurants, National Park Beaches, Boardwalks, Fishing Tours |
| Cavendish | Tourist hotspot for its sandy beaches and proximity to Green Gables house. Attracts families and vacationers during the summer. | Cavendish Beach, Green Gables House, Shining Waters Family Fun Park, Playland, Cavendish Boardwalk |
| Stanley Bridge | Peaceful village near the water, popular for its scenic views and proximity to attractions, ideal for quiet retreats. | Stanley Bridge Wharf, Local Art Galleries, Boat Tours, Kayaking, Cycling Trails |
| Souris | A quaint coastal town known for its friendly atmosphere and access to beautiful beaches and nature trails, attracting tourists seeking tranquility. | Souris Beach, Covehead Harbour, Local Shops, Nature Trails, Lighthouses |
| Kingsboro | A peaceful area known for its lovely views and friendly community, attracting visitors who want to escape the hustle and bustle. | Kingsboro Beach, Fishing Lakes, Biking Trails, Scenic Parks, Community Events |
Understanding Airbnb License Requirements & STR Laws in Morell (2025)
With 17% of listings showing registration in 2025, understanding potential Airbnb license requirements is crucial in Morell. Always verify the latest short term rental regulations and Airbnb license requirements directly with local government authorities for Morell to ensure full compliance before hosting.
(Source: AirROI data, 2025, based on 17% licensed listings)
Top Performing Airbnb Properties in Morell (2025)
Benchmark your potential! Explore examples of top-performing Airbnb properties in Morellbased on Trailing Twelve Month (TTM) revenue. Analyze their characteristics, revenue, occupancy rate, and ADR to understand what drives success in this market.
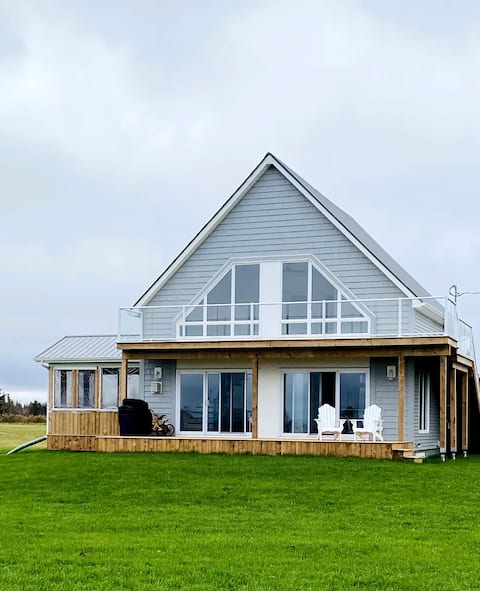
Year-round retreat at D&D Cottage
Entire Place • 3 bedrooms

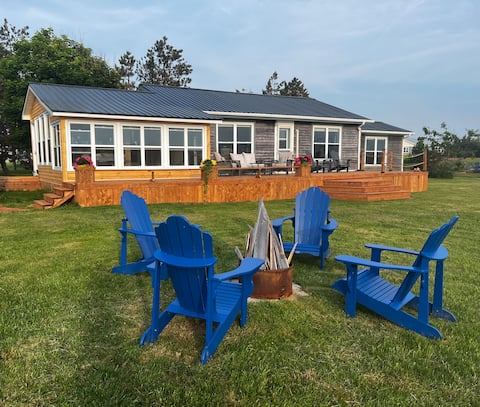
Crowbush Golf House
Entire Place • 6 bedrooms
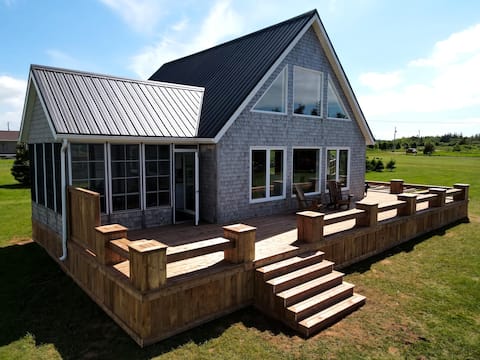
Ocean Front Cottage steps from 8km of beach !
Entire Place • 3 bedrooms
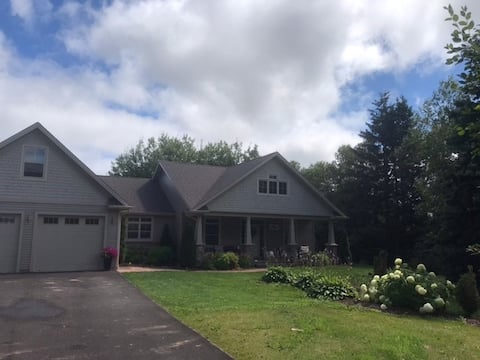
5 acres w/swim spa, near river, beaches, amenities
Entire Place • 4 bedrooms
Ocean front, beach house retreat!
Entire Place • 3 bedrooms
The Fox & The Crow: Beach Cottage - 2 BR + Bunkie
Entire Place • 3 bedrooms
Note: Performance varies based on location, size, amenities, seasonality, and management quality. Data reflects the past 12 months.
Top Performing Airbnb Hosts in Morell (2025)
Learn from the best! This table showcases top-performing Airbnb hosts in Morell based on the number of properties managed and estimated total revenue over the past year. Analyze their scale and performance metrics.
| Host Name | Properties | Grossing Revenue | Stay Reviews | Avg Rating |
|---|---|---|---|---|
| Monica | 1 | $44,698 | 16 | 5.00/5.0 |
| David | 1 | $33,306 | 37 | 4.89/5.0 |
| Susan | 1 | $27,180 | 52 | 4.98/5.0 |
| Tracey | 1 | $24,934 | 35 | 4.80/5.0 |
| Cara And Jeff | 1 | $24,736 | 36 | 4.92/5.0 |
| Scott | 2 | $23,973 | 3 | 2.33/5.0 |
| Lori | 1 | $23,215 | 15 | 5.00/5.0 |
| Roberta | 1 | $21,844 | 78 | 4.82/5.0 |
| Sheila | 1 | $21,594 | 7 | 5.00/5.0 |
| Melissa | 1 | $20,952 | 41 | 4.98/5.0 |
Analyzing the strategies of top hosts, such as their property selection, pricing, and guest communication, can offer valuable lessons for optimizing your own Airbnb operations in Morell.
Dive Deeper: Advanced Morell STR Market Data (2025)
Ready to unlock more insights? AirROI provides access to advanced metrics and comprehensive Airbnb data for Morell. Explore detailed analytics beyond this report to refine your investment strategy, optimize pricing, and maximize your vacation rental profits.
Explore Advanced MetricsMorell Short-Term Rental Market Composition (2025): Property & Room Types
Room Type Distribution
Property Type Distribution
Market Composition Insights for Morell
- The Morell Airbnb market composition is heavily skewed towards Entire Home/Apt listings, which make up 95.7% of the 23 active rentals. This indicates strong guest preference for privacy and space.
- Looking at the property type distribution in Morell, House properties are the most common (91.3%), reflecting the local real estate landscape.
- Houses represent a significant 91.3% portion, catering likely to families or larger groups.
Morell Airbnb Room Capacity Analysis (2025): Bedroom Distribution
Distribution of Listings by Number of Bedrooms
Room Capacity Insights for Morell
- The dominant room capacity in Morell is 3 bedrooms listings, making up 52.2% of the market. This suggests a strong demand for properties suitable for families or small groups.
- Together, 3 bedrooms and 2 bedrooms properties represent 73.9% of the active Airbnb listings in Morell, indicating a high concentration in these sizes.
- A significant 69.5% of listings offer 3+ bedrooms, catering to larger groups and families seeking more space in Morell.
Morell Vacation Rental Guest Capacity Trends (2025)
Distribution of Listings by Guest Capacity
Guest Capacity Insights for Morell
- The most common guest capacity trend in Morell vacation rentals is listings accommodating 6 guests (47.8%). This suggests the primary traveler segment is likely larger groups.
- Properties designed for 6 guests and 8+ guests dominate the Morell STR market, accounting for 69.5% of listings.
- 69.5% of properties accommodate 6+ guests, serving the market segment for larger families or group travel in Morell.
- On average, properties in Morell are equipped to host 5.6 guests.
Morell Airbnb Booking Patterns (2025): Available vs. Booked Days
Available Days Distribution
Booked Days Distribution
Booking Pattern Insights for Morell
- The most common availability pattern in Morell falls within the 271-366 days range, representing 60.9% of listings. This suggests many properties have significant open periods on their calendars.
- Approximately 100.0% of listings show high availability (181+ days open annually), indicating potential for increased bookings or specific owner usage patterns.
- For booked days, the 31-90 days range is most frequent in Morell (52.2%), reflecting common guest stay durations or potential owner blocking patterns.
Morell Airbnb Minimum Stay Requirements Analysis
Distribution of Listings by Minimum Night Requirement
1 Night
1 listings
4.5% of total
2 Nights
3 listings
13.6% of total
3 Nights
2 listings
9.1% of total
4-6 Nights
11 listings
50% of total
7-29 Nights
4 listings
18.2% of total
30+ Nights
1 listings
4.5% of total
Key Insights
- The most prevalent minimum stay requirement in Morell is 4-6 Nights, adopted by 50% of listings. This highlights the market's preference for longer commitments.
- Very short stays (1-2 nights) are less common (18.1%), suggesting hosts prefer slightly longer bookings to optimize turnover.
Recommendations
- Align with the market by considering a 4-6 Nights minimum stay, as 50% of Morell hosts use this setting.
- If feasible, allowing 1-night stays, especially midweek or during low season, could capture last-minute bookings, as only 4.5% currently do.
- Adjust minimum nights based on seasonality – potentially shorter during low season and longer during peak demand periods in Morell.
Morell Airbnb Cancellation Policy Trends Analysis (2025)
Flexible
2 listings
10% of total
Moderate
2 listings
10% of total
Firm
8 listings
40% of total
Strict
8 listings
40% of total
Cancellation Policy Insights for Morell
- The prevailing Airbnb cancellation policy trend in Morell is Firm, used by 40% of listings.
- A majority (80.0%) of hosts in Morell utilize Firm or Strict policies, indicating a market where hosts prioritize booking security.
Recommendations for Hosts
- Consider adopting a Firm policy to align with the 40% market standard in Morell.
- With 40% using Strict terms, this is a viable option in Morell, particularly for high-value properties or during peak demand periods.
- Regularly review your cancellation policy against competitors and market demand shifts in Morell.
Morell STR Booking Lead Time Analysis (2025)
Average Booking Lead Time by Month
Booking Lead Time Insights for Morell
- The overall average booking lead time for vacation rentals in Morell is 91 days.
- Guests book furthest in advance for stays during July (average 181 days), likely coinciding with peak travel demand or local events.
- The shortest booking windows occur for stays in February (average 14 days), indicating more last-minute travel plans during this time.
- Seasonally, Summer (145 days avg.) sees the longest lead times, while Winter (47 days avg.) has the shortest, reflecting typical travel planning cycles.
Recommendations for Hosts
- Use the overall average lead time (91 days) as a baseline for your pricing and availability strategy in Morell.
- For July stays, consider implementing length-of-stay discounts or slightly higher rates for bookings made less than 181 days out to capitalize on advance planning.
- During February, focus on last-minute booking availability and promotions, as guests book with very short notice (14 days avg.).
- Target marketing efforts for the Summer season well in advance (at least 145 days) to capture early planners.
- Monitor your own booking lead times against these Morell averages to identify opportunities for dynamic pricing adjustments.
Popular & Essential Airbnb Amenities in Morell (2025)
Amenity Prevalence
Amenity Insights for Morell
- Essential amenities in Morell that guests expect include: Fire extinguisher, Free parking on premises, Heating, Smoke alarm, Kitchen, Coffee maker, Hangers, Refrigerator, Essentials, Dishes and silverware. Lacking these (any) could significantly impact bookings.
Recommendations for Hosts
- Ensure your listing includes all essential amenities for Morell: Fire extinguisher, Free parking on premises, Heating, Smoke alarm, Kitchen, Coffee maker, Hangers, Refrigerator, Essentials, Dishes and silverware.
- Prioritize adding missing essentials: Coffee maker, Hangers, Refrigerator, Essentials, Dishes and silverware.
- Highlight unique or less common amenities you offer (e.g., hot tub, dedicated workspace, EV charger) in your listing description and photos.
- Regularly check competitor amenities in Morell to stay competitive.
Morell Airbnb Guest Demographics & Profile Analysis (2025)
Guest Profile Summary for Morell
- The typical guest profile for Airbnb in Morell consists of primarily domestic travelers (75%), often arriving from nearby Ottawa, typically belonging to the Post-2000s (Gen Z/Alpha) group (50%), primarily speaking English or French.
- Domestic travelers account for 75.4% of guests.
- Key international markets include Canada (75.4%) and United States (21.5%).
- Top languages spoken are English (67.1%) followed by French (20.7%).
- A significant demographic segment is the Post-2000s (Gen Z/Alpha) group, representing 50% of guests.
Recommendations for Hosts
- Target domestic marketing efforts towards travelers from Ottawa and Toronto.
- Tailor amenities and listing descriptions to appeal to the dominant Post-2000s (Gen Z/Alpha) demographic (e.g., highlight fast WiFi, smart home features, local guides).
- Highlight unique local experiences or amenities relevant to the primary guest profile.
- Consider seasonal promotions aligned with peak travel times for key origin markets.
Nearby Short-Term Rental Market Comparison
How does the Morell Airbnb market stack up against its neighbors? Compare key performance metrics like average monthly revenue, ADR, and occupancy rates in surrounding areas to understand the broader regional STR landscape.
| Market | Active Properties | Monthly Revenue | Daily Rate | Avg. Occupancy |
|---|---|---|---|---|
| Margaree Harbour | 17 | $4,129 | $431.20 | 49% |
| Wentworth | 23 | $2,556 | $225.30 | 44% |
| Inverness | 46 | $2,527 | $259.70 | 48% |
| Long River | 17 | $2,500 | $236.42 | 52% |
| Granville | 10 | $2,491 | $276.93 | 56% |
| Grand Étang | 10 | $2,491 | $223.98 | 57% |
| Rustico | 27 | $2,307 | $241.08 | 49% |
| Point Cross | 34 | $2,270 | $188.48 | 53% |
| Oyster Bed Bridge | 10 | $2,066 | $184.77 | 65% |
| Souris West | 10 | $2,057 | $201.76 | 50% |