Malpeque Airbnb Market Analysis 2025: Short Term Rental Data & Vacation Rental Statistics in Prince Edward Island, Canada
Is Airbnb profitable in Malpeque in 2025? Explore comprehensive Airbnb analytics for Malpeque, Prince Edward Island, Canada to uncover income potential. This 2025 STR market report for Malpeque, based on AirROI data from April 2024 to March 2025, reveals key trends in the niche market of 17 active listings.
Whether you're considering an Airbnb investment in Malpeque, optimizing your existing vacation rental, or exploring rental arbitrage opportunities, understanding the Malpeque Airbnb data is crucial. Leveraging the low regulation environment is key to maximizing your short term rental income potential. Let's dive into the specifics.
Key Malpeque Airbnb Performance Metrics Overview
Monthly Airbnb Revenue Variations & Income Potential in Malpeque (2025)
Understanding the monthly revenue variations for Airbnb listings in Malpeque is key to maximizing your short term rental income potential. Seasonality significantly impacts earnings. Our analysis, based on data from the past 12 months, shows that the peak revenue month for STRs in Malpeque is typically July, while January often presents the lowest earnings, highlighting opportunities for strategic pricing adjustments during shoulder and low seasons. Explore the typical Airbnb income in Malpeque across different performance tiers:
- Best-in-class properties (Top 10%) achieve $5,219+ monthly, often utilizing dynamic pricing and superior guest experiences.
- Strong performing properties (Top 25%) earn $4,039 or more, indicating effective management and desirable locations/amenities.
- Typical properties (Median) generate around $1,954 per month, representing the average market performance.
- Entry-level properties (Bottom 25%) see earnings around $1,058, often with potential for optimization.
Average Monthly Airbnb Earnings Trend in Malpeque
Malpeque Airbnb Occupancy Rate Trends (2025)
Maximize your bookings by understanding the Malpeque STR occupancy trends. Seasonal demand shifts significantly influence how often properties are booked. Typically, Julysees the highest demand (peak season occupancy), while January experiences the lowest (low season). Effective strategies, like adjusting minimum stays or offering promotions, can boost occupancy during slower periods. Here's how different property tiers perform in Malpeque:
- Best-in-class properties (Top 10%) achieve 64%+ occupancy, indicating high desirability and potentially optimized availability.
- Strong performing properties (Top 25%) maintain 52% or higher occupancy, suggesting good market fit and guest satisfaction.
- Typical properties (Median) have an occupancy rate around 34%.
- Entry-level properties (Bottom 25%) average 24% occupancy, potentially facing higher vacancy.
Average Monthly Occupancy Rate Trend in Malpeque
Average Daily Rate (ADR) Airbnb Trends in Malpeque (2025)
Effective short term rental pricing strategy in Malpeque involves understanding monthly ADR fluctuations. The Average Daily Rate (ADR) for Airbnb in Malpeque typically peaks in July and dips lowest during March. Leveraging Airbnb dynamic pricing tools or strategies based on this seasonality can significantly boost revenue. Here's a look at the typical nightly rates achieved:
- Best-in-class properties (Top 10%) command rates of $377+ per night, often due to premium features or locations.
- Strong performing properties (Top 25%) achieve nightly rates of $249 or more.
- Typical properties (Median) charge around $207 per night.
- Entry-level properties (Bottom 25%) earn around $109 per night.
Average Daily Rate (ADR) Trend by Month in Malpeque
Get Live Malpeque Market Intelligence 👇

Explore Real-time Analytics
Airbnb Seasonality Analysis & Trends in Malpeque (2025)
Peak Season (July, August, April)
- Revenue averages $4,615 per month
- Occupancy rates average 59.9%
- Daily rates average $228
Shoulder Season
- Revenue averages $2,256 per month
- Occupancy maintains around 35.4%
- Daily rates hold near $209
Low Season (January, March, November)
- Revenue drops to average $1,442 per month
- Occupancy decreases to average 22.1%
- Daily rates adjust to average $195
Seasonality Insights for Malpeque
- The Airbnb seasonality in Malpeque shows highly seasonal trends requiring careful strategy. While the sections above show seasonal averages, it's also insightful to look at the extremes:
- During the high season, the absolute peak month showcases Malpeque's highest earning potential, with monthly revenues capable of climbing to $4,984, occupancy reaching a high of 64.1%, and ADRs peaking at $238.
- Conversely, the slowest single month of the year, typically falling within the low season, marks the market's lowest point. In this month, revenue might dip to $1,245, occupancy could drop to 17.8%, and ADRs may adjust down to $193.
- Understanding both the seasonal averages and these monthly peaks and troughs in revenue, occupancy, and ADR is crucial for maximizing your Airbnb profit potential in Malpeque.
Seasonal Strategies for Maximizing Profit
- Peak Season: Maximize revenue through premium pricing and potentially longer minimum stays. Ensure high availability.
- Low Season: Offer competitive pricing, special promotions (e.g., extended stay discounts), and flexible cancellation policies. Target off-season travelers like remote workers or budget-conscious guests.
- Shoulder Seasons: Implement dynamic pricing that balances peak and low rates. Target weekend travelers or specific events. Offer slightly more flexible terms than peak season.
- Regularly analyze your own performance against these Malpeque seasonality benchmarks and adjust your pricing and availability strategy accordingly.
Best Areas for Airbnb Investment in Malpeque (2025)
Exploring the top neighborhoods for short-term rentals in Malpeque? This section highlights key areas, outlining why they are attractive for hosts and guests, along with notable local attractions. Consider these locations based on your target guest profile and investment strategy.
| Neighborhood / Area | Why Host Here? (Target Guests & Appeal) | Key Attractions & Landmarks |
|---|---|---|
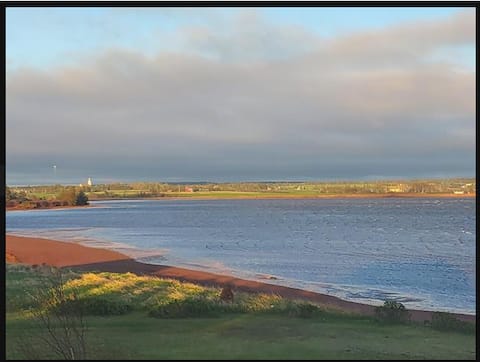
| Malpeque Bay | Known for its stunning beaches and scenic views, Malpeque Bay attracts tourists looking for a peaceful getaway. Ideal for families and nature lovers who enjoy water activities and outdoor adventures. | Malpeque Bay Beach, Malpeque Harbour, Malpeque Bay Sailing, Sea Kayaking, Fishing Tours |
| North Rustico | A charming fishing village with a picturesque coastline, North Rustico is popular with tourists seeking fresh seafood and coastal experiences. Great for those interested in local culture and marine activities. | North Rustico Harbour, Fisherman's Wharf, Lobster Suppers, North Rustico Beach, Shining Waters Family Fun Park |
| Bideford | A quaint village known for its agricultural landscape and close-knit community. Offers visitors a glimpse of rural PEI life while being a short drive from beach access and local attractions. | Bideford Parsonage Museum, Bideford River, Small local farms, Cultural festivals, Nature Trails |
| Summerside | One of the largest cities in PEI, Summerside offers a variety of amenities and attractions, making it a great spot for visitors looking for urban conveniences along with coastal experiences. | Harbourfront Jubilee Theatre, Summerside Waterfront, Credit Union Place, Eptek Art and Culture Centre, Spinnaker's Landing |
| Cavendish | Famous for its beaches and proximity to Green Gables attractions, Cavendish is a top destination for families and literary enthusiasts, making it a lucrative spot for accommodations. | Cavendish Beach, Green Gables House, Avonlea Village, Cavendish National Park, Sandspit Amusement Park |
| Charlottetown | As the capital city of PEI, Charlottetown is a vibrant cultural hub with many events, festivals, and historical sites. Ideal for tourists interested in history and local cuisine. | Confederation Centre of the Arts, Victoria Row, PEI National Park, Charlotte Town Historic District, St. Dunstan's Basilica |
| Brackley Beach | Renowned for its long stretches of sandy beach and proximity to the stunning national park, Brackley Beach is perfect for visitors seeking relaxation and natural beauty. | Brackley Beach National Park, Wind and Sea Adventures, Brackley Drive-In Theatre, Nature Trails, Birdwatching |
| New London | A serene area with scenic vistas and rich history, New London appeals to visitors interested in local heritage and outdoor activities, especially cycling and hiking. | New London Lighthouses, Local heritage sites, Cycling routes, Green space parks, Birdwatching spots |
Understanding Airbnb License Requirements & STR Laws in Malpeque (2025)
While Malpeque, Prince Edward Island, Canada currently shows low STR regulations, specific Airbnb license requirements might still exist or change. Always verify the latest short term rental regulations and Airbnb license requirements directly with local government authorities for Malpeque to ensure full compliance before hosting.
(Source: AirROI data, 2025, based on 6% licensed listings)
Top Performing Airbnb Properties in Malpeque (2025)
Benchmark your potential! Explore examples of top-performing Airbnb properties in Malpequebased on Trailing Twelve Month (TTM) revenue. Analyze their characteristics, revenue, occupancy rate, and ADR to understand what drives success in this market.
Beachfront Osprey Nest in Malpeque Bay, PEI
Entire Place • 3 bedrooms

Stunning Oceanfront PEI Cottage
Entire Place • 3 bedrooms
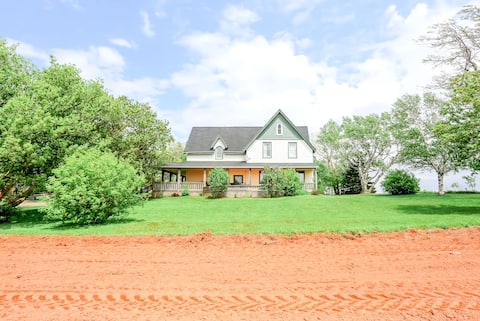
Island Farmhouse
Entire Place • 5 bedrooms
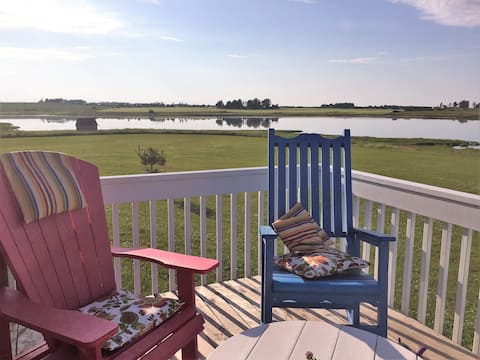
A Seaside Island Escape in Malpeque
Entire Place • 3 bedrooms

Foxcliff Cottage
Entire Place • 3 bedrooms
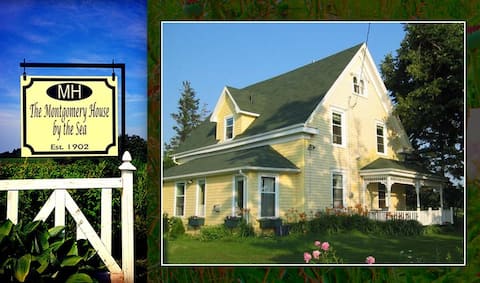
Montgomery House by the Sea/Carriage House
Entire Place • 7 bedrooms
Note: Performance varies based on location, size, amenities, seasonality, and management quality. Data reflects the past 12 months.
Top Performing Airbnb Hosts in Malpeque (2025)
Learn from the best! This table showcases top-performing Airbnb hosts in Malpeque based on the number of properties managed and estimated total revenue over the past year. Analyze their scale and performance metrics.
| Host Name | Properties | Grossing Revenue | Stay Reviews | Avg Rating |
|---|---|---|---|---|
| Charlene | 2 | $59,752 | 26 | 2.48/5.0 |
| Jenna | 1 | $42,614 | 123 | 4.92/5.0 |
| SeaShell | 6 | $41,050 | 196 | 4.49/5.0 |
| Andre | 1 | $34,414 | 48 | 4.83/5.0 |
| Christine | 1 | $28,604 | 35 | 4.80/5.0 |
| Foxcliff | 1 | $26,642 | 45 | 5.00/5.0 |
| George | 1 | $19,823 | 8 | 4.88/5.0 |
| Michael | 1 | $17,263 | 8 | 5.00/5.0 |
| Joe | 1 | $16,228 | 52 | 4.85/5.0 |
| Carrie | 1 | $14,349 | 23 | 4.96/5.0 |
Analyzing the strategies of top hosts, such as their property selection, pricing, and guest communication, can offer valuable lessons for optimizing your own Airbnb operations in Malpeque.
Dive Deeper: Advanced Malpeque STR Market Data (2025)
Ready to unlock more insights? AirROI provides access to advanced metrics and comprehensive Airbnb data for Malpeque. Explore detailed analytics beyond this report to refine your investment strategy, optimize pricing, and maximize your vacation rental profits.
Explore Advanced MetricsMalpeque Short-Term Rental Market Composition (2025): Property & Room Types
Room Type Distribution
Property Type Distribution
Market Composition Insights for Malpeque
- The Malpeque Airbnb market composition is heavily skewed towards Entire Home/Apt listings, which make up 64.7% of the 17 active rentals. This indicates strong guest preference for privacy and space.
- However, a notable 35.3% share for Private Rooms suggests opportunities for budget-conscious travelers or hosts renting out spare rooms.
- Looking at the property type distribution in Malpeque, House properties are the most common (52.9%), reflecting the local real estate landscape.
- Houses represent a significant 52.9% portion, catering likely to families or larger groups.
- The presence of 35.3% Hotel/Boutique listings indicates integration with traditional hospitality.
Malpeque Airbnb Room Capacity Analysis (2025): Bedroom Distribution
Distribution of Listings by Number of Bedrooms
Room Capacity Insights for Malpeque
- The dominant room capacity in Malpeque is 3 bedrooms listings, making up 47.1% of the market. This suggests a strong demand for properties suitable for families or small groups.
- Together, 3 bedrooms and 2 bedrooms properties represent 76.5% of the active Airbnb listings in Malpeque, indicating a high concentration in these sizes.
- A significant 58.9% of listings offer 3+ bedrooms, catering to larger groups and families seeking more space in Malpeque.
Malpeque Vacation Rental Guest Capacity Trends (2025)
Distribution of Listings by Guest Capacity
Guest Capacity Insights for Malpeque
- The most common guest capacity trend in Malpeque vacation rentals is listings accommodating 6 guests (29.4%). This suggests the primary traveler segment is likely larger groups.
- Properties designed for 6 guests and 8+ guests dominate the Malpeque STR market, accounting for 52.9% of listings.
- 64.7% of properties accommodate 6+ guests, serving the market segment for larger families or group travel in Malpeque.
- On average, properties in Malpeque are equipped to host 5.6 guests.
Malpeque Airbnb Booking Patterns (2025): Available vs. Booked Days
Available Days Distribution
Booked Days Distribution
Booking Pattern Insights for Malpeque
- The most common availability pattern in Malpeque falls within the 271-366 days range, representing 64.7% of listings. This suggests many properties have significant open periods on their calendars.
- Approximately 100.0% of listings show high availability (181+ days open annually), indicating potential for increased bookings or specific owner usage patterns.
- For booked days, the 31-90 days range is most frequent in Malpeque (58.8%), reflecting common guest stay durations or potential owner blocking patterns.
- A notable 5.9% of properties secure long booking periods (181+ days booked per year), highlighting successful long-term rental strategies or significant owner usage.
Malpeque Airbnb Minimum Stay Requirements Analysis
Distribution of Listings by Minimum Night Requirement
1 Night
5 listings
29.4% of total
2 Nights
2 listings
11.8% of total
3 Nights
5 listings
29.4% of total
4-6 Nights
4 listings
23.5% of total
7-29 Nights
1 listings
5.9% of total
Key Insights
- The most prevalent minimum stay requirement in Malpeque is 1 Night, adopted by 29.4% of listings. This highlights the market's preference for shorter, flexible bookings.
Recommendations
- Align with the market by considering a 1 Night minimum stay, as 29.4% of Malpeque hosts use this setting.
- If feasible, allowing 1-night stays, especially midweek or during low season, could capture last-minute bookings, as only 29.4% currently do.
- Adjust minimum nights based on seasonality – potentially shorter during low season and longer during peak demand periods in Malpeque.
Malpeque Airbnb Cancellation Policy Trends Analysis (2025)
Moderate
4 listings
25% of total
Firm
8 listings
50% of total
Strict
4 listings
25% of total
Cancellation Policy Insights for Malpeque
- The prevailing Airbnb cancellation policy trend in Malpeque is Firm, used by 50% of listings.
- A majority (75.0%) of hosts in Malpeque utilize Firm or Strict policies, indicating a market where hosts prioritize booking security.
Recommendations for Hosts
- Consider adopting a Firm policy to align with the 50% market standard in Malpeque.
- Regularly review your cancellation policy against competitors and market demand shifts in Malpeque.
Malpeque STR Booking Lead Time Analysis (2025)
Average Booking Lead Time by Month
Booking Lead Time Insights for Malpeque
- The overall average booking lead time for vacation rentals in Malpeque is 116 days.
- Guests book furthest in advance for stays during April (average 192 days), likely coinciding with peak travel demand or local events.
- The shortest booking windows occur for stays in February (average 9 days), indicating more last-minute travel plans during this time.
- Seasonally, Spring (158 days avg.) sees the longest lead times, while Winter (27 days avg.) has the shortest, reflecting typical travel planning cycles.
Recommendations for Hosts
- Use the overall average lead time (116 days) as a baseline for your pricing and availability strategy in Malpeque.
- For April stays, consider implementing length-of-stay discounts or slightly higher rates for bookings made less than 192 days out to capitalize on advance planning.
- During February, focus on last-minute booking availability and promotions, as guests book with very short notice (9 days avg.).
- Target marketing efforts for the Spring season well in advance (at least 158 days) to capture early planners.
- Monitor your own booking lead times against these Malpeque averages to identify opportunities for dynamic pricing adjustments.
Popular & Essential Airbnb Amenities in Malpeque (2025)
Amenity Prevalence
No amenities with partial availability (less than 100%) were found to display in the chart. All essential amenities might be present in all listings. Check insights below.
Amenity Insights for Malpeque
- Essential amenities in Malpeque that guests expect include: Heating, Essentials, Backyard, Hot water, Washer, Coffee maker, Refrigerator, Microwave, Bed linens, Smoke alarm. Lacking these (any) could significantly impact bookings.
Recommendations for Hosts
- Ensure your listing includes all essential amenities for Malpeque: Heating, Essentials, Backyard, Hot water, Washer, Coffee maker, Refrigerator, Microwave, Bed linens, Smoke alarm.
- Highlight unique or less common amenities you offer (e.g., hot tub, dedicated workspace, EV charger) in your listing description and photos.
- Regularly check competitor amenities in Malpeque to stay competitive.
Malpeque Airbnb Guest Demographics & Profile Analysis (2025)
Guest Profile Summary for Malpeque
- The typical guest profile for Airbnb in Malpeque consists of primarily domestic travelers (72%), often arriving from nearby Halifax, typically belonging to the Post-2000s (Gen Z/Alpha) group (50%), primarily speaking English or French.
- Domestic travelers account for 72.0% of guests.
- Key international markets include Canada (72%) and United States (22.4%).
- Top languages spoken are English (68%) followed by French (24%).
- A significant demographic segment is the Post-2000s (Gen Z/Alpha) group, representing 50% of guests.
Recommendations for Hosts
- Target domestic marketing efforts towards travelers from Halifax and Ottawa.
- Tailor amenities and listing descriptions to appeal to the dominant Post-2000s (Gen Z/Alpha) demographic (e.g., highlight fast WiFi, smart home features, local guides).
- Highlight unique local experiences or amenities relevant to the primary guest profile.
- Consider seasonal promotions aligned with peak travel times for key origin markets.
Nearby Short-Term Rental Market Comparison
How does the Malpeque Airbnb market stack up against its neighbors? Compare key performance metrics like average monthly revenue, ADR, and occupancy rates in surrounding areas to understand the broader regional STR landscape.
| Market | Active Properties | Monthly Revenue | Daily Rate | Avg. Occupancy |
|---|---|---|---|---|
| Wentworth | 23 | $2,556 | $225.30 | 44% |
| Long River | 17 | $2,500 | $236.42 | 52% |
| Granville | 10 | $2,491 | $276.93 | 56% |
| Port Williams | 16 | $2,478 | $245.95 | 52% |
| Rustico | 27 | $2,307 | $241.08 | 49% |
| Halls Harbour | 16 | $2,240 | $195.39 | 52% |
| Mill River East | 10 | $2,178 | $158.92 | 53% |
| Grand Pre | 10 | $2,112 | $267.30 | 45% |
| Oyster Bed Bridge | 10 | $2,066 | $184.77 | 65% |
| Souris West | 10 | $2,057 | $201.76 | 50% |