Long River Airbnb Market Analysis 2025: Short Term Rental Data & Vacation Rental Statistics in Prince Edward Island, Canada
Is Airbnb profitable in Long River in 2025? Explore comprehensive Airbnb analytics for Long River, Prince Edward Island, Canada to uncover income potential. This 2025 STR market report for Long River, based on AirROI data from April 2024 to March 2025, reveals key trends in the niche market of 17 active listings.
Whether you're considering an Airbnb investment in Long River, optimizing your existing vacation rental, or exploring rental arbitrage opportunities, understanding the Long River Airbnb data is crucial. Navigating the high regulation landscape is key to maximizing your short term rental income potential. Let's dive into the specifics.
Key Long River Airbnb Performance Metrics Overview
Monthly Airbnb Revenue Variations & Income Potential in Long River (2025)
Understanding the monthly revenue variations for Airbnb listings in Long River is key to maximizing your short term rental income potential. Seasonality significantly impacts earnings. Our analysis, based on data from the past 12 months, shows that the peak revenue month for STRs in Long River is typically August, while February often presents the lowest earnings, highlighting opportunities for strategic pricing adjustments during shoulder and low seasons. Explore the typical Airbnb income in Long River across different performance tiers:
- Best-in-class properties (Top 10%) achieve $6,636+ monthly, often utilizing dynamic pricing and superior guest experiences.
- Strong performing properties (Top 25%) earn $4,742 or more, indicating effective management and desirable locations/amenities.
- Typical properties (Median) generate around $3,188 per month, representing the average market performance.
- Entry-level properties (Bottom 25%) see earnings around $2,120, often with potential for optimization.
Average Monthly Airbnb Earnings Trend in Long River
Long River Airbnb Occupancy Rate Trends (2025)
Maximize your bookings by understanding the Long River STR occupancy trends. Seasonal demand shifts significantly influence how often properties are booked. Typically, Augustsees the highest demand (peak season occupancy), while March experiences the lowest (low season). Effective strategies, like adjusting minimum stays or offering promotions, can boost occupancy during slower periods. Here's how different property tiers perform in Long River:
- Best-in-class properties (Top 10%) achieve 77%+ occupancy, indicating high desirability and potentially optimized availability.
- Strong performing properties (Top 25%) maintain 66% or higher occupancy, suggesting good market fit and guest satisfaction.
- Typical properties (Median) have an occupancy rate around 51%.
- Entry-level properties (Bottom 25%) average 35% occupancy, potentially facing higher vacancy.
Average Monthly Occupancy Rate Trend in Long River
Average Daily Rate (ADR) Airbnb Trends in Long River (2025)
Effective short term rental pricing strategy in Long River involves understanding monthly ADR fluctuations. The Average Daily Rate (ADR) for Airbnb in Long River typically peaks in July and dips lowest during December. Leveraging Airbnb dynamic pricing tools or strategies based on this seasonality can significantly boost revenue. Here's a look at the typical nightly rates achieved:
- Best-in-class properties (Top 10%) command rates of $373+ per night, often due to premium features or locations.
- Strong performing properties (Top 25%) achieve nightly rates of $276 or more.
- Typical properties (Median) charge around $225 per night.
- Entry-level properties (Bottom 25%) earn around $137 per night.
Average Daily Rate (ADR) Trend by Month in Long River
Get Live Long River Market Intelligence 👇

Explore Real-time Analytics
Airbnb Seasonality Analysis & Trends in Long River (2025)
Peak Season (August, June, July)
- Revenue averages $5,949 per month
- Occupancy rates average 72.3%
- Daily rates average $247
Shoulder Season
- Revenue averages $3,526 per month
- Occupancy maintains around 49.3%
- Daily rates hold near $231
Low Season (February, March, October)
- Revenue drops to average $1,978 per month
- Occupancy decreases to average 33.3%
- Daily rates adjust to average $227
Seasonality Insights for Long River
- The Airbnb seasonality in Long River shows highly seasonal trends requiring careful strategy. While the sections above show seasonal averages, it's also insightful to look at the extremes:
- During the high season, the absolute peak month showcases Long River's highest earning potential, with monthly revenues capable of climbing to $6,200, occupancy reaching a high of 73.2%, and ADRs peaking at $251.
- Conversely, the slowest single month of the year, typically falling within the low season, marks the market's lowest point. In this month, revenue might dip to $1,689, occupancy could drop to 26.6%, and ADRs may adjust down to $220.
- Understanding both the seasonal averages and these monthly peaks and troughs in revenue, occupancy, and ADR is crucial for maximizing your Airbnb profit potential in Long River.
Seasonal Strategies for Maximizing Profit
- Peak Season: Maximize revenue through premium pricing and potentially longer minimum stays. Ensure high availability.
- Low Season: Offer competitive pricing, special promotions (e.g., extended stay discounts), and flexible cancellation policies. Target off-season travelers like remote workers or budget-conscious guests.
- Shoulder Seasons: Implement dynamic pricing that balances peak and low rates. Target weekend travelers or specific events. Offer slightly more flexible terms than peak season.
- Regularly analyze your own performance against these Long River seasonality benchmarks and adjust your pricing and availability strategy accordingly.
Best Areas for Airbnb Investment in Long River (2025)
Exploring the top neighborhoods for short-term rentals in Long River? This section highlights key areas, outlining why they are attractive for hosts and guests, along with notable local attractions. Consider these locations based on your target guest profile and investment strategy.
| Neighborhood / Area | Why Host Here? (Target Guests & Appeal) | Key Attractions & Landmarks |
|---|---|---|
| Charlottetown | The capital city of Prince Edward Island, known for its rich history and vibrant arts scene. Ideal for tourists exploring local culture and heritage, with plenty of dining and entertainment options. | Confederation Centre of the Arts, Victoria Row, Province House, Charlottetown Waterfront, PEI National Park |
| Cavendish | Famous for its stunning beaches and being the home of Anne of Green Gables. This area is great for family vacations and nature lovers with plenty of outdoor activities. | Cavendish Beach, Green Gables House, Anne of Green Gables Museum, Cavendish Grove, Horseshoe Cove |
| Summerside | A charming city with a beautiful waterfront and various community events. Known for its friendly atmosphere, making it attractive to families and retirees. | Summerside Waterfront, Harbourfront Theatre, Eptek Art & Culture Centre, Prince Edouard Island Sports Hall of Fame, Linkletter Provincial Park |
| Stanley Bridge | Known for its picturesque setting and proximity to golf courses and parks. Offers a serene escape and is appealing for those wanting a quiet retreat. | Stanley Bridge Provincial Park, Golf courses, Brackley Beach, Local seafood restaurants |
| North Rustico | A quaint fishing village that acts as a gateway to Prince Edward Island National Park. It’s popular for those looking to enjoy nature and local seafood. | North Rustico Harbour, PEI National Park, Lobster Suppers, String of Pearls Marina |
| Borden-Carleton | The gateway to Prince Edward Island, known for its ferry service to New Brunswick. It attracts travelers and those looking to explore the island's unique culture. | Confederation Bridge, Canadian Potato Museum, Borden-Carleton Waterfront |
| Montague | A small town known for its beautiful waterfront along the Montague River, popular with those looking for a peaceful getaway. | Montague Marina, Montague River, River View Park |
| Tignish | A picturesque town known for its rich Acadian culture and coastal charm, perfect for visitors wanting to experience the island's heritage. | Tignish Heritage Inn, Tignish Seawalk, Local craft stores, Acadian Museums |
Understanding Airbnb License Requirements & STR Laws in Long River (2025)
Yes, Long River, Prince Edward Island, Canada enforces high STR regulations. Obtaining a license and ensuring compliance is almost certainly required according to current 2025 STR laws. Always verify the latest short term rental regulations and Airbnb license requirements directly with local government authorities for Long River to ensure full compliance before hosting.
(Source: AirROI data, 2025, based on 35% licensed listings)
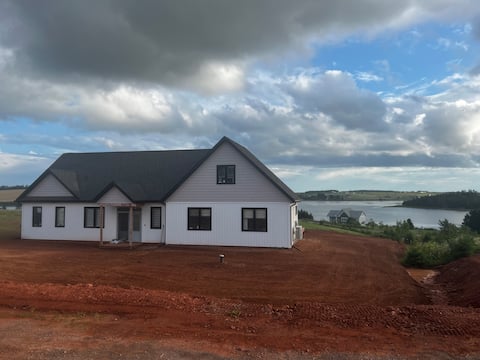
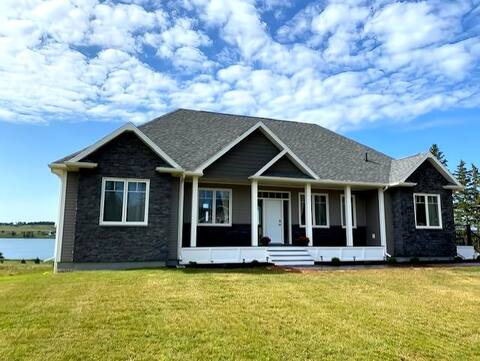
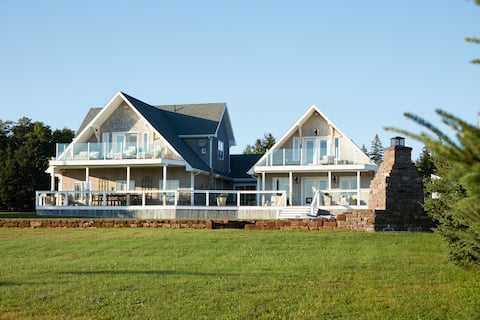
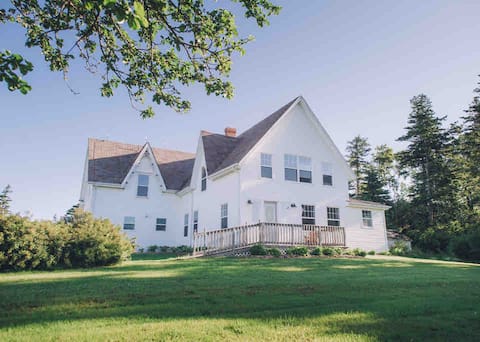
Top Performing Airbnb Properties in Long River (2025)
Benchmark your potential! Explore examples of top-performing Airbnb properties in Long Riverbased on Trailing Twelve Month (TTM) revenue. Analyze their characteristics, revenue, occupancy rate, and ADR to understand what drives success in this market.
Mariner's Retreat PEI
Entire Place • 3 bedrooms
Long River Estate - Waterfront Executive Cottage
Entire Place • 6 bedrooms
Luxury Water View Home with Hot Tub
Entire Place • 5 bedrooms

Bela Vista Getaway - PEI Tourism License #1201185
Entire Place • 3 bedrooms
Updated 5 bdrm farmhouse, so close to the beach!
Entire Place • 5 bedrooms
Long River Retreat in the heart of Anne’s Land
Entire Place • 3 bedrooms
Note: Performance varies based on location, size, amenities, seasonality, and management quality. Data reflects the past 12 months.
Top Performing Airbnb Hosts in Long River (2025)
Learn from the best! This table showcases top-performing Airbnb hosts in Long River based on the number of properties managed and estimated total revenue over the past year. Analyze their scale and performance metrics.
| Host Name | Properties | Grossing Revenue | Stay Reviews | Avg Rating |
|---|---|---|---|---|
| Inn The Woods | 4 | $81,829 | 317 | 4.87/5.0 |
| Kendra | 1 | $67,866 | 8 | 5.00/5.0 |
| Ryan | 1 | $59,319 | 8 | 5.00/5.0 |
| Jonathan | 1 | $51,908 | 8 | 5.00/5.0 |
| George | 1 | $48,402 | 36 | 5.00/5.0 |
| Tiffany | 1 | $48,383 | 16 | 4.94/5.0 |
| Patricia | 1 | $32,169 | 126 | 4.98/5.0 |
| Rosanna | 1 | $27,477 | 37 | 4.86/5.0 |
| Amber | 1 | $25,602 | 59 | 4.88/5.0 |
| Glen And Tammy | 1 | $22,671 | 7 | 5.00/5.0 |
Analyzing the strategies of top hosts, such as their property selection, pricing, and guest communication, can offer valuable lessons for optimizing your own Airbnb operations in Long River.
Dive Deeper: Advanced Long River STR Market Data (2025)
Ready to unlock more insights? AirROI provides access to advanced metrics and comprehensive Airbnb data for Long River. Explore detailed analytics beyond this report to refine your investment strategy, optimize pricing, and maximize your vacation rental profits.
Explore Advanced MetricsLong River Short-Term Rental Market Composition (2025): Property & Room Types
Room Type Distribution
Property Type Distribution
Market Composition Insights for Long River
- The Long River Airbnb market composition is heavily skewed towards Entire Home/Apt listings, which make up 100% of the 17 active rentals. This indicates strong guest preference for privacy and space.
- Looking at the property type distribution in Long River, House properties are the most common (88.2%), reflecting the local real estate landscape.
- Houses represent a significant 88.2% portion, catering likely to families or larger groups.
Long River Airbnb Room Capacity Analysis (2025): Bedroom Distribution
Distribution of Listings by Number of Bedrooms
Room Capacity Insights for Long River
- The dominant room capacity in Long River is 3 bedrooms listings, making up 52.9% of the market. This suggests a strong demand for properties suitable for families or small groups.
- Together, 3 bedrooms and 2 bedrooms properties represent 76.4% of the active Airbnb listings in Long River, indicating a high concentration in these sizes.
- A significant 76.4% of listings offer 3+ bedrooms, catering to larger groups and families seeking more space in Long River.
Long River Vacation Rental Guest Capacity Trends (2025)
Distribution of Listings by Guest Capacity
Guest Capacity Insights for Long River
- The most common guest capacity trend in Long River vacation rentals is listings accommodating 6 guests (52.9%). This suggests the primary traveler segment is likely larger groups.
- Properties designed for 6 guests and 8+ guests dominate the Long River STR market, accounting for 94.1% of listings.
- 94.1% of properties accommodate 6+ guests, serving the market segment for larger families or group travel in Long River.
- On average, properties in Long River are equipped to host 6.7 guests.
Long River Airbnb Booking Patterns (2025): Available vs. Booked Days
Available Days Distribution
Booked Days Distribution
Booking Pattern Insights for Long River
- The most common availability pattern in Long River falls within the 181-270 days range, representing 47.1% of listings. This suggests many properties have significant open periods on their calendars.
- Approximately 76.5% of listings show high availability (181+ days open annually), indicating potential for increased bookings or specific owner usage patterns.
- For booked days, the 91-180 days range is most frequent in Long River (47.1%), reflecting common guest stay durations or potential owner blocking patterns.
- A notable 23.5% of properties secure long booking periods (181+ days booked per year), highlighting successful long-term rental strategies or significant owner usage.
Long River Airbnb Minimum Stay Requirements Analysis
Distribution of Listings by Minimum Night Requirement
1 Night
3 listings
18.8% of total
2 Nights
2 listings
12.5% of total
3 Nights
2 listings
12.5% of total
4-6 Nights
3 listings
18.8% of total
7-29 Nights
3 listings
18.8% of total
30+ Nights
3 listings
18.8% of total
Key Insights
- The most prevalent minimum stay requirement in Long River is 1 Night, adopted by 18.8% of listings. This highlights the market's preference for shorter, flexible bookings.
- A significant segment (18.8%) caters to monthly stays (30+ nights) in Long River, pointing to opportunities in the extended-stay market.
Recommendations
- Align with the market by considering a 1 Night minimum stay, as 18.8% of Long River hosts use this setting.
- If feasible, allowing 1-night stays, especially midweek or during low season, could capture last-minute bookings, as only 18.8% currently do.
- Explore offering discounts for stays of 30+ nights to attract the 18.8% of the market seeking extended stays.
- Adjust minimum nights based on seasonality – potentially shorter during low season and longer during peak demand periods in Long River.
Long River Airbnb Cancellation Policy Trends Analysis (2025)
Moderate
1 listings
6.3% of total
Firm
12 listings
75% of total
Strict
3 listings
18.8% of total
Cancellation Policy Insights for Long River
- The prevailing Airbnb cancellation policy trend in Long River is Firm, used by 75% of listings.
- A majority (93.8%) of hosts in Long River utilize Firm or Strict policies, indicating a market where hosts prioritize booking security.
Recommendations for Hosts
- Consider adopting a Firm policy to align with the 75% market standard in Long River.
- Regularly review your cancellation policy against competitors and market demand shifts in Long River.
Long River STR Booking Lead Time Analysis (2025)
Average Booking Lead Time by Month
Booking Lead Time Insights for Long River
- The overall average booking lead time for vacation rentals in Long River is 100 days.
- Guests book furthest in advance for stays during April (average 161 days), likely coinciding with peak travel demand or local events.
- The shortest booking windows occur for stays in January (average 33 days), indicating more last-minute travel plans during this time.
- Seasonally, Summer (126 days avg.) sees the longest lead times, while Winter (72 days avg.) has the shortest, reflecting typical travel planning cycles.
Recommendations for Hosts
- Use the overall average lead time (100 days) as a baseline for your pricing and availability strategy in Long River.
- For April stays, consider implementing length-of-stay discounts or slightly higher rates for bookings made less than 161 days out to capitalize on advance planning.
- Target marketing efforts for the Summer season well in advance (at least 126 days) to capture early planners.
- Monitor your own booking lead times against these Long River averages to identify opportunities for dynamic pricing adjustments.
Popular & Essential Airbnb Amenities in Long River (2025)
Amenity Prevalence
No amenities with partial availability (less than 100%) were found to display in the chart. All essential amenities might be present in all listings. Check insights below.
Amenity Insights for Long River
- Essential amenities in Long River that guests expect include: TV, Cooking basics, Dishes and silverware, Fire extinguisher, Kitchen, Free parking on premises, Smoke alarm, Wifi, Hot water, Hangers. Lacking these (any) could significantly impact bookings.
Recommendations for Hosts
- Ensure your listing includes all essential amenities for Long River: TV, Cooking basics, Dishes and silverware, Fire extinguisher, Kitchen, Free parking on premises, Smoke alarm, Wifi, Hot water, Hangers.
- Highlight unique or less common amenities you offer (e.g., hot tub, dedicated workspace, EV charger) in your listing description and photos.
- Regularly check competitor amenities in Long River to stay competitive.
Long River Airbnb Guest Demographics & Profile Analysis (2025)
Guest Profile Summary for Long River
- The typical guest profile for Airbnb in Long River consists of primarily domestic travelers (79%), often arriving from nearby Halifax, typically belonging to the Post-2000s (Gen Z/Alpha) group (50%), primarily speaking English or French.
- Domestic travelers account for 78.7% of guests.
- Key international markets include Canada (78.7%) and United States (18.4%).
- Top languages spoken are English (76.2%) followed by French (15.5%).
- A significant demographic segment is the Post-2000s (Gen Z/Alpha) group, representing 50% of guests.
Recommendations for Hosts
- Target domestic marketing efforts towards travelers from Halifax and Toronto.
- Tailor amenities and listing descriptions to appeal to the dominant Post-2000s (Gen Z/Alpha) demographic (e.g., highlight fast WiFi, smart home features, local guides).
- Highlight unique local experiences or amenities relevant to the primary guest profile.
- Consider seasonal promotions aligned with peak travel times for key origin markets.
Nearby Short-Term Rental Market Comparison
How does the Long River Airbnb market stack up against its neighbors? Compare key performance metrics like average monthly revenue, ADR, and occupancy rates in surrounding areas to understand the broader regional STR landscape.
| Market | Active Properties | Monthly Revenue | Daily Rate | Avg. Occupancy |
|---|---|---|---|---|
| Wentworth | 23 | $2,556 | $225.30 | 44% |
| Granville | 10 | $2,491 | $276.93 | 56% |
| Port Williams | 16 | $2,478 | $245.95 | 52% |
| Rustico | 27 | $2,307 | $241.08 | 49% |
| Halls Harbour | 16 | $2,240 | $195.39 | 52% |
| Mill River East | 10 | $2,178 | $158.92 | 53% |
| Grand Pre | 10 | $2,112 | $267.30 | 45% |
| Oyster Bed Bridge | 10 | $2,066 | $184.77 | 65% |
| Souris West | 10 | $2,057 | $201.77 | 50% |
| Augustine Cove | 21 | $2,028 | $214.96 | 48% |